Community Safety Annual Report 2011-2012 - Gauteng Online
Community Safety Annual Report 2011-2012 - Gauteng Online
Community Safety Annual Report 2011-2012 - Gauteng Online

Create successful ePaper yourself
Turn your PDF publications into a flip-book with our unique Google optimized e-Paper software.
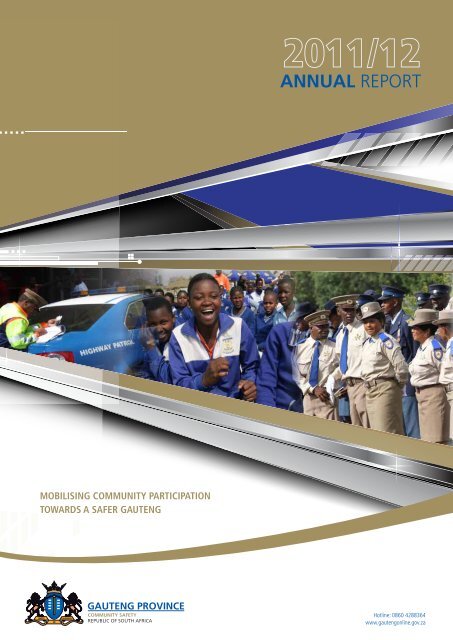
<strong>Annual</strong> <strong>Report</strong>Mobilising community participationtowards a safer <strong>Gauteng</strong>GautenG ProvinCe<strong>Community</strong> <strong>Safety</strong>REPUBLIC OF SOUTH AFRICAGeneral Information • <strong>Annual</strong> <strong>Report</strong> <strong>2011</strong>/12 |1Hotline: 0860 4288364www.gautengonline.gov.za
2 | <strong>Annual</strong> <strong>Report</strong> <strong>2011</strong>/12 • Department of <strong>Community</strong> <strong>Safety</strong>PR NUMBER: 132/<strong>2012</strong>ISBN NUMBER: 978-0-621-40901-7
SUBMISSION OF THE ANNUAL REPORT TO THE EXECUTIVE AUTHORITYMs Nonhlanhla Faith MazibukoMember of the Executive Council for <strong>Community</strong> <strong>Safety</strong>As the Accounting Officer, it gives me great pleasure to present to the Member of the Executive Council (MEC) responsiblefor <strong>Community</strong> <strong>Safety</strong>, Ms Nonhlanhla Faith Mazibuko, the <strong>Annual</strong> <strong>Report</strong> for the period 1 April <strong>2011</strong> to 31 March <strong>2012</strong>._______________________Adv Mongezi TshongweniHOD: <strong>Community</strong> <strong>Safety</strong>________________________Ms Nonhlanhla Faith Mazibuko, MPLMEC: <strong>Community</strong> <strong>Safety</strong>General Information • <strong>Annual</strong> <strong>Report</strong> <strong>2011</strong>/12 |3
“We will ensure that the necessary support is given to the FamilyViolence, Child Protection and Sexual Offences (FCS) units, whilst,at the same time, keeping an unblinking eye on the overallperformance of these units to ensure that the sexual predators inour communities are convicted and sentenced to lengthy periodsof imprisonment”4 | <strong>Annual</strong> <strong>Report</strong> <strong>2011</strong>/12 • Department of <strong>Community</strong> <strong>Safety</strong>
CONTENT1GENERAL INFORMATION 6Vision, Mission and Values 7Organisational Structure 8Legislative mandate 10MEC’s Statement 11Accounting Officer’s Overview 132INFORMATION ON PREDETERMINED OBJECTIVES 17Overall Performance 17Voted funds 17Aim of vote 17Strategic Outcome Oriented Goals 17Overview of the service delivery environment 17Overview of the organisational environment 19Key policy developments and legislative changes 20Departmental revenue, expenditure and other specific topics 20Programme 1: Administration 21Programme 2: Civilian Oversight 21Programme 3: Crime Prevention and <strong>Community</strong> Police Relations 21Programme 4: Traffic Management 213<strong>Annual</strong> Financial Statements 84<strong>Report</strong> of the Audit Committee 86<strong>Report</strong> of the Accounting Officer 88Auditor General <strong>Report</strong> 97Appropriation Statement 100Notes to the Appropriation Statement 113Statement of Financial Perfomance 115Statement of Financial Position 116Cash Flow Statement 117Accounting Policies 118Notes to the <strong>Annual</strong> Statements 123Disclosure Notes to the <strong>Annual</strong> Statements 134Annexures to the Financial Statements 1424Human Resource MANAGEMENT 146Service delivery 147Expenditure 150Employment and Vacancies 152Job Evaluation 154Employment changes 156Employment equity 160Performance rewards 164Foreign workers 167Leave utilisation for the period 1 January <strong>2011</strong> to 31 December <strong>2011</strong> 168HIV and AIDS & health promotion programmes 170Labour relations 171Skills development 173Injury on duty 175Utilisation of consultants 1765Other INFORMATIONGeneral Information • <strong>Annual</strong> <strong>Report</strong> <strong>2011</strong>/12 |5178Contact Details 181
GENERAL INFORMATION011.1 Vision, Mission and Values1.2 Organisational Structure1.3 Legislative Mandate1.4 MEC’s Statement1.5 Accounting Officer’s Overview
GENERAL INFORMATION1.1 Vision, Mission and ValuesVisionTo ensure that <strong>Gauteng</strong> is a safe and secure province.MissionThe <strong>Gauteng</strong> Department of <strong>Community</strong> <strong>Safety</strong> (the Department) is primarily established to ensure effective oversight over theprovince’s law enforcement agencies and to reduce the number of road accidents and fatalities in the province. In addition,the Department contributes towards ensuring that ‘all people in South Africa are and feel safe’. The Department strives toachieve these strategic objectives through:••Monitoring and evaluating the effectiveness and efficiency of policing agencies;••Effective implementation and promotion of appropriate social crime prevention initiatives;••Providing excellent traffic management services;••Coordination of efforts and programmes in the criminal justice system;••Educating and empowering citizens on issues of public safety and coordinating community safety initiatives;••Improving and strengthening relations between the police and communities; and,••Determining community policing needs and priorities in keeping with the provisions of section 206 (1) of the Constitutionof the Republic of South Africa, 1996.ValuesIn pursuit of both its Constitutional and legislative mandates, the Department continued to entrench its adopted values, whichare intended to give direction to our actions and provide guidance to how we behave. The “HEART” values adopted andlived by the Department are the following:••Honesty;••Excellence;••Accountability;••Respect; and,••Transparency.General Information • <strong>Annual</strong> <strong>Report</strong> <strong>2011</strong>/12 |7
1.2 Organisational Structure1.2 Organisational Structure Member of Executive CouncilMs Faith MazibukoChief DirectorMs Nomvula NzimandeDirectorMs Joyce HadebeChief DirectoratePublic Education and InformationChief DirectorateMr Dumisani NgemaPublic Education and InformationMr Dumisani NgemaChief DirectorateCrime Prevention and <strong>Community</strong>PoliceChiefRelationsDirectorateCrime Prevention and <strong>Community</strong>Mr SiphoPoliceThanjekwayoRelationsMr Sipho ThanjekwayoDirectorate OutreachProgrammes Directorate & Communication DevelopmentMs Communication Mashadi Selepe and MarketingMs Mashadi SelepeDirectorateSocial Crime Directorate PreventionSocial Crime PreventionMs Alison WainwrightMs Alison WainwrightDirectorateDirectorateMedia LiaisonMedia LiaisonVacantVacantDirectorateDirectoratePromotion of <strong>Safety</strong>Promotion of <strong>Safety</strong>VacantMs joan MoekettsiHead of DepartmentAdvocate Mongezi Tshongweni Head of DepartmentAdvocate Mongezi Tshongweni Office of the HODChief Director Strategic Support :Mr Stanley Office of De the Klerk HODDirector Chief Cooperative Director Strategic Governance: Support :MrMrIanStanleyRobertsonDe KlerkDirector Cooperative Governance:Mr Ian RobertsonChief Financial OfficerMr Vuyani NobongozaChief Financial OfficerMr Vuyani NobongozaChief DirectorateCorporate ServicesChief DirectorateMs Amanda HartmannCorporate ServicesMs Amanda HartmannDirectorateDirectorateFinance DirectorateMs Desree Finance LedigaMs Desree LegwaleDirectorate LegalMs Legal Nnana Services MaphetoMs Nnana MaphetoDirectorateDirectorateSupply Chain ManagementSupply Chain ManagementMr Trevor EdwardMr Trevor EdwardDirectorateDirectorateHuman Resource ManagementHuman Resource ManagementMs Nontembeko TsianeMs Nontembeko TsianeDirectorate DirectorateInformation TechnologyMs Ms Joey Joey MabenaDirectorateCompliance, Fraud and AuxiliaryServicesMr Alfred Vacant Mohlala (Acting)Chief DirectorateTraffic ManagementChief DirectorateVacant Traffic ManagementMs Lebogang Motlhabane (Acting) DirectorateTraffic Directorate ManagementTraffic Mr Joseph Management MokokaMr Joseph MokokaDirectorateDirectoratePublic Public Transport: Transport TrafficMr ManagementThami MayiselaMr Thami MayiselaDirectorateSpecial Special Services: Services TrafficManagementMs Lebogang MotlhabaneMs Lebogang MotlhabaneDirectorateDirectorateAdministrative Services: TrafficAdministrative Management ServicesMs Violet Makhubu MateeChief DirectorateCivilian OversightChief DirectorateDuxita MistryCivilian OversightMs Duxita MistryDirectoratePolicy Directorate and ResearchPolicy Ms and Tebogo Research UmanahMs Tebogo UmanahDirectorateDirectoratePolice Monitoring Performance and Monitoring Evaluationand Mr Evaluation Solomon MailaMr Solomon MailaDirectorate Directorate<strong>Community</strong> <strong>Community</strong> Police Police Relations RelationsMs Ms Jennifer Jennifer Ntlatseng Ntlatseng8 | <strong>Annual</strong> <strong>Report</strong> <strong>2011</strong>/12 • Department of <strong>Community</strong> <strong>Safety</strong>
MS FAITH NONHLANHLA MAZIBUKOMEC FOR COMMUNITY SAFETYADV. MONGEZI TSHONGWENIHEAD OF DEPARTMENTMr Stanley De KlerkMR VUYANI NOBONGOZAMS AMANDA HARTMANNMR DUMISANI NGEMAMS LEBOGANG MOTLHABANECHIEF DIRECTOR:CHIEF FINANCIAL OFFICERCHIEF DIRECTOR:CHIEF DIRECTOR:ACTING CHIEF DIRECTOR:STRATEGIC SUPPORTCORPORATE SERVICESPUBLIC EDUCATION ANDTRAFFIC MANAGEMENTOFFICE OF THE HODINFORMATIONMS DUXITA MISTRYMR SIPHO THANJEKWAYOMS NOMVULA NZIMANDEMS Joyce HadebeMR Ian RobertsonCHIEF DIRECTOR:CHIEF DIRECTOR:CHIEF DIRECTOR:Director: office ofDirector: StakeholderCIVILIAN OVERSIGHTCRIME PREVENTION ANDOFFICE OF THE MECthe MECManagement andCOMMUNITY POLICECo-operativeRELATIONSGovernanceMR Solomon MailaMS Desree LegwaleMR Trevor EdwardMS NONTEMBEKO TSIANEMS ALISON WAINWRIGHTDirector: POLICEDirector: FinanceDirector: Supply ChainDirector: HUMANDirector: SOCIAL CRIMEPerformance MonitoringManagementRESOURCESPREVENTIONand EvaluationMR Alfred MohlalaMS Joey MabenaMS NNANA MAPHETOMS Violet MateeMR Joseph MokokaActing Director:Chief InformationDirector: LEGAL SERVICESDirector: TrafficDirector: TrafficCompliance, FRAUD andOfficerManagementMANAGEMENTAuxiliary ServiceMR Thami MayiselaMS Tebogo UmanahMS Jennifer NtlatsengMS Joan MoeketsiMS Mashadi SelepeDirector: TrafficDirector: Policy andDirector: <strong>Community</strong>Acting Director:Director: DevelopmentMANAGEMENTResearchpolice RelationsPromotion of <strong>Safety</strong>Communication andmarketingGeneral Information • <strong>Annual</strong> <strong>Report</strong> <strong>2011</strong>/12 |9
1.3 Legislative mandateThe Department derives its mandate primarily from section 206 (3) of the Constitution of the Republic of South Africa, 1996,which, inter alia, entitles the province to monitor police conduct and to oversee the effectiveness and efficiency of theSouth African Police Service (SAPS), including receiving reports on the functioning or performance of the police service. Inaddition, the Department derives its mandate from the following pieces of legislation and policies:••The South African Police Service (SAPS) Act No. 68 of 1995 as amended;••The Civilian Secretariat for Police Service Act, <strong>2011</strong> (Act No. 2 of <strong>2011</strong>);••The Independent Police Investigative Directorate Act (IPID), <strong>2011</strong> (Act No. 1 of <strong>2011</strong>);••The National Road Traffic Act, 1996 (Act No. 93 of 1996);••The National Land Transport Act, 2009 (Act No. 5 of 2009);••The National Road <strong>Safety</strong> Act, 1972 (Act No. 9 of 1972);••The <strong>Gauteng</strong> Transport Framework Revision Act, 2002 (Act No. 8 of 2002);••Administrative Adjudication of Road Traffic Offences (AARTO) Act, 1998 (Act No. 46 of 1998);••Road Traffic Management Corporation (RTMC) Act , 1999 Act No. 20 of 1999);••The <strong>Gauteng</strong> White Paper on Transport Policy, 1997;••The National Crime Prevention Strategy, 1996;••The White Paper on <strong>Safety</strong> and Security, 1998; and,••The White Paper on National Transport Policy, 1996.Non-entity-specific legislationIn addition, the Department is expected to ensure compliance with the following pieces of legislation and policies:••White paper on Transforming Public Service Delivery (Batho Pele White Paper);••South African National Policy Framework for women empowerment and gender equality;••Public Service Act, 1994 (Act No. 103 of 1994), as amended and its regulations;••Public Finance Management Act (PFMA), 1999 (Act No. 1 of 1999) and its regulations;••Promotion of Access to Information Act (PAIA), 2000 (Act No. 2 of 2000);••Promotion of Administrative Justice Act (PAJA), 2000 (Act No. 3 of 2000);••Skills Development Act, 1998 (Act No. 97 of 1998);••South African Qualification Authority Act, 1995 (Act No. 58 of 1995);••Labour Relations Act, 1995 (Act No. 66 of 1995) as amended and its regulations;••Basic Conditions of Employment Act, 1997 (Act No. 75 of 1997);••Employment Equity Act, 1998 (Act No. 55 of 1998);••Occupational Health and <strong>Safety</strong> Act, 1993 (Act No. 85 of 1993);••Preferential Procurement Policy Framework Act, 2000 (Act No. 5 of 2000);••Broad-Based Black Economic Empowerment (BBBEE) Act, 2003 (Act No. 53 of 2003);••Intergovernmental Relations Framework Act, 2005 (Act No. 13 of 2005);••National Youth Commission Act, 1996 (Act No. 19 of 1996);••Child Justice Act, 2008 (Act No. 75 of 2008);••Domestic Violence Act (DVA), 1998 (Act No. 116 of 1998);••Criminal Law (Sexual Offences and Other Related Matters) Amendment, 2007 (Act No. 32 of 2007); and,••<strong>Gauteng</strong> Liquor Act, 2003 (Act No. 59 of 2003).10 | <strong>Annual</strong> <strong>Report</strong> <strong>2011</strong>/12 • Department of <strong>Community</strong> <strong>Safety</strong>
MEC’S STATEMENTFAITH NONHLANHLA MAZIBUKOMEC FOR COMMUNITY SAFETYThe Constitutionally-enshrined right of all our people to equality before the law andto have equal protection and benefit of the law cannot be overemphasised. It goeswithout question that the right to equality is intrinsically linked to the rights to humandignity and to freedom and security of the person, which includes the right to be freefrom all forms of violence. The province’s law enforcement agencies, ably-led by theSAPS as the principal law enforcement agency in the province, are at the forefront ofthe defence of these rights. What this means is that the police must be professional inthe exercise of the powers conferred upon them and in the performance of their dutiesand functions. For that to happen, the police must be sufficiently responsive to the safetyand security needs of all our people, regardless of where they live. It means no singlevictim of crime must go to any of the 137 police stations across the province and betold that there are no police vehicles to serve them. No telephone, whether in a policevehicle or office, must ring unanswered.The battle against TRIO crimes in the provinceDuring the <strong>2011</strong>/<strong>2012</strong> financial year, police performance in the province haslargely improved. I have visited several police stations almost in all the 22 policingclusters in the province and have been able to receive first-hand information on policeperformance at station level. Although serious and violent crimes, especially the TRIOcrimes (house robberies, business robberies and vehicle hijacking) have remained achallenge, significant improvements were made by the province’s law enforcementagencies, working together with the masses of our people in this battle. The leadershipof the SAPS, under the command and control of the Provincial Commissioner, Lieutenant-General Mzwandile Petros, should be commended for their untiring efforts aimed atmaking a contribution towards our realisation of <strong>Gauteng</strong> as a safer, more secureprovince.Gender-based violenceOur province remains besieged by the scourge of violence against women andchildren. In fact, our statistics in this regard are among the highest in the world whencompared with those of countries that share their crime statistics. I agree with MinisterNathi Mthethwa that ‘the number of reported cases of rape remains unacceptablyhigh’, especially considering the long-term negative impact these crimes have onvictims. The Department will continue to focus on this strategic priority area. We willensure that the necessary support is given to the Family Violence, Child Protection andSexual Offences (FCS) units, whilst, at the same time, keeping an unblinking eye on theoverall performance of these units to ensure that the sexual predators in our communitiesare convicted and sentenced to lengthy periods of imprisonment . I would like toencourage the real men in our society, who are opposed to gender-based violence, tojoin our programme on ‘Men as <strong>Safety</strong> Promoters’.Interactions with communities and the Know-Your-Neighbourhood campaignI have interacted with several communities across the province and can confirm thatour people are beginning to be and feel safe. This, in no small measure, is informedby the support given by the people of <strong>Gauteng</strong> to the police as they busied themselveswith the detection of crime perpetrators and investigated the huge volumes of crimesthey grapple with daily. The successes recorded by the police have confirmed my view,which is also shared by many scholars in the field of criminology and police science,General Information • <strong>Annual</strong> <strong>Report</strong> <strong>2011</strong>/12 |11
oth in the country and elsewhere in the global family of nations, that even the best-equipped police force in the world willnot succeed unless it visibly enjoys the unwavering support of the law abiding citizens it polices. I remain convinced that acrime-free <strong>Gauteng</strong> is possible and within reach. When we know who our neighbours are, then we can effectively becomeour brothers’ and sisters’ keepers. I will continue to encourage all our people in the province to join the Department in theKnow-Your-Neighbourhood Campaign given the evidence that the campaign is beginning to yield the desired outcomes.Policing coordination and collaborationThe cooperation between and collaboration amongst the province’s law enforcement agencies has had a major contributoryeffect to the marked reduction in a variety of crime categories during the reporting period. We have seen how the threeMetropolitan Police Departments (Johannesburg, Tshwane and Ekurhuleni) proudly came to the proverbial party in support ofthe SAPS during the policing of the numerous public gatherings, demonstrations and protest marches throughout the periodunder review. The implementation of the decision by the Executive Council to ensure the better management of these publicgatherings, demonstrations and protest marches has gone unhindered. I am proud to state, without any fear of contradiction,that the Department has been able to provide municipalities, especially the City of Johannesburg that understandablyreceives the largest number of notices for public gatherings, with the necessary support to enable them fully to give effectto the Regulation of Gatherings Act, 1993 (Act No. 205 of 1993). Whilst the Constitution guarantees everyone the rightto assemble, to demonstrate, to picket and to present petitions, I must remind our people that the Constitution requiresparticipants in the demonstrations or protest marches to be ‘peaceful and unarmed’.I can assure the province that all our law enforcement agencies know exactly what to do in the event of non-compliancewith the law in this regard. I commend the Department, led by the Head of Department (HOD), for making it possible for theprovince to experience peaceful demonstrations instead of the violence we have seen in the near past.Strengthening community policing and building a social movement against crimeThe Constitution further entitles the province to promote good relations between the police and the community. During thereporting period, the focused in this regard remained on the strengthening of the <strong>Community</strong> Police Forums (CPFs) we haveestablished at each of the 137 police stations in the province. Working together with the leadership of the SAPS in theprovince, we have been able to launch the Constitution of the <strong>Gauteng</strong> Provincial <strong>Community</strong> Police Board (the ProvincialBoard) in Greater Kliptown during the reporting period. The natural expectation is that all our CPFs and Cluster <strong>Community</strong>Police Boards will ensure that their constitutions are effectively aligned to the constitution of the Provincial Board. The CPFshave a central role to play in entrenching partnership policing in the province. As I indicated hereinabove, the police will notsucceed unless they have the unwavering support of the communities they police. It is for this reason that urge members ofall our communities to continue to join the CPFs and the community patroller groups established at their local police stations.Implementation of the Civilian Secretariat and IPID ActsI am fully mindful of the responsibility placed on my shoulders by the enactment of the Civilian Secretariat for Police ServiceAct, <strong>2011</strong> (the Act), especially as it relates to the established of a Provincial Secretariat within a period of 18 monthsfollowing the commencement date of this new piece of legislation. I can state without hesitation that the timeframes stipulatedin the law shall be respected. We will continue to focus on the implementation of the Act as well as the Independent PoliceInvestigative Directorate Act, <strong>2011</strong> in order to professionalise the police service. I expect the Department to be relentlessand fearless in its monitoring of compliance by the SAPS with the various provisions of the Domestic Violence Act, 1998 andthe National Instruction 7 of 1999 on Domestic Violence.Promotion of road safety in the Decade of ActionThe reduction in the number of road accidents and fatalities will remain one of our key areas of focus as we do what wemust do during this Decade of Action. We will be adopting a zero-tolerance approach to the fight against drunken drivingas well as reckless and negligent driving.The message remains as clear as crystal - In <strong>Gauteng</strong>, asibhenywa, asibhay’i-skelem, siyabopha!!Ke a leboga!________________________Faith Nonhlanhla MazibukoMember Of Executive CouncilDepartment Of <strong>Community</strong> <strong>Safety</strong>12 | <strong>Annual</strong> <strong>Report</strong> <strong>2011</strong>/12 • Department of <strong>Community</strong> <strong>Safety</strong>
Accounting Officer’sOverviewADV. MONGEZI TSHONGWENIHEAD OF DEPARTMENTCOMMUNITY SAFETYIt is now common cause that the Department derives its mandate from, amongstothers, the provisions of section 206 (3) of the Constitution of the Republic of SouthAfrica, 1996. In order to give effect to this mandate, and in pursuit of the ProvincialGovernment’s key outcome area of ‘all people in South Africa are and feel safe’, theDepartment developed a five-year strategic plan at the commencement of the currentpolitical term of office (2009-2014). The five-year strategic plan, which is translatedinto an <strong>Annual</strong> Performance Plan each year, identifies several strategic goals andobjectives that are designed to give an impactful effect to the Constitutional andlegislative mandate of the Department. During the period under review, the keystrategic objectives for the Department were linked to the following strategic outputs:••Reduction in violent (TRIO) crimes;••Reduction in crimes against women and children;••Crime perception management;••Reduction in corruption;••Effectiveness and integration of the Criminal Justice System; and,••Reduction in road fatalities.These strategic outputs formed the basis for the Department’s monthly and quarterlyreports to the <strong>Gauteng</strong> Planning Commission, which is located within the Office ofthe Premier, in support of the Provincial Government’s approved IntergovernmentalProgramme of Action (POA) for the period under review.MOutputs and outcomesThere are two fundamental responsibilities that are placed at the strategic nervecentre of the overall work done by the <strong>Gauteng</strong> Department of <strong>Community</strong> <strong>Safety</strong> asit strives to ensure that the people of <strong>Gauteng</strong> are and feel safe. In the first instance,the Department has been established primarily to perform the police oversightfunctions outlined in section 206 (3) of the Constitution. These functions, to which theprovince is entitled, include the following:••To monitor police conduct;••To oversee the effectiveness and efficiency of the police service, includingreceiving reports on the police service;••To promote good relations between the police and the community;••To assess the effectiveness of visible policing; and,••To liaise with the Cabinet member responsible for policing (through the Memberof the Executive Council) with respect to crime and policing in the province.To a very large extent, the abovementioned Constitutional functions are performed bythe Programme: Civilian Oversight within the Department, which essentially performsthe functions of a Provincial Secretariat for <strong>Safety</strong> and Security established in terms ofsection 2 (1) (b) of the SAPS Act, 1995 (Act No. 68 of 1995). This specific sectionof the SAPS Act has, however, been repealed with the enactment of the CivilianSecretariat for Police Service Act, <strong>2011</strong> (Act No. 2 of <strong>2011</strong>). It was through thisprogramme that the Department has been able, among others, to visit a total of 38police stations during the reporting period. Of the 38 police stations visited, 32(84.2%) were identified by the Department, in conjunction with the leadership of theSAPS, as poor-performing police stations that required focused support.General Information • <strong>Annual</strong> <strong>Report</strong> <strong>2011</strong>/12 |13
We remain unfaltering in our belief that the effective and efficient implementation of the Co-Created Policing Strategy andthe Detectives 10 Point Plan by the SAPS will continue to achieve the positive outcomes we have seen in the reportingperiod. The work done by the Department in relation to the implementation of the Regulation of Gatherings Act, 1993 (theGatherings Act) will continue into the future. The Department will continue to provide support to all municipalities across theprovince, especially the three metropolitan municipalities, as they engage with the conveners of public demonstrations andprotest marches in keeping with the provisions of section 4 of the Gatherings Act. In addition, the Department intends tocontinue to encourage the province’s law enforcement agencies to ensure a coordinated approach to policing and closecollaboration in their general policing activities and in the implementation of the Gatherings Act, in particular.The Programme: Crime Prevention and <strong>Community</strong> Police Relations has also been instrumental in the performance of someof the Constitutional functions referred to above. The Department has been able to provide the necessary support to ailing<strong>Community</strong> Police Forums (CPFs) across the province given the centrality of CPFs to the strengthening of good relationsbetween the police and the community.We have learned some valuable lessons during the period under review. Among these lessons was the fact that we need tomaintain an unwavering focus on our safety promotion efforts through our collaborative work with such important stakeholdersas Youth desks and Victim Empowerment Centres. The battle against violence directed towards women and children mustcontinue. I am certain many will agree with me when I state that the strength of democratic systems of governance is, attimes, determined by simply observing how the most vulnerable members of the society are treated. The gains we haverecorded over the reporting period, especially in ensuring that school environments are conducive to effective learning andteaching, have not gone unnoticed. To this end, the Department will continue to work closely with the <strong>Gauteng</strong> Departmentof Education to ensure that the community patroller programme is strengthened in the period ahead.This is indeed a “Decade of Action for Road <strong>Safety</strong>”. What this means is that the Department should continue, as it did overthe reporting period, to focus on reducing the number of road accidents and fatalities in the province. The clearest messageshould be communicated to all our communities and all road users that it is not ‘cool’ to drink and drive, to drink and walk, tobe reckless and negligent on our public roads, to behave like a ‘pumpkin’ and not buckle-up or to simply have a conversationon a mobile phone while driving. We will be adopting a zero-tolerance approach to these road traffic offences.Knowing who our neighbours are remains our clarion call as a Department. We will, through our political head, continueto interact with all our communities, regardless of affluence, to spread this message. The people of <strong>Gauteng</strong> must beencouraged to take charge of their own safety through legal means, which should include partnering with the police in theirlocalities in making their communities safer.Expenditure reviewAs detailed in the Accounting Officer’s <strong>Report</strong> and the <strong>Annual</strong> Financial Statements, the <strong>Gauteng</strong> Department of <strong>Community</strong><strong>Safety</strong> received a final appropriation of R432 747 million for the reporting period. Given the Constitutional and legislativemandate of the Department, which often require labour-intensive deployments, a large proportion of the Department’s budget(R241 926 million), translating into 55.9% of the total budget allocated to the Department, was committed towards thecompensation of employees. The remainder of the budget (R190 821 million) or 44.1% of the total budget has, naturally,gone towards goods and services.Organisational transformation and developmentThe enactment of the Civilian Secretariat for Police Service Act, <strong>2011</strong> (Act No. 2 of <strong>2011</strong>) and the Independent PoliceInvestigative Directorate Act, <strong>2011</strong> (Act No. 1 of <strong>2011</strong>), both of which were referred to hereinabove, impelled the Departmentto start discussions around a revised organisational structure with a view to giving effect to the new responsibilities assignedto the Department by these two pieces of legislation. Although the commencement date for the Civilian Secretariat for PoliceService Act was December 1, <strong>2011</strong>, there were several consultative engagements, even prior to the commencement date,with the Civilian Secretariat for Police in the national sphere, on the possible key components of the organisational structurewe envisage.Further discussions with respect to aligning our structure to the objects and expectations of the Act, were also held with the<strong>Gauteng</strong> Department of Finance as well as the Department of Public Service and Administration on the matter, as is required.These discussions have not been concluded and are expected to proceed well into the <strong>2012</strong>/2013 financial year.14 | <strong>Annual</strong> <strong>Report</strong> <strong>2011</strong>/12 • Department of <strong>Community</strong> <strong>Safety</strong>
02INFORMATION ONPREDETERMINED OBJECTIVES2.1 Overall performance2.1.1 Voted funds2.1.2 Aim of vote2.1.3 Strategic outcome orientated goals2.1.4 Overview of the service delivery environment2.1.5 Overview of the organisational environment2.1.6 Key policy developments and legislative changes2.1.7 Departmental revenue, expenditure, and other specific topics2.1.8 Departmental expenditure2.1.9 Earmarked funds2.1.10 Capital investment, maintenance and asset management plan2.2 Programme PerformanceProgramme 1: AdministrationProgramme 2: Civilian OversightProgramme 3: Crime Prevention and <strong>Community</strong> Police RelationsProgramme 4: Traffic Management16 | <strong>Annual</strong> <strong>Report</strong> <strong>2011</strong>/12 • Department of <strong>Community</strong> <strong>Safety</strong>
2. INFORMATION ON PREDETERMINED OBJECTIVES2.1 Overall Performance2.1.1 Voted fundsThe appropriated voted funds for the financial year under review were as follows:Main AppropriationR’000Adjusted AppropriationR’000ActualAmount Spent R’000(Over) /Under ExpenditureR’000R 423,747 R 423,747 R 400,622 R 23,145Responsible MECMs Nonhlanhla Faith Mazibuko, MPLAdministering DepartmentDepartment of <strong>Community</strong> <strong>Safety</strong>Accounting OfficerAdvocate Mongezi Tshongweni2.1.2 Aim of voteThe principal aim of the <strong>Gauteng</strong> Department of <strong>Community</strong> <strong>Safety</strong> is to monitor the conduct of the law enforcement agenciesin the province and to oversee their effectiveness and efficiency. In addition, the vote aims to improve road safety andmobilise all communities in support of crime prevention initiatives.2.1.3 Strategic Outcome Oriented GoalsIn keeping with the Department’s strategic plan for the period 2009-2014, the Department identified thefollowing key strategic outcome-oriented goals in pursuit of its mandate:••To ensure compliance with the Road Traffic Act;••To promote an ethical environment throughout the Department, including at Driver and License Testing Centres (DLTCs)and Vehicle Testing Stations (VTSs);••To prevent violence against vulnerable groups within the province;••To promote youth safety in all communities across the province;••To mainstream and coordinate social crime prevention;••To strengthen community policing structures for the improvement of community police relations;••To build and strengthen a social movement against crime;••To educate and mobilise communities in support of anti-crime initiatives;••To improve the quality of policing; and,••To create a safe and secure road environment.2.1.4 Overview of the service delivery environmentThe <strong>Gauteng</strong> Provincial Government (GPG) has adopted several strategic objectives, which it pursues in theexecution of its electoral mandate for the current (2009-2014) political term of office and to improve servicedelivery to all communities across the province. These strategic priorities or areas of focus, which form the basisof what the Provincial Government does, are the following:••Creating decent work and building a growing, inclusive economy;••Promoting quality education and skills development;••Providing better health care for all;••Stimulating rural development and food security;••Intensifying the fight against crime and corruption;••Building cohesive and sustainable communities; and,••Strengthening the developmental State and good governance.Information on Predetermined Objectives • <strong>Annual</strong> <strong>Report</strong> <strong>2011</strong>/12 |17
The Constitution of the Republic of South Africa, 1996 guarantees everyone the right to freedom and security ofthe person, which includes, among others, the right to be free from all forms of violence. It is abundantly clearthat this right cannot be exercised in an environment where people live in fear. The focus of the Departmentover the period under review has been on the performance of the SAPS, especially at station level. It has been,and remains, the Department’s view that those who live and work in the province will only agree with us thatthe quality of policing is improving, when they see visible improvements in the delivery of policing services atstation level. The police station is the basic command unit of the SAPS and is thus reflective of the overall publicimage of the Service.The promotion of good relations between the police and the communityIn recognition of the indisputable fact that the police can only succeed if they are supported by the communitiesthey police, the Department spent a considerable amount of time interacting with various communities acrossthe province with a view to encouraging the people of <strong>Gauteng</strong> to participate in social crime preventionstructures within their communities. Through its political head, the Department sought to communicate a messagethat the province will undoubtedly realise improvements in the quality of policing if all members of the variouscommunities and organs of civil society are supportive of government’s crime prevention and combating efforts.Members of the communities were urged to join the CPFs established at each of the 137 police stations acrossthe province in terms of the provisions of section 19 of the SAPS Act, 1995 (Act No. 68 of 1995) and toparticipate in the activities of these CPFs whose primary role is to maintain a partnership between the police andcommunities in the battle against the scourge of serious and violent crime. In addition, the Department has beenencouraging members of the communities to join the community patroller movement, which is building on theTake Charge campaign launched by the Department in the latter part of the 2004-2009 political term of office.The community patrollers, who are working closely with the CPFs and the police, have made a tremendouscontribution to the safety of those communities in which they are deployed.There is no doubt that the crime challenge can effectively be defeated if everyone in society accepts that he/shehas a role to play and that the police alone cannot succeed in pushing back the frontiers of criminal victimisation.Know-Your-Neighbourhood campaignThe Department has remained steadfast in its belief that knowing who your neighbours are can have a contributoryfactor towards the prevention of crime and safer communities. To this end, the focus during the reporting periodhas been on taking the Know-Your-Neighbourhood campaign even to those communities that believed that theirsafety and security interests will be better served through isolating themselves from their neighbours. Criminalshave taken full advantage of this anomaly. They know that the neighbours will not ask questions when they seea truck on a pavement being loaded with all manner of contraband. This must sure change. A true neighborshould be his/her neighbour’s keeper.The link between the abuse of alcohol or drugs and crimeThe abuse of alcohol, drugs and other dependence-producing substances, especially by young people inand out of school, has proven to be having a direct link with the perpetration of some crime categories in theprovince. Experts in the field of criminology and police investigating officers have informed the Department intheir various interactions with the Department that many criminals take these substances before and, at times,during the perpetration of serious and violent crimes. During the period under review, the Department has goneinto several communities to raise public awareness of this unfortunate link. Working in close cooperation with the<strong>Gauteng</strong> Department of Education, the Department has recruited and deployed community patrollers at variousschools across the province. These community patrollers have been instrumental in ensuring that dangerousweapons and drugs are not carried into schools. It must, however, be acknowledged that a lot more work stillneeds to be done, not only by the Provincial Government, but also by communities and other social partners,to fight this malady.Public demonstrations and protest marchesThe service delivery environment in which the Department operated during the reporting period was alsocharacterised by public demonstrations and protest marches, some of which, unfortunately, turned violent. TheDepartment took responsibility for the implementation of the decision by the Executive Council that the publicdemonstrations and protest marches be properly managed and the Regulation of Gatherings Act, 1993 (ActNo, 205 of 1993) be fully implemented.18 | <strong>Annual</strong> <strong>Report</strong> <strong>2011</strong>/12 • Department of <strong>Community</strong> <strong>Safety</strong>
Whilst the Constitution provides for the right to assemble, to demonstrate, to picket and present petitions, theDepartment has, in its interactions with the various conveners of the demonstrations and protest marches, placedemphasis on the legal requirement that those who participate in the demonstrations or protest marches shouldbe ‘peaceful and unarmed’. The law enforcement agencies in the province, led by the SAPS as the principallaw enforcement agency, have been able, and will continue, to cooperate and to collaborate in their collectiveefforts aimed at ensuring that the public demonstrations and protest marches are peaceful.Public perceptions of crime and safety in the provinceIt is generally accepted that different people and communities will experience crime differently. Whilst theDepartment is aware that certain crime categories in the province have shown impressive downward trends,which led to the province occupying position one in terms of police performance nationally, it is important torefer to independent research on the matter. The Victims of Crime Survey (VOCS) <strong>2011</strong>, which was conductedby Statistics South Africa, indicates that perceptions about crime and safety differed according to factors suchas employment status, population group and area of residence. According to VOCS <strong>2011</strong>, whilst about twothirds(65%) of households in <strong>Gauteng</strong> indicated that they took physical protection measures to protect theirhomes, 66% of those surveyed stated that the most effective way to dealing with crime would be to address thecontributory socio-economic factors.Of particular importance to the Department was the finding that 60% of the people surveyed were satisfied withhow the police and the courts did their work. In addition, VOCS <strong>2011</strong> found that about 80% of householdswho were satisfied with the police in their areas also felt that the police were committed. It is encouraging tonote from the survey that seven-tenth (70.8%) of households are of the view that the police are trustworthy. TheDepartment will continue to encourage the police to address their internal challenges whilst periodically sharingtheir successes with communities.Reduction in road accidents and fatalitiesThe reduction in the number of road accidents and fatalities has remained an area of strategic focus for theDepartment during the reporting period. <strong>Gauteng</strong> is among the highest contributors to the number of accidentsand fatalities each year. This is hardly surprising given the fact that the province has the highest number ofvehicles compared to any other province in the country. The promotion of road safety, with particular emphasison responsible road usage, will remain the Department’s central theme in this regard. Given the fact that morethan 40% of all road accident fatalities comprise pedestrians each year, the Department’s road safety messageswill primarily target this category of road users.2.1.5 Overview of the organisational environmentWhilst there have been areas of natural contestation between the Department and organised labour during thereporting period, relations have, overall, been cordial. The organisational structure of the Department is expectedto change, largely owing to the new responsibilities brought about by enactment of the Civilian Secretariat forPolice Service Act, <strong>2011</strong> (Act No. 2 of <strong>2011</strong>) and the Independent Police Investigative Directorate Act, <strong>2011</strong>(Act No. 1 of <strong>2011</strong>). The Civilian Secretariat for Police Service Act places an obligation on the MEC toestablish a Provincial Secretariat for Police. The MEC is further obliged and bound by law to appoint the Headof the Provincial Secretariat in consultation with the Minister of Police within a period of 18 months following thecommencement of the Act. Given that the commencement date of the Act is December 1, <strong>2011</strong>, the ProvincialSecretariat for Police is expected to have been constituted not later than June 30, 2013.In addition, the Department is given the responsibility to monitor and to report on compliance by the SAPS withthe Domestic Violence Act, 1998 (Act No. 116 of 1998). This was initially the responsibility of the IndependentComplaints Directorate (ICD), which will become the Independent Police Investigative Directorate (IPID) witheffect from April 1, <strong>2012</strong>. An additional responsibility given to the Department by the new IPID Act relates tothe monitoring of the implementation of the recommendations made by the IPID to police management. Theserecommendations would relate to the matters the IPID will have investigated in keeping with the dictates ofsection 28 of the IPID Act. There can be no doubt, therefore, that the new responsibilities will require that thenecessary competencies be created and resources, both human and material, be acquired to ensure that theDepartment fully executes its legislative mandate.Information on Predetermined Objectives • <strong>Annual</strong> <strong>Report</strong> <strong>2011</strong>/12 |19
2.1.6 Key policy developments and legislative changesAs indicated at paragraph 2.1.5 above, the most fundamental policy developments and legislative changes for theDepartment related to the Civilian Secretariat for Police Service Act, <strong>2011</strong> and the IPID Act, <strong>2011</strong>. These two pieces oflegislation were signed into law by the President on May 16, <strong>2011</strong>. The Civilian Secretariat for Police Service Act repealedsection 2 of the SAPS Act, 1995 (Act No. 68 of 1995), which dealt with the establishment of the Secretariat for <strong>Safety</strong> andSecurity, both in the national and provincial spheres. In addition, the definitions of ‘Secretariat’ and ‘Secretary’ in the SAPSAct were substituted by their respective references in the new law.2.1.7 Departmental revenue, expenditure and other specific topicsCollection of departmental revenueFor the financial year <strong>2011</strong>/12, the Department had an approved revenue collection estimated at approximatelyR11,748 million per annum. The actual collection for the financial year, however, resulted in an actual amountof R13,775 million per annum. The Department exceeded the appropriated revenue as a result of strengtheningits relationship with the RTMC to ensure that the revenue collected by the RTMC on behalf of the Department istimeously surrendered to the Department. It should be noted that the RTMC transferred all the revenue due to theDepartment during the reporting period.The table below provides a breakdown of the sources of revenue:Source of Revenue 2008/09Actual2009/10Actual2010/11Actual<strong>2011</strong>/12Target<strong>2011</strong>/12Actual% Deviationfrom targetOthers: Sales 2,698 3,680 3,251 3,371 5,446 162%Fines, Penalties and Forfeitures 5,293 4,140 8,400 7,950 7,015 89%Interest, Dividends and Rent on hand 9 86 30 36 36 100%Financial Transactions in Assets and Liabilities 1,032 424 167 391 1,278 327%Total departmental receipts 968 8,330 11,848 11,748 13,775 118%2.1.8 Departmental expenditureThe Departmental expenditure trends for the financial year <strong>2011</strong>/12 can be analysed as follows:Compensation of EmployeesThe under-expenditure was as a result of vacant positions not filled during the financial year.Goods and ServicesThe Department experienced an under-expenditure of R16.4 million, which is attributed to the following:••An amount of R6 575 million, which was allocated to the Close Circuit Television (CCTV) project, was not spent as aresult of challenges experienced during the tender processes on the project; and,••G-Fleet experienced some technical challenges with its system and could, therefore, not process the interface forFebruary and March <strong>2011</strong>. On average, the Department pays G-Fleet an amount of R4 million per month.Transfers and subsidiesThe expenditure on transfers and subsidies relates to the monies paid towards the life insurance schemes forcommunity patrollers as well as the monies paid out in terms of injuries sustained by traffic officers in the line ofduty.Payment for capital assetThe expenditure on capital assets relates to procurement of it equipment, departmental vehicles and motorbikesto increase the fleet for traffic officers with a view to improve law enforcement operations in the province.Payment for financial assetsThe expenditure relates to debts that were written off during the financial year under review in line with the debtmanagement policy of the Department.20 | <strong>Annual</strong> <strong>Report</strong> <strong>2011</strong>/12 • Department of <strong>Community</strong> <strong>Safety</strong>
2.1.9 Earmarked fundsDue to concerns about the prevalence of Automated Machine (ATM) bombings, it was agreed that 195 CCTV cameraswould be placed at hotspots in the province. Thereafter the Premier in her State of the Province Address indicated that allCCTV cameras in <strong>Gauteng</strong> must be linked to the Intelligent Transport System. To this end the department received R6, 575million for the maintenance, audit and integration of CCTV cameras in the province. The Department is managing thisprocess to ensure that the objectives are met. The tender for the maintenance, audit and integration was advertised, a BidEvaluation Committee was established consisting of the SAPS, South African Banking Risk Information Centre (SABRIC) andthe department. The tender was awarded to the successful service provider by the Departmental Acquisitions Council. Therewas full compliance with the PFMA.2.1.10 Capital investment, maintenance and asset management planAsset ManagementThe Department has the following types of assets on the asset register:••Capital assets;••Minor assets; and,••Intangible assets (software).The Department has moved from a manual asset register to the System Application Programme (SAP) Asset Managementmodule to ensure compliance with the Asset Management Reforms. This has assisted the Department in ensuring thatreporting is made easier and assists in the verification process.Redundant / obsolete assets were disposed of through the Asset Disposal Committee, and in accordance with the AssetDisposal Policy. Assets from which the Department didn’t derive direct benefit were transferred to the user entity, i.e. theSAPS. The assets reflected on the departmental asset register were in good condition. The asset register was updated asand when acquisitions and movements occurred. Asset verification was conducted and the asset register was accordinglyupdated. Monthly reconciliations were performed to ensure that the General Ledger on the Budget Administration System(BAS) system reconciled with the asset register. These reconciliations were submitted to the Provincial Treasury on a monthlybasis, as required. No maintenance projects were undertaken in the year under review as the Department didn’t have aninfrastructure capital budget.InventoryThe Department was in the process of migrating to the SAP Inventory Management System. Stock counts were done on aquarterly basis in all warehouses. The value of the stock on hand was disclosed on the Interim Financial Statements and the<strong>Annual</strong> Financial Statement.2.2 Programme performanceThe activities of the Department of <strong>Community</strong> <strong>Safety</strong> are implemented by the following programmes:Programme 1: Administration••Office of the Member of the Executive Council (MEC)••Office of the Head of Department (HOD)••Financial Management••Corporate ServicesProgramme 2: Civilian Oversight••Monitoring and Evaluation••Policy and ResearchProgramme 3: Crime Prevention and <strong>Community</strong> Police Relations••Promotion of <strong>Safety</strong>••Social Crime Prevention••Public Education and Information••<strong>Community</strong> Police RelationsProgramme 4: Traffic Management••Traffic Law Enforcement••Public Transport Inspections••Special Services••Traffic College••Road <strong>Safety</strong> PromotionInformation on Predetermined Objectives • <strong>Annual</strong> <strong>Report</strong> <strong>2011</strong>/12 |21
Programme 1: Administration01“In order to give effect to this mandate, and in pursuit of theProvincial Government’s key outcome area of ‘all people inSouth Africa are and feel safe’, the Department developed afive-year strategic plan at the commencement of the currentpolitical term of office (2009-2014).”22| <strong>Annual</strong> <strong>Report</strong> <strong>2011</strong>/12 • Department of <strong>Community</strong> <strong>Safety</strong>
2.2.1 Programme 1: AdministrationThe programme provides administrative and management support to the Office of the MEC and the HOD. It also carries outall financial, supply chain, legal, fraud, risk, auxiliary support and human resource management activities for the Department.These functions are assigned to the Chief Financial Officer (CFO) and the Division: Corporate Services. The Department wasbound to effect some changes to the <strong>Annual</strong> Performance Plan <strong>2011</strong>-2014, in relation to the Sub-Programmes: Office of theMEC, Office of the HOD and Corporate Services. These changes were occasioned by the new priorities identified by theExecutive Council in February 2010, which include the prevention and combating of corruption against the province’s lawenforcement agencies. There are no changes to the budget structure of the programme.Sub-programme 1.1: Office of the MECPurposeThe purpose of the Office of the MEC is to provide the MEC with strategic, technical and effective administrative support toenable her to perform her powers, duties and functions.Strategic ObjectivesThe strategic objectives for the Office of the MEC are as follows:••To provide political leadership to the Department; and,••To provide strategic, technical and effective administration support to the MEC.Performance indicators and targetsThe Office of the MEC focused on the provision of strategic support to the MEC to enable her to perform her political dutiesand functions during the reporting period. The office also assisted the MEC to reach out more to the communities whichhas strengthened the relations between the Department and the communities. This was done through management of thediary to ensure that it takes care of the community engagements. The office managed to strengthen the relationships with theLegislature especially on the coordination of the responses to the questions posed to the Department. The office also liaisedwith the cabinet secretariat to keep track of all the Departmental submissions to Executive Council (EXCO) and handling theresponses of all EXCO related matters. The Office was also responsible for the management of the budget allocated to theoffice to ensure that it is adequately resourced.Sub-programme 1.2: Office of the Head of DepartmentPurposeThe purpose of the Office of the HOD is primarily to provide the Accounting Officer with strategic, technical and effectiveadministrative support to enable him/her to fully exercise his/her powers and to perform his/her duties and functions.Strategic ObjectivesThe Office of the HOD performs its duties and functions in pursuit of the following strategic objectives:••To plan, implement, monitor, evaluate and report; and,••To provide support that will enable the Accounting Officer to execute strategic leadership of the Department.Performance indicators and targetsDuring the reporting period, the Office of the HOD focused on the provision of strategic support to the entirety of theDepartment, which included the coordination of the strategic planning function. The Office of the HOD also took responsibilityfor the monitoring, evaluation and reporting on overall organisational performance, including the submission of performancereports to the <strong>Gauteng</strong> Legislature, the <strong>Gauteng</strong> Treasury, the Audit Committee, the <strong>Gauteng</strong> Planning Commission andother governance structures within the Provincial Government. Several planning sessions were convened by the Office ofthe HOD and these were also used to reflect on the progress made by the Department in the pursuit of its Constitutional andlegislative mandate. In addition, the strategic sessions were meant to also prepare for the <strong>Annual</strong> Performance Plan (APP)<strong>2012</strong>/2013. The Office of the HOD also coordinated a Budget Council session to ensure continuous alignment of costeddepartmental plans and the budget allocation to the Department for the reporting period.It was also the responsibility of the Office of the HOD during the reporting period to ensure that quarterly review sessionswere conducted to enable the HOD to track the performance of the various business units against the commitments made inboth the APP <strong>2011</strong>/<strong>2012</strong> and the Programme of Action <strong>2011</strong>/<strong>2012</strong>.Programme 1: Administration • <strong>Annual</strong> <strong>Report</strong> <strong>2011</strong>/12 |23
Sub-programme: Office of the HODPerformance IndicatorCoordination of departmentalreportsBaseline (Actual Output) Actual performance against target Reason for variance2010/11 Target (<strong>2011</strong>/<strong>2012</strong>) Actual (<strong>2011</strong>/<strong>2012</strong>)- 1 annual report 1 annual report Target met.4 quarterly reports to 4 quarterly reports to 4 quarterly reports to Target met.LegislatureLegislatureLegislature4 quarterly reports to Treasury 4 quarterly reports to 4 quarterly reports to Target met.TreasuryTreasury1 report to Standing 1 report to Standing 1 report to Standing Target met.Committee on Public Accounts(SCOPA)Committee on PublicAccounts (SCOPA)Committee on PublicAccounts (SCOPA)12 monthly reports on 12 monthly reports on 12 monthly reports on Target met.Programme of Action (POA) Programme of Action(POA)Programme of Action(POA)4 quarterly reports on 4 quarterly reports on 4 quarterly reports on Target met.programme on cabinetdecisionsprogramme on cabinetdecisionsprogramme on cabinetdecisions4 quarterly reports on GEYODI 4 quarterly reports on 4 quarterly reports on Target met.GEYODIGEYODIBudget statement coordinated 1 budget statement 1 budget statement 1 budget statement Target met. This was done inpreparation for the financial year<strong>2012</strong>/2013.Budget vote speechcoordinatedLogistical support to theAccounting Officer provided1 budget vote speech 1 budget vote speech 1 budget vote speech Target met.- 27 meetings 27 meetings Target met. This was in relationthe logistical support to themeetings held in the Office ofthe HOD.- Develop 1 departmentalyear planner1 departmental yearplanner developedTarget met.Changes to planned targets: The Office of the HOD did not have any changes made to the planned targets during thereporting period.Programme 1: Administration • <strong>Annual</strong> <strong>Report</strong> <strong>2011</strong>/12 |25
Sub-programme: Financial managementPerformance indicator Baseline (Actual Output)2010/11Revenue effectively managed R11 848 000 revenuecollectedActual performance against targetTarget (<strong>2011</strong>/<strong>2012</strong>) Actual (<strong>2011</strong>/<strong>2012</strong>)R11 712 000 revenuecollectedR13 776 000 revenuecollectedReason for varianceTarget exceeded as actual revenuegenerated exceeded the projectedincome. In addition, this wasalso as a result of the increase inthe implementation of road lawenforcement by traffic.Budget effectively managedand controlled- 12 reports onreconciliation of revenuecollected1 confirmation letter of budgetcaptured on BAS4 budget monitoring sessionsconducted1 confirmation letter ofbudget captured on BAS12 budget monitoringsessions conducted12 reports produced onreconciliation of revenuecollected1 confirmation letterof budget captured onBAS was drafted andsubmitted to Treasury8 budget monitoringsessions conductedTarget met.Target met.Target not met. Four budgetmonitoring sessions could not beheld due to quarterly preparation ofthe interim financial statements inline with practice note. Compliancecommitments.In Year Monitoring reportssubmitted to Treasury13 IYM reports 13 IYM reports 13 IYM reports Target met.Application for virements 1 application for virements 2 applications forvirementsProjections submitted toTreasury1 annual projection report 1 annual projectionreport2 applications forvirements submitted toTreasury1 annual projectionreport submitted toTreasuryTarget met.Target met.Confirmation letter of budgetto Treasury1 confirmation letter 1 confirmation letter 1 confirmation lettersubmitted to TreasuryTarget met.<strong>Annual</strong> Financial Statementssubmitted to Auditor General(AG) and Treasury1 <strong>Annual</strong> Financial Statementsubmitted to AG and Treasury1 <strong>Annual</strong> FinancialStatement submitted toAG and Treasury1 <strong>Annual</strong> FinancialStatement submitted toAG and TreasuryTarget met.Consolidated procurementplan1 consolidated procurementplan1 consolidatedprocurement plan1 consolidatedprocurement planTarget met.Commitment reports12 monthly commitmentreports12 monthly commitmentreports12 monthly commitmentreports producedTarget met.Service Level Agreementwith <strong>Gauteng</strong> Shared ServiceCentre (GSSC)12 reports on SLA with GSSC 12 reports on SLA withGSSC12 reports on SLA withGSSCTarget met.Programme 1: Administration • <strong>Annual</strong> <strong>Report</strong> <strong>2011</strong>/12 |27
Sub-programme: Financial managementPerformance indicator Baseline (Actual Output)Focus group meetings withGSSCActual performance against target Reason for variance2010/11Target (<strong>2011</strong>/<strong>2012</strong>) Actual (<strong>2011</strong>/<strong>2012</strong>)2 focus group meetings 4 focus group meetings 1 focus group meeting Target not met. Due to the nonavailability of <strong>Gauteng</strong> Department ofFinance staff and the migration offunctions to the Departments, thesefocus group meetings were not held.Asset verifications 2 asset verifications 2 asset verifications 1 asset verificationconductedTarget not met. Due to the migrationfrom the manual system to the SAPautomated asset register, the interimverification could not be conductedduring the migration process.Asset register in place 12 updates on asset register 12 updates on assetregister12 updates on assetregisterTarget met.Asset register reconciliation12 asset registerreconciliations12 asset registerreconciliations12 asset registerreconciliationsTarget met.Asset Disposal1 asset disposal committeemeeting2 asset disposalcommittee meetings1 asset disposalcommittee meeting heldTarget not met. Disposal committeemeetings are conducted after theverification process. Due there being1 verification process, only 1 Disposalmeeting was held.Stock levels monitored12 reports on stock levelsmonitored12 reports on stocklevels monitored12 reports on stocklevels monitoredTarget met.Monthly reconciliation ofstock on hand against systemreport12 reports on stockreconciliations produced12 reports on the stockreconciliations produced12 reports on the stockreconciliations producedTarget met.Stock takes 4 stock takes 4 stock takes 4 stock takes Target met.Renewed trip authorities 12 monthly trip renewalsessions12 monthly trip renewalsessionsTravel claims processed 12 monthly travel claims 12 monthly travel claimssessionssessionsFleet expenditure reports 12 monthly expenditure 12 monthly expenditurereportsreportsBEE targets monitored - 12 meetings on BEEtargets monitored12 monthly trip renewal Target met.sessions12 monthly travel claims Target met.sessions held12 monthly expenditure Target met.reports1 meetings on BEEtargets monitoredTarget not met. Response fromservice providers was not adequate.Some BEE service providers do nothave sufficient expertise and capacityto render service required by thedepartment.BBBEE reports 12 BBBEE reports 12 BBBEE reports 12 BBBEE reportsprdoucedTarget met.28| <strong>Annual</strong> <strong>Report</strong> <strong>2011</strong>/12 • Department of <strong>Community</strong> <strong>Safety</strong>
Sub-programme: Financial managementPerformance indicator Baseline (Actual Output) Actual performance against target Reason for variance2010/11Target (<strong>2011</strong>/<strong>2012</strong>) Actual (<strong>2011</strong>/<strong>2012</strong>)BBBEE forums - 4 BBBEE Forums 1 BBBEE forum held Target not met. <strong>Gauteng</strong> Departmentof Finance did not schedule theremaining 3 BBBEE forums for theDepartment to attended, which wasattended.Risk assessment 1 risk assessment workshop 1 risk assessmentworkshop1 risk assessmentworkshop heldTarget met.Risk monitoring 4 risk monitoring meetings 11 risk monitoringmeetings3 risk committeemeetings heldTarget not met. Due to the changeof the risk management policy whichstates that meetings should be heldon a quarterly basis.Changes to planned targets: No changes were made on the planned targets.Programme 1: Administration • <strong>Annual</strong> <strong>Report</strong> <strong>2011</strong>/12 |29
Sub-programme 1.4: Corporate ServicesDirectorate: Legal servicesPurposeThe purpose of the sub-programme is to render an effective and efficient legal support service to the Department.Strategic ObjectivesThe sub-programme performs its duties and functions in pursuit of the following strategic objectives:••To provide advisory services for legal questions;••To provide services for policy and litigation management;••To provide services for contract management; and,••To provide services for legislative compliance.Performance indicators and targetsLitigation ManagementA total of 16 matters were finalised during the reporting period and these were carried over from the 2010/11 financialyear. 20 summonses were served and 12 letters of demand received during the reporting period. In addition, consultationswith office of the State Attorney and relevant stakeholders were held for purposes of requiring advice or clarifying factson matters before the courts. The Department currently has a total caseload of 63 active litigation files. Overall, the subprogrammeensured, through its litigation tracking system, the provision of legal representation on matters to which theDepartment needed to respond in court.PoliciesThe Department’s business units perform their function within a controlled or regulated environment. During the reportingperiod, 12 policies were identified for review and it was discovered, through interactions with the business units responsiblefor the implementation of the said policies, that amendments thereto were not necessary. Overall, the sub-programmeprovided support to the Policy Management Committee in relation to policy-related matters requiring decision making.ContractsThe Contract Management Framework was reviewed for purposes of ensuring the effective procurement of external servicesby the Department. In the reporting period, 29 Service Level Agreements (SLAs) and Memoranda of Understanding (MOUs)were drafted and/or vetted. Only 4 service level agreements were vetted by the unit as drafting was not done internallyand in doing so, the unit ensured the protection of the interests of the Department in line with procured service. Workingin collaboration with other business units, the sub-programme ensured the safeguarding of the Department’s interests in theconclusion of the agreements it entered into with service providers.Legislative ComplianceThree quarterly reports on the Department’s overall compliance were completed, the unit did not compile the 1st quarterreport as there was no activity in relation to legislative compliance. The unit received 3 requests for information in terms ofPromotion of Access to Information Act, 2000 (Act No. 2 of 2000) and these were all responded to. The unit preparedand presented 5 memos/summaries of new pieces of legislation to the Risk and Policy Management Committees during thereporting period.<strong>Report</strong>s were submitted to the South African Human Rights Commission (SAHRC) in terms of section 32 of the Constitutionof the Republic of South Africa, 1996.Legal opinionsThe sub-programme provided 17 legal opinions on diverse questions from the Department’s business units, which related totheir specific areas of responsibility. The provision of legal opinions is aimed at informing decision making on matters relevantto the effective functioning of the Department.30| <strong>Annual</strong> <strong>Report</strong> <strong>2011</strong>/12 • Department of <strong>Community</strong> <strong>Safety</strong>
Sub-programme: Legal servicePerformance indicator Baseline (Actual Output)2010/11Actual performance against targetTarget (<strong>2011</strong>/<strong>2012</strong>) Actual (<strong>2011</strong>/<strong>2012</strong>)Reason for varianceLitigation management servicesprovided12 reports on litigation casestracked and responded to12 reports on litigation casestracked and responded to12 reports on litigation casestracked and responded toTarget met.Policy environment managed12 reports on policiesreviewed24 policies to be reviewed 12 policies identified forreviewTarget not met. The reviewof policies is informed by theadopted policy framework.The variance on the target isinformed by a baseline of thenumber of policies instead ofreview clause in each policy.Contracts management 12 reports on contractsservices provideddraftedLegislative compliance monitored 4 quarterly reports on the levelsof compliance12 report on policiesreviewed and drafted12 reports on contractsdrafted4 quarterly reports on thelevels of compliance12 reports on policiesreviewed and draftedsubmitted12 reports submitted oncontracts drafted3 quarterly reports on thelevels of complianceTarget met.Target met.Target not met. Anassessment on levels ofcompliance not done.Legal opinions provided12 reports on legal opinionsprovided12 reports on legal opinionsprovided12 reports on legal opinionsprovidedTarget met.Changes to planned targets: There were no changes made by the unit to the planned targets.Programme 1: Administration • <strong>Annual</strong> <strong>Report</strong> <strong>2011</strong>/12 |31
Directorate: Human Resource Management and DevelopmentPurposeThe purpose of the Directorate: Human Resource Management is to render a comprehensive Human Resource supportservice that will enable the Department to contribute to the achievement of corporate objectives by developing a competent,highly motivated staff, and fostering a flexible, responsive working environment that enhances opportunities and maximisesthe potential of every staff member.Strategic ObjectiveThe primary strategic objective of the Directorate: Human Resource Management and Development is to enhance thecapability and capacity of Human Resources.Performance indicators and targetsAn HIV/AIDS MTEF plan was developed and submitted to the Provincial Department of Health together with quarterly reportson progress. The plan details what will be done in order to deliver on the prevention, treatment, care and support in relationto HIV/ AIDS. It also assists the Provincial Department of Health in recommending for conditional grants and in tracking howmuch the programme is contributing to provincial targets.In order to consistently and continuously create a conducive environment for disclosures, the Department commemoratedCandle Light Memorial and Sexually Transmitted Infections (STI) / Condom week by distributing condoms, brochures andfliers on HIV/ AIDS. This is in keeping with the objective of sustaining awareness for behavior change.Four planned training interventions for Peer Educators were delivered as follows:••Stigma Mitigation (18);••Creating a Supportive Workplace (17);••HIV Counseling and Testing in the Workplace (15); and,••HIV and the Law for Supervisors (80).In support of the Provincial Government’s objective of testing people for HIV and Tuberculosis, the Department hosted wellnessclinics coupled with an HIV Counseling and Testing (HCT) campaign. Employees were tested for HIV, hemoglobin, bloodpressure and diabetes. The clinics were hosted in four (4) different clusters for employees to access the different services. Atotal of 202 employees took part in HCT, with 69 testing for HIV/AIDS. The clinics are meant to assist employees to knowhealth and wellness status so as to seek the necessary intervention. These clinics are also meant to assist the Department indetermining where support is required and how such support should be dispensed to employees.A women’s forum was hosted in August <strong>2011</strong> and 290 female employees of the Department attended. The session wasdone to offer female employees an opportunity to exchange their experiences with experts in different fields of holistichealth and wellness. The <strong>Gauteng</strong> Provincial Government appointed Careways as the service provider to render counselingservices to employees and members of their families. The Department conducted marketing initiatives to inform its employeesabout the counseling services. The quarterly psycho-social utilisation reports were received from the service provider. Thereports showed an improvement in the utilisation rate from 1.8% in the first quarter to 4.8% in the last quarter. Some of thepresenting problems also saw a decrease at the end of the financial year.In order to ensure that employees are kept abreast of developments in the HR policy environment, five awareness sessionswere conducted for the year. These centered the following aspects:••Policy and Procedure on Incapacity Leave and Ill Health Retirement (PILIR);••Disciplinary Code and Grievance Procedure;••Promotion of Administrative Justice Act, 2000 (Act No. 3 of 2000)••Promotion of Access to Information Act, 2000 (Act No. 2 of 2000);••Performance Management and Development System (PMDS);••Bursary Induction; and••A total of 177 employees were reached through these sessions.Eleven (11) Labour Forum meetings and three policy task team meetings were held as part of the consultationprocess with organised labour on the development of departmental policies, which resulted in the approval andimplementation of the Job rotation policy.32| <strong>Annual</strong> <strong>Report</strong> <strong>2011</strong>/12 • Department of <strong>Community</strong> <strong>Safety</strong>
Twenty-one (21) cases of misconduct were reported for the year. Seventeen (17) cases were finalised andfour (4) are still pending. The turnaround times for the finalisation of misconduct cases has slightly improvedcompared to the previous financial year. A total of sixteen (16) grievances were lodged for the year. Twelve (12)of these were amicably resolved whilst four (4) are not yet resolved due to postponements.The Department met its regulatory obligations in terms of the prescribed labour relations reports to the PublicService Commission (PSC) and the Department of Public Service and Administration (DPSA). At the end of eachquarter an analysis of the current grievances and misconduct was undertaken. This was done to identify trendsand some of the challenges faced by the organization. Two labour relations training sessions were provided tomembers of the Senior Management Service (SMS) and the Middle Management Service (MMS). In addition,three training sessions were conducted to accommodate Assistant Directors as identified during the sessions formembers of the SMS and MMS.As at the end of March <strong>2012</strong>, the Department had 1038 employees, inclusive of contract workers. Thebreakdown in terms of race and gender is available on the Human Resource Oversight <strong>Report</strong>, which forms anintrinsic part of this report. An Human Resource query line was introduced to deal with all queries and ensurethat the resolution of the queries is monitored. Through this established line, a total of 494 routine HR querieswere received and finalised during the reporting period. The Department made 71 appointments during theyear under review. 42 of these appointments were contract employees whilst 29 were full-time employees. Atotal of 35 terminations were processed. The Employment Equity (EE) <strong>Report</strong> was submitted to the Departmentof Labour and the state of Employment Equity in the Department was reported. The Department embarked ona drive to encourage employees with disability to declare their status, which saw a 31% increase, from 11to 16 employees living with disabilities. The Department made one new appointment of a person living withdisabilities during the reporting period.The focus on skills development targeted implementation of the training interventions identified through theskills audit. In this regard, the Department was able to train 407 (78.2%) employees out of the 520 initiallyplanned or targeted for the training. A total of 112 employees were offered bursaries to further their studiesin fields relevant to the work of the Department. Of these, 71 (63%) were women and 41 (37%) were men.The Department had 24 employees registered on various levels of the Adult Basic Education and Training(ABET) programme. Out of the 24 employees, 1 employee (4%) managed to successfully complete level 4. Theremaining employees are still on various levels.The unit monitored the attendance by learners as well as compliance with the requirements outlined by the<strong>Gauteng</strong> City Region Academy (GCRA).Payments for performance bonuses and pay progression for the 2010/11 financial year were finalised. HumanResource is dealing with the mop up payments and grievances. The quarterly PMDS reports were done tomonitor compliance in so far as the evaluation and assessment of employees. A performance monitoring sessionwas held in order to discuss the performance results of the 2010/11 financial year, identify anomalies andensure that the rewards are within the confines of the relevant prescripts governing the management of personnelperformance in the Public Service.Programme 1: Administration • <strong>Annual</strong> <strong>Report</strong> <strong>2011</strong>/12 |33
Sub-programme: Human resource management and developmentPerformance IndicatorEmployee wellness programmeimplementedBaseline (ActualOutput)Actual performance against targetTarget (<strong>2011</strong>/<strong>2012</strong>) Actual (<strong>2011</strong>/<strong>2012</strong>)2010/111 HIV/AIDS plan approved 1 HIV/AIDS Plan 1 HIV/AIDS Plan Target met.- 4 quarterly HIV/AIDS reports 3 quarterly and 1 cumulativeannual reports weresubmitted to the MultiSectoral AIDS Unit (MSAU)- 1 Employee WellnessProcess (EWP) calendardeveloped4 wellness sessionsconducted1 wellness sessionconducted1 Employee WellnessProcess (EWP) calendardeveloped4 wellness sessionsconductedReason for varianceTarget met.Target met.Target met. The wellnesssession was broken into 4different sessions in order toaccommodate the numbersper geographic area. Itis impossible to host it inone venue for the wholeDepartment.Human Resource policiesreviewed and aligned toregulatory frameworks andimplementedLabour relations supportprovided2 quarterly psycho-socialreports produced4 quarterly psycho-socialreports1 policy awareness session 4 policy awareness sessionsper annum4 quarterly psycho-socialreports produced4 policy awareness sessionsconducted per annum18 labour forum meetings 11 labour forum meetings 11 labour forum meetings3 policy task team meetingsTarget met.Target met.Target met. Policy taskteam meetings are part ofthe consultation processwith organised labour onthe development of labourrelated policies identified inthe labour forum meeting.- 4 labour relations trendanalysis reports- 2 labour relations trainingsessions for SMS and MMS4 labour relations trendanalysis reports5 labour relations trainingsessions conductedTarget met.Target exceeded. Thesessions were targeted atSMS and MMS members butdue to an identified need,sessions were extended toAssistant Directors. The threeextra sessions were done toaccommodate this need.34| <strong>Annual</strong> <strong>Report</strong> <strong>2011</strong>/12 • Department of <strong>Community</strong> <strong>Safety</strong>
Sub-programme: Human resource management and developmentPerformance IndicatorOrganisational cultureimprovedBaseline (ActualOutput)2010/1125% of interventionsimplementedActual performance against targetTarget (<strong>2011</strong>/<strong>2012</strong>) Actual (<strong>2011</strong>/<strong>2012</strong>)4 reports on interventionsimplemented3 reports on interventionsimplementedReason for varianceTarget not met. There weredelays in the appointmentof the service providerthat would assist with anew climate survey. Thisdeliverable was since movedto the next financial year.Target not met for the yearunder review2 monitoring reports onvalues0 Target not met. Themonitoring of theimplementation of theadopted values did not takeplace due to the lack of adefined framework. Theonly work that happened inthis respect relates to thescreening of the values forall employees to internalize.- 4 quarterly HR Administrationreports4 quarterly HR AdministrationreportsTarget met.Human Resource Planimplemented1 Human resource planreviewed1 Human resource planreviewed1 Human resource planreviewedTarget met.Employment Equity(EE) plan reviewed andimplementedMonitored EE planimplementation and alsosubmitted plan to theDepartment of Labour1 EE plan and report toDepartment of Labour1 EE plan and report toDepartment of LabourTarget met.- 2 Employment Equity targetreports4 Employment Equity targetreportsTarget met. The reports weredelivered at the end of eachquarter, hence the targetwas exceeded.- 12 Employment Equitymeetings held8 Employment Equity meetingsheldTarget not met. The EEmeetings were not wellattended during the first twoquarters of the year. Thecommittee since resolved tomitigate this by introducingthe EE Guiding Coalition, whichsought to deal with all therequirements of EE namelyreview of the Policy, finalizationof targets for submission to theDepartment of Labour.Programme 1: Administration • <strong>Annual</strong> <strong>Report</strong> <strong>2011</strong>/12 |35
Sub-programme: Human resource management and developmentPerformance IndicatorWorkplace skills planimplementedBaseline (ActualOutput)Actual performance against targetTarget (<strong>2011</strong>/<strong>2012</strong>) Actual (<strong>2011</strong>/<strong>2012</strong>)2010/11- 1 Workplace skills plan 1 Workplace skills plan Target met.843 training beneficiaries 4 public sector andeducation training reports4 public sector andeducation training reportsReason for varianceTarget met.1 training impactassessment report2 training impactassessment reports1 training impactassessment reportsTarget not met The firstreport focused on theinterventions delivered in linewith the skills audit needs,the performance of learnersduring the course. The lackof a proper assessment toolhas led to the deliverable notbeing met.Learnership and internshipprogramme implemented- 1 learnership/internshipcompliance report1 learnership/internshipcompliance reportTarget met.Bursaries awarded - 1 report on bursariesallocated1 report on bursariesallocatedTarget met.64% bursaries allocated tofemale employees1 report on bursariesallocated to femaleemployees1 report on bursariesallocated to femaleemployeesTarget met.ABET programmesimplementedPerformance managementand development system(PMDS) monitored andimplemented- 1 bursary adjudication 1 bursary adjudication Target met.- 4 quarterly ABET reports 4 quarterly ABET reports Target met.- 4 PMDS reports 4 PMDS reports produced Target met.- 1 PMDS monitoring sessions 1 PMDS monitoring sessionsheldTarget met.Changes made to planned targets: No changes were made to the planned targets.36| <strong>Annual</strong> <strong>Report</strong> <strong>2011</strong>/12 • Department of <strong>Community</strong> <strong>Safety</strong>
Directorate: Compliance and Auxiliary ServicesPurposeThe purpose of the Directorate is to promote compliance and combat fraud and corruption in the public service.Strategic Objectives••Promotion of an ethical environment;••Ensure Compliance with the Road Traffic Act; and••Facility Management Support Services.The impact of our intervention programmes indicates that there is gradual decline in respect of non-complaints. Significantinroads have been made in respect of roadworthy vehicles now being compliant that were previously reported to be noncomplaint.The indication of non-complaint relates more towards the private testing stations. The non-regulation of drivingschools, which are significant role players and contributors towards corruption, also poses a challenge in relation to thecombating of fraud and corruption. The industry comprises of driving schools, runners, agents, and government/municipalofficials.Promotion of Ethical EnvironmentIn terms of the fraud prevention plan, the Department managed to conduct a fraud risk assessment covering all divisions ofthe Department. The Department is awaiting the consolidated report from the GDF for implementation. The National Anti-Corruption Hotline continued to supply the department with reported complaints, ranging from bribery, corruption, misuse ofgovernment vehicles, GPG crimes and reckless and negligent driving. The challenge with the majority of reported cases isthat the complainants remained anonymous and this placed hurtles in terms of investigation process in order to obtain moreinformation. 1 external fraud detection review was conducted at Vereeniging DLTC the results of which indicated that thereis a need to rectify and review the process. 1 business interest review internally was carried at Supply Chain Management.1 security contract was reviewed.Case management systemAccording to the case register new 167 cases were registered from which 60 cases were finalized. We have noted thatthere have 2 walk-in complaints which are currently being investigated. Other source of information on corruption caseswere picked up from the print and electronic media (relating to 3 media articles printed) in respect of the arrest effected forcorruption.Cases currently under investigations are as followsA total of 8 cases have referred for criminal prosecution and 2 cases are currently before court. There are only 2 caseswithdrawn to date and 1 is closed. 13 fraud and anti-corruption awareness campaigns have been conducted within thedepartment. Compliance with the road traffic Act: For the period <strong>2011</strong>/12 of the 25 audit reports 1 positive finding inrelation to VTS and 1 positive finding in relation to the DLTC. Prior to this both stations reflected negatively, meaning inrespect of compliance (they were not complying at first). Three audits relating to G-Fleet were conducted which related tokilometers and fuel discrepancies. A total of 12 DLTC and 13 VTS compliance audits were conducted. 7 site visits and 12meetings were held at various DLTC and VTS including the private VTS.Security and Risk Management24 cases were reported of which 3 (12.5%) were finalized and 1 (4%) closed due to lack of evidence. 3 recommendationswere made for losses totaling R40 390.54 to be recovered from the employees. A suspect was identified and chargedinternally on allegations of fraud relating to the unauthorised use of a 3G card. Investigations in this regard were stillcontinuing at the end of the reporting period. There was 1 security breach at the office of the MEC.Programme 1: Administration • <strong>Annual</strong> <strong>Report</strong> <strong>2011</strong>/12 |37
Sub-programme: Compliance and Auxiliary ServicesPerformance indicator Baseline (ActualOutput)Fraud detection reviews2010/112 reports on fraud detectionreviews producedActual performance against targetTarget (<strong>2011</strong>/<strong>2012</strong>) Actual (<strong>2011</strong>/<strong>2012</strong>)4 quarterly reports on frauddetection reviews4 quarterly reports on frauddetection reviewsReason for varianceTarget met.Fraud, Ethics and MISSAwareness sessions1 Fraud, Ethics and MISSAwareness session4 Fraud, Ethics and MISSAwareness session4 Fraud, Ethics and MISSAwareness sessionsTarget met.Facilitate monthly reports inrespect of fraud preventionimplementation plan12 monthly reports inrespect of fraud preventionimplementation plan12 monthly reports inrespect of fraud preventionimplementation plan12 monthly reports inrespect of fraud preventionimplementation planTarget met.Audit of business interest ofemployees1 Audit of business interest ofemployees1 Audit of business interest ofemployees1 Audit conducted at SupplyChain ManagementTarget met.Monthly reports in respect ofhotline cases investigated12 reports in respect of hotlinecases investigated (reducedhotline cases from 80 to 30)12 reports in respect of hotlinecases investigated12 reports in respect of hotlinecases investigatedTarget met. 167 cases wereregistered from which 60 caseswere finalized.Security threat analysis 1 security threat analysis 1 security threat analysis 6 security threat analyses Target exceeded. There wereseveral break-ins and theftof State resources at theDepartmental headquartersand regional offices, whichnecessitated the carrying outof security threat analyses inexcess of the initial target.Fraud risk assessment and<strong>Annual</strong> PlanMonthly reports in respect ofGPG criminal activitiesMonthly reports onimplementation the Sectoral/Integrity StrategyMonthly reports onimplementation of GPG AnticorruptionframeworkCompliance audits andinspection conducted1 fraud risk assessment and<strong>Annual</strong> PlanApproval of Integrity Strategy1 fraud risk assessment and<strong>Annual</strong> Plan12 reports in respect of GPGcriminal activities- 12 reports on implementationthe Sectoral/Integrity Strategy- 12 reports on implementationof GPG Anti-corruptionframework4 audits on compliance andinspections conducted6 audits on compliance andinspections conducted1 assessment done Target met.12 reports in respect of GPGcriminal activities12 reports on implementationthe Sectoral/Integrity Strategy12 reports on implementationof GPG Anti-corruptionframework22 audits on compliance andinspections conductedTarget met.Target met.Target met.Target exceeded. The target wasexceeded because of allegationsof fraud and corruption fromthe Anti-Corruption Hotline andthe unannounced visits to VTSsand DLTCs by the PortfolioCommittees on <strong>Community</strong><strong>Safety</strong> and Roads and Transport.Changes to planned targets: No targets have been changed in the reporting year.38| <strong>Annual</strong> <strong>Report</strong> <strong>2011</strong>/12 • Department of <strong>Community</strong> <strong>Safety</strong>
Directorate: Information TechnologyPurposeThe purpose of the Directorate: Information Technology is to ensure the delivery of an efficient and effective InformationTechnology (IT) support that will enable the business to achieve its strategic goals.Strategic ObjectivesThe Directorate performs its duties and functions in pursuit of the following strategic objectives:••To develop IT systems, co-ordinate and manage IT projects and databases, and to co-ordinate information managementstrategies;••To implement ICT security, develop policies, procedures and standards and enforce compliance; and,••To develop and maintain information and knowledge management.Performance indicators and targetsDuring the financial year, the gaps identified in the 2010/<strong>2011</strong> ICT strategy as well as in the implementation plan werecorrected and the strategy was approved. This strategy was properly aligned with the departmental objectives and outlinedthe annual performance plan of the unit. The ICT policies and standard operating procedures were developed. The unitalso ensured that awareness of the policies and standard operating procedures was created. There was also continuousmonitoring to ensure compliance with the policies and procedures. Engagement with the users helped the unit to understandtheir needs and enabled the unit to structure the policies and operating procedures in line with the business unit’s requirements.The non achievement of the targets in relation to the e-Governance Strategy and Open Source Strategy (OSS) strategy wasdepended on implementation in GPG which was a benchmarking base for the development. GDF developed an Opensource task team to guide the Department on open source. Information and knowledge management depended on thecompletion of the national knowledge management framework at the DPSA which was finalized and commenced in theEastern Cape thus the department delayed as awaiting GPG commencement.Implementation of best practices and governance continued throughout the reporting period with reviewing and monitoringof service level agreements done timeously. This strengthened the relationship between the service providers and the unit. Italso ensured that services were rendered as per the service level agreements and further that payments to service providerswere timeously effected. The identification of possible risks was done and mitigation plans were implemented. The unitensured that monthly progress reports in this regard were submitted.Programme 1: Administration • <strong>Annual</strong> <strong>Report</strong> <strong>2011</strong>/12 |39
Sub-programme: Information TechnologyPerformance IndicatorBaseline (ActualOutput)2010/11Actual performance against targetTarget (<strong>2011</strong>/<strong>2012</strong>) Actual (<strong>2011</strong>/<strong>2012</strong>)ICT strategies reviewed 1 ICT strategies reviewed 1 ICT strategies reviewed 1 ICT strategies reviewed Target met.Reason for varianceE-governance strategydeveloped- 1 E-governance strategydeveloped0 Target not met. The departmentto benchmark on the GPG widee-governance strategy adopted,The strategy was delayed dueto implementation of the newICT structure which requiredtraining of resources.OSS strategy developed - 1 OSS strategy developed 0 Target not met. The targetwas dependant on the GDFrolling out the provincial OSSStrategy. GDF has implementeda task team to deal with theOSS strategy which will helpdepartments in deploying thestrategy.ICT policies implementationmonitored12 monthly reports on ICTpolicies implementationmonitored12 monthly reports on ICTpolicies implementationmonitored12 monthly reports on ICTpolicies implementationmonitoredTarget met.ICT Standard Operating 1 ICT SOPs reviewed 1 ICT SOPs reviewed 1 ICT SOPs reviewed Target met.Procedure (SOP) reviewedReview SLA 1 report on reviewed SLA 1 report on reviewed SLA 1 report on reviewed SLA Target met.Monitor Service Level 12 reports on SLA monitored 12 reports on SLA monitored 12 reports on SLA monitored Target met.AgreementsIdentified risks mitigated 12 reports on risks mitigated 12 reports on risks mitigated 12 reports on risks mitigated Target met.Information and KnowledgeManagement (IKM) Strategydeveloped- 1 Information andKnowledge ManagementStrategy developed0 Target met. The DPSA KIMFramework was finalized,which is the guideline for thedepartments. Presentationscommence in the Eastern Capeand still to be done in the<strong>Gauteng</strong> Province, thus thedepartment is dependent onGPG commencement.Changes to planned targets: No targets have been changed in the year under review.40| <strong>Annual</strong> <strong>Report</strong> <strong>2011</strong>/12 • Department of <strong>Community</strong> <strong>Safety</strong>
Directorate: Facilities ManagementPurposeThe purpose of the Directorate: Facilities Management within the Chief Directorate: Corporate Services is to provide theDepartment with facility management support services.Strategic ObjectiveThe Directorate performs its duties and functions in pursuit of the following strategic objective:••To provide the Department with facility management support services.Facility management supportDuring the reporting period, the Department, working together with the <strong>Gauteng</strong> Department of Infrastructure Development(DID), was able to deliver on its responsibilities around the maintenance of the building housing the Department headquartersin Johannesburg. The biggest challenge with the building is the fact that several (75%) of the elevators in the building arenot functioning. This poses a Health and Occupational <strong>Safety</strong> (HOS) hazard. There were also some break-ins into theDepartment’s offices and the relevant security agencies were called upon to conduct the necessary investigations as wellas the investigations and security threat analyses. Internal meetings on HOS related activities were held on a monthly basiswith a view to improving the working environment to make it conducive to optimal performance. An updated file plan issuccessfully being implemented and all losses are properly recorded in the record management system of the Department.Sub-programme: Facility management supportPerformance Indicator Baseline (Actual Output)Monthly reports on theattendance of facilitiesmaintenance activities2010/11100% of requests attended to(maintenance of immovableassets coordinated)Actual performance against targetTarget (<strong>2011</strong>/<strong>2012</strong>) Actual (<strong>2011</strong>/<strong>2012</strong>) Reason for variance12 reports on the attendance offacilities maintenance activitiesproduced12 reports on the attendance offacilities maintenance activitiesproducedTarget met.Quarterly reports in respect ofHOS activitiesCompliance with health andsafety legislation facilitated4 quarterly reports in respect ofHOS activities4 reports in respect of HOSactivities submittedTarget met.Quarterly reports onimplementation of theDepartmental RecordsManagement systemDepartmental RecordsManagement systemmaintained4 quarterly reports onimplementation of theDepartmental RecordsManagement system4 reports on implementationof the Departmental RecordsManagement systemsubmittedTarget met.Monthly reports on lossmanagementLoss management handled12 monthly reports on lossmanagement12 reports on lossmanagement submittedTarget met.Changes to planned targets: No targets have been changed in the reporting year.Programme 1: Administration • <strong>Annual</strong> <strong>Report</strong> <strong>2011</strong>/12 |41
02Programme 2:Civilian Oversight“Reduction in Trio crimes.”42 | <strong>Annual</strong> <strong>Report</strong> <strong>2011</strong>/12 • Department of <strong>Community</strong> <strong>Safety</strong>
Programme 2: Civilian OversightThe purpose of the programme is to facilitate the delivery of improved police services through monitoring andevaluating the functioning of the province’s Law Enforcement Agencies (LEAs) and promoting good relationsbetween the police and the communities. The programme consists of two sub-programmes, namely, Monitoringand Evaluation and Policy and Research. This programme takes responsibility for the performance of the policeoversight functions outlined in section 206 (3) of the Constitution of the Republic of South Africa, 1996. It is thisprogramme that essentially performs the functions of a Provincial Secretariat for <strong>Safety</strong> and Security as providedfor in sections 2 and 3 of the SAPS Act, 1995 (Act No. 68 of 1995). As in the first two programmes, the newpriorities adopted by the Executive Council have compelled the Department to revisit its strategic objectives inthe <strong>Annual</strong> Performance Plan <strong>2011</strong>-<strong>2012</strong>.Of particular significance in this regard is the priorities that focus on the ‘reduction of serious and violent crimes’,‘crime perception management’, ‘effectiveness and integration of the criminal justice system’ as well as the‘prevention and combating of corruption against the LEAs’.Sub-programme 2.1: Monitoring and EvaluationPurposeThe purpose of the Directorate: Monitoring and Evaluation is to facilitate the delivery of improved police servicesthrough monitoring and evaluating the functioning of the provinces Law Enforcement Agencies (LEAs).Strategic ObjectivesThe Directorate’s strategic objectives are:••Monitoring and evaluating the performance of the SAPS towards priority crime reduction;••Overseeing the effectiveness and efficiency of service delivery by the SAPS at station level;••Assessing the effectiveness of visible policing programmes and promoting policing coordination in the province;••Monitoring police conduct;••Promoting the effectiveness and integration of the CJS in the province and promoting police transformation; and,••Accountability and transparency.Performance indicators and targetsDuring the reporting period, the Directorate had planned to visit 32 police stations that were identified, in conjunction withthe leadership of the SAPS, as poor performing. A total of 38 police stations were visited, thus exceeding the plannedannual target by 6 police stations (15.8%). These were Orange Farms, Bedfordview, Brooklyn, Devon, Dube, Dawn Park,Loate, Crystal Park, Pretoria North, Lyttelton, Rosebank, Pretoria West, Edenvale, Garsfontein, Olifantsfontein, Sinoville,Silverton, Boschkop, Dunnottar, Tembisa, Cullinan, Eden Park, Norkem Park, Duduza, Temba, Hillbrow, Loate, Diepkloof, DeDeur, Sebenza, Wierdebrug, Ekangala, PTA Central, Meyerton, Katlehong, Welbekend, Honeydew and JHB Central. Thetarget was exceeded as a result of visits to several police stations in the province by the Parliamentary Portfolio Committeeon Police (PPCP). The Directorate had to make follow-up visits to the stations visited by the PPCP, which then affected theinitial target. The 32 police stations were identified at the commencement of the financial year through a system called thePerformance Chart, which is used by the police service for the measurement of police performance. The system focuses onpolice performance in a variety of areas such as crime and the performance of the community service centres at each of the137 police stations across the province.PThis work entails monitoring the effectiveness of the Co-Created Policing Strategy. The findings of the station visits werediscussed with the station management and deadlines set for action plans. The Directorate monitored the implementationof the Detectives 10 point plan in the province, which is designed to improve the performance of the detectives, primarilyagainst the identified priority crimes. To this end, 690 case dockets closed as undetected and withdrawn were analysed. Itwas found that dogged detective work is not common practice. Once the station visits and docket analysis is completed thefindings are discussed with the station commanders and senior management who have been receptive. Action plans andtime frames for improvement are drawn up and the process is monitored monthly.In an attempt to monitor cooperation and collaboration within the CJS, the unit monitored Case Flow management meetingsbetween the SAPS and National Prosecuting Authority (NPA) and reports in this regard were produced. The effectiveness ofvisible policing programmes executed by the SAPS in the province was also analysed.Programme 2: Civilian Oversight • <strong>Annual</strong> <strong>Report</strong> <strong>2011</strong>/12 |43
<strong>Report</strong>s with findings were produced and disseminated to station management. A preliminary assessment of the ResourceAllocation Guide (RAG) was undertaken. The Directorate received and investigated a total of 390 complaints againstthe Law Enforcement Agencies in the province. As at the end of March <strong>2012</strong>, all 390 (100%) of these complaints werefinalised.Sub-programme: Monitoring and EvaluationPerformance indicatorCoordination of policingactivities by the provincialcommand centre in relationto priority crimes monitoredand evaluatedBaseline (Actual Output)2010/11- 4 quarterly and 1 annualreportsActual performance against targetTarget (<strong>2011</strong>/<strong>2012</strong>) Actual (<strong>2011</strong>/<strong>2012</strong>)Reason for variance0 Target not met. Theinformation was requestedfrom SAPS Provincial. Thismatter will be discussed atthe Round Table with SAPSProvince.Performance of clusters inrelation to priority crimesmonitored and evaluated- 4 quarterly and 1 annualreports4 submissions on identifiedpoor performing clustersTarget met. There was achange in the approach. Theinformation was incorporatedinto the Quarterly CrimeOverview reports producedby the Directorate: Policy andResearch.Quality of criminalinvestigations relating toidentified priority crimesassessed (added target)- 4 quarterly and 1 annualreports relating to identifiedpriority crimes assessed3 reports produced relatingto identified priority crimesassessedTarget was not met.Preparatory work undertakenin quarter one of thereporting period and theDepartment had to negotiatewith SAPS to approve thedocket audit process.Effectiveness and efficiency ofservice delivery by the SAPSat station level monitored- 4 quarterly and 1 annualreports on station visits thatwere conducted4 quarterly reports and 1annual report on station visitsthat were conductedTarget met.Allocation, distribution andutilisation of human andmaterial resources at stationlevel monitored- 4 quarterly and 1 annualreports produced on theallocation, distribution andutilisation of human andmaterial resources at stationlevel monitored1 quarterly report producedon the allocation, distributionand utilisation of human andmaterial resources at stationlevel monitoredTarget not met. The reportserved as a foundation asit raised several issues thatrequired clarity from the SAPSleadership. The matter will bediscussed at the Round Tablewith SAPS Province.Effectiveness of visiblepolicing programmes by theSAPS assessed- 4 quarterly and 1 annualreports produced on theassessment of visible policingprogrammes at cluster level4 quarterly reports producedon the assessment of visiblepolicing programmes atcluster levelTarget met.44 | <strong>Annual</strong> <strong>Report</strong> <strong>2011</strong>/12 • Department of <strong>Community</strong> <strong>Safety</strong>
Sub-programme: Monitoring and EvaluationPerformance indicatorCompliance with Regulationsfor Municipal Police Services,1999 and adherence tonational policing standardsby the three Metro PoliceDepartment (MPDs)monitoredBaseline (Actual Output)2010/11- 4 quarterly and 1 annualreportsActual performance against targetTarget (<strong>2011</strong>/<strong>2012</strong>) Actual (<strong>2011</strong>/<strong>2012</strong>)Reason for variance0 Target not met. Agreement at<strong>Gauteng</strong> Intergovernmental<strong>Safety</strong> CoordinatingCommittee that this wouldtake place in accordancewith Municipal financialyear to ensure synergybetween Province and Localgovernment.Establishment and functioningof policing coordinatingstructures at provincial andlocal levels for inter-agencycollaboration monitored- 4 quarterly and 1 annualreports produced on thefunctioning of the ProvincialCrime Combating Forum(PCCF)2 quarterly reports producedon the functioning of thePCCFTarget not met. The PCCFmeetings were discontinuedby SAPS in the last twoquarters of the financial year.Public complaints allegingpolice inefficiency or improperpolice conduct investigated460 Public complaintsalleging police inefficiencyor improper police conductinvestigated4 quarterly and 1 annualreports produced on publiccomplaints alleging policeinefficiency or improper policeconduct investigated4 quarterly and 1 annualreports produced on publiccomplaints alleging policeinefficiency or improper policeconduct investigatedTarget met.Collaboration between theSAPS and the NationalProsecuting Authority onpriority crimes monitored- 4 quarterly and 1 annualreports produced oncollaboration between theSAPS and the NationalProsecuting Authority onpriority crimes monitored4 quarterly and 1 annualreports produced oncollaboration between theSAPS and the NationalProsecuting Authority onpriority crimes monitoredTarget met.Functioning of local CJSCoordinating Forums inthe 22 policing clustersmonitored1 quarterly report producedon functioning of localCJS Coordinating Forumsin the 22 policing clustersmonitored4 quarterly and 1 annualreports produced onfunctioning of local CJSCoordinating Forums inthe 22 policing clustersmonitored4 quarterly and 1 annualreports produced onfunctioning of local CJSCoordinating Forums inthe 22 policing clustersmonitoredTarget met.PImplementation of resolutionsadopted at the quarterlyreview sessions with LEAsmonitored- 4 quarterly and 1 annualreports produced on theimplementation of resolutionsadopted at the quarterlyreview sessions with LEAsmonitored2 (1 preparatory session and1 quarterly review sessionheld)Target not met. The reviewsessions could not take placeas the Department preparedfor the roundtable discussionwith SAPS. In addition, itwas agreed at the <strong>Gauteng</strong>Intergovernmental <strong>Safety</strong>Coordinating Committee(GISCC) meeting thatthis would take place inaccordance with Municipalfinancial year to ensuresynergy between Provinceand Local government.Changes to planed targets: Changes were made on planned targets relating to the assessment of the qualityof investigations relating to identified priority crimes (docket analysis).Programme 2: Civilian Oversight • <strong>Annual</strong> <strong>Report</strong> <strong>2011</strong>/12 |45
Sub-programme 2.2: Policy and ResearchPurposeThe purpose of the Directorate: Policy and Research is to undertake research on safety and security matters with the intentionof improving policing and making informed strategic decisions.Strategic ObjectiveTo provide quality research and information on safety and security matters.Performance indicators and targetsIn the year under review, the Directorate: Policy and Research ensured that research was undertaken on the status of policingin the province. A brand awareness study was executed to determine awareness about the work of the department bothinternally and externally. In addition, the unit produced a progress report on the implementation of the <strong>Gauteng</strong> <strong>Safety</strong>Strategy 2006-2014, developed quarterly crime analysis reports for submission to the Executive Council, held the <strong>Gauteng</strong>Information on Police Performance System (GIPPS) sessions with the following stations: Brixton, Cleveland, Jeppe, Loate,Vereeniging, Westonaria, Temba, Rietgat, Loate, Hammanskraal and Dube and carried out pre and post assessments ofthe Know-Your-Neighbourhood campaign executed in <strong>Gauteng</strong>. In addition, the Directorate provided a knowledge basethrough the resource centre which purchases reading material for subject specialists and provides access to informationdatabases. Furthermore, the Directorate held awareness sessions on the collection in the resource centre to encourage usagethereof.Sub-programme: Policy and ResearchPerformance Indicator Baseline (Actual Output)<strong>Annual</strong> updates of policingneeds and prioritiescoordinated2010/11Framework for determiningneeds and priorities wasdeveloped and adoptedActual performance against targetTarget (<strong>2011</strong>/<strong>2012</strong>) Actual (<strong>2011</strong>/<strong>2012</strong>)Review and update of theframe work for policing needsand prioritiesPresentations were madein all the district andMetropolitan municipalitiesexcept for City ofJohannesburgReason for varianceTarget not met. The relevantpeople were not availablefor the meeting despitenumerous requests.Implementation of ruralsafety plans evaluatedDevelop a framework for therural safety plansReview and update theframework for the ruralsafety plansTerms of Reference weredevelopedTarget not met. The task wasoutsourced in the last quarterof the financial year.Number of research reportsproduced7 research reports produced 7 research reports produced 3 research reports produced Target not met. There weredelays in sourcing andappointing service providersand obtaining information.46 | <strong>Annual</strong> <strong>Report</strong> <strong>2011</strong>/12 • Department of <strong>Community</strong> <strong>Safety</strong>
PSub-programme: Policy and ResearchPerformance Indicator Baseline (Actual Output)Provide an information basethrough the resource centre2010/11143 information requestsattended toActual performance against targetTarget (<strong>2011</strong>/<strong>2012</strong>) Actual (<strong>2011</strong>/<strong>2012</strong>)150 information requestsattended to283 information requestsattended toReason for varianceTarget exceeded. There weremore materials purchasedand there were also morepeople studying in thedepartment which led to anincreased demand.7 awareness projectsundertaken6 awareness projectsundertaken6 awareness projectsin Temba, Mabopane,Donkerhoek, Vereeniging,Head Office andKoedoespoortTarget met.Number of crime overviewreports produced4 crime overview reportsproduced4 crime overview reportsproduced3 overview reports produced Target not met. There weredelays from SAPS butinformation subsequentlyreceived from SAPS covers theperiod under review.Compile 8 GIPPS reports 2 GIPPS reports produced There were delays from SAPSbut information subsequentlyreceived from SAPS covers theperiod under review.Changes to planned targets: No changes were made to planned targetsProgramme 2: Civilian Oversight • <strong>Annual</strong> <strong>Report</strong> <strong>2011</strong>/12 |47
Programme 3: Crime Prevention and<strong>Community</strong> Police Relations03“Reduction in crimes against women and children.“48 | <strong>Annual</strong> <strong>Report</strong> <strong>2011</strong>/12 • Department of <strong>Community</strong> <strong>Safety</strong>
Programme 3: Crime Prevention and <strong>Community</strong> Police RelationsThe aim of this programme is to promote safety in the province through the provision of education and awareness programmeson crime prevention. The programme also coordinates social crime prevention initiatives in the province, with programmes toprevent violence against women and children and to enhance victim empowerment.The Department has effected a few minor changes to the <strong>Annual</strong> Performance Plan <strong>2011</strong>-<strong>2012</strong> in relation to this programme.These changes were necessitated by the new priorities identified by the Executive Council in February 2010, which weresubsequently translated into the Provincial Government’s Programme of Action. The priority relating to the ‘reduction in crimesagainst women and children’, in particular, has meant that the programme needed to have a dedicated focus on sexualassault as it related to women and children. There are no changes to the budget structure of the programme.Sub-programme: Promotion of <strong>Safety</strong>PurposeThe primary purpose of the sub-programme is to promote safety in the province through the provision of education andawareness programmes on crime prevention. The programme also coordinates the implementation of the social crimeprevention strategy in the province, with programmes to prevent violence against women and children, youth safety, schooland child safety.Strategic ObjectivesThe following are the strategic objectives relating to the sub-programme:••To establish and support youth desks;••To develop and implement the alcohol and drug abuse prevention programme;••To contribute towards the prevention of violence against women and children;••To promote school safety; and,••To mainstream and coordinate social crime prevention in government.Performance indicators and targetsThe establishment of Youth desksThe highlight of the reporting period related to the resuscitation of youth desks that were inactive for more than two yearsin areas such as Pretoria-Central, Ga-Rankuwa, Wedela, Hekpoort, and Heidelberg. Further, the Departmental interventionand the cooperation obtained from the youth desks raised a new awareness regarding youth work and participation. TheImbizo held in Germiston during the reporting period also highlighted the need to escalate youth work in the fight against crimein all policing clusters of the province. Young people led the Imbizo by making presentations and participating in commissionswith a view to developing programmes that would deal with youth challenges. The topics discussed ranged from youngwomen leaders; substance abuse; youth in conflict with the law; and, youth participation at local level. The Departmentwas also able to get 20 members of the Cluster Youth Crime Prevention Executive Committees to a provincial adoptivemeeting, the purpose of which was to plan towards a provincial elective conference, which will take place during the firstquarter of the <strong>2012</strong>/2013 financial year. The Hammanskraal youth intervention programme was a resounding success.This programme got young people from the Temba cluster involvement and it was followed by a march by the Local DrugAction committee from Tshwane.1. Alcohol and drug abuse prevention programmeCorrectional service toursThe tours consist of learners from identified schools within the province embarking on a journey of prison life through aninteraction with inmates who share their real life testimonies. These are male and female offenders currently serving sentencesmainly through drug addiction and drug trafficking. They share their own stories, displaying how small habits graduate toaddiction. Their sentences range from 10 years to life imprisonment. A total of 416 visits to Correctional Centers, whichinvolved over 18000 learners and youth desk members, were carried out during the reporting period. These tours wereheld in the following Correctional Centres:••Johannesburg Correctional Centre (Meredale);••Leeuwkop Correctional Centre (Sunninghill);••Pretoria Correctional Centre (Tshwane);Programme 3: Crime Prevention and <strong>Community</strong> Police Relations • <strong>Annual</strong> <strong>Report</strong> <strong>2011</strong>/12 |49
••Krugersdorp Correctional Centre (Krugersdorp); and,••Boksburg Correctional Centre (Boksburg).Substance abuse awareness campaigns and talks were conducted in identified communities and schools to create awarenessof the dangers associated with alcohol and substance abuse, especially among young people. The campaigns were held inJeppe, Sebokeng, Eeesterust, Atteridgeville, Mabopane, Hammanskraal, Hillbrow, Sophiatown, Brakpan, Devon, Springs,Kwa-Thema, Etwatwa, Roodepoort, Temba, Meyerton, Kliptown, Yeoville, Hillbrow, JHB-Central, Sebokeng, Brooklyn,Muldersdrift, Soshanguve, Booysens, Krugersdorp, Randburg, Brixton, Dube, Protea, Duduza, Diepkloof, Carletonville,Vanderbijlpark, Heidelberg, Randburg, Tsakane, Eldorado Park, Meyerton, Kliptown, Temba and Meyerton.2. Prevention of Violence against Women and Children (VAWAC)Crime and violence perpetrated against women and children still remains a major challenge for the province. The violenceand abuse inflicted on women and children imposes a range of costs. For the individual victim, these may include injuries,disability and even death, along with a diminished sense of well-being and the ability to fully participate in and enjoy life.Those who perpetrate such violence also pay a price, often in the form of failed relationships, poor family connections andconflict with the law. Families and communities also suffer consequences, sometimes being caught in the cross-fire of suchviolence, as well as needing to provide care and support to those who are victims of gender-based violence and childabuse or neglect.These costs have not gone unnoticed by government and other partners and there have been continuous attempts to addresssexual violence, child abuse and domestic violence through a range of laws and policies. The Prevention of Violence againstWomen and Children programme developed by the Department seeks to add another dimension to these interventions byfocusing on the prevention of such violence. During the reporting period, the Department finalised the provincial VAWACstrategy review process. An implementation plan was also developed. In addition, the Department succeeded in establishingthe Provincial Gender Based Violence Prevention Forum (GBVPF). The forum includes stakeholders from Government, civilsociety formations and other activists who take collective responsibility for the development and implementation of VAWACprevention programmes. What follows hereunder are the VAWAC prevention initiatives that were carried out during thereporting period.Men as <strong>Safety</strong> Promoters (MASP)The aim of the project is to train and support the establishment of community networks of mainly men who volunteer topromote women and child safety issues through community engagements. These networks are attached to local SAPSstations. During the year under review, 61 MASP groups were established bringing to 104 the total number of MASP groupsestablished to date.The MASP groups referred to above were established in Diepsloot, Johannesburg-Central, Sophiatown, Brixton, Mondeor,Fairlands, Primrose, Alberton, Benoni, Brackendowns, Actonville, Crystal Park, Daveyton, Putfontein, Sophiatown, Langlaagte,Booysens, Kempton Park, Norkem Park, Edenvale, Sebenza, Loate, Dube, Mabopane, Zonkezizwe, Katlehong, Tembisa,Olifantsfontein, Ivory Park, Nelmapheus, Springs, Devon, Dunnotor, Duduza, Nigel, Kwa-Thema, Ratanda, Vereeniging,De Deur, Roodepoort, Tshepisong, Plot 8, Mathole, Bedfordview, Sandringham, Heidelberg, Kliprivier, Sharpeville, Evaton,Sandton, Randburg, Germiston, Elsburg, Bramley, Alexandra, Yeoville, Ennerdale, Jeppe, Brakpan, Tsakane, Meyerton,Carletonville, Fochville, Wedela.In addition, a total of 1800 MASP volunteers were trained.Women <strong>Safety</strong> Workshops29 women safety workshops were conducted to empower women on issues of abuse and the range of legislation andservices rendered by both government and civil society organisations. Workshops were held in Kliptown, EldoradoPark, Lenasia South, Tsakane, Honeydew, Magaliesburg, Tshepisong, Vanderbijlpark, Vosloorus, Meyerton, Katlehong,Zonkizizwe, Diepkloof, Daveyton, Rabie Ridge, Lenasia, Laudium, Protea Glen, Tembisa, Ennerdale and Yeoville.<strong>Safety</strong> workshops targeting the Elderly and People with DisabilitiesWorkshops on the prevention of violence and abuse of the elderly and people with disabilities were conducted to createawareness on their rights. In other areas, stakeholders impersonated different forms of disability to make communities awareof challenges faced by these vulnerable groups and also voicing out the frustrations and crimes affecting them in their dailylives. A total of 24 workshops were conducted in Brynston, Randburg, Diepkloof, Tshepisong, Meyerton, Daveyton, Soweto,Rabie Ridge, Eldorado Park, Midrand, Swanieville, Orange Farms, Orlando, Rockville, Moroka, Bophelong, Evaton,Devon, Lenasia South, JHB-Central, Vosloorus and Vanderbijlpark .50 | <strong>Annual</strong> <strong>Report</strong> <strong>2011</strong>/12 • Department of <strong>Community</strong> <strong>Safety</strong>
Furthermore, a disability awareness workshop was conducted with the Dialogue in the Dark for visually impaired people.Some 200 people attended the workshop, which addressed the challenges encountered by people living with visualimpairment and their specific needs. The challenges raised and recommendations made have been translated into an actionplan.Child <strong>Safety</strong> PromotionThe Department, working in partnership with the SAPS, conducted a child safety awareness workshop during the reportingperiod.The purpose of the workshop was to raise awareness on child safety issues, assisting caregivers, educators and parents toidentify and report issues of child abuse.A total of 33 child safety promotion workshops were conducted in Silverton, Sebokeng, Soshanguve, Moroka, Tshepisong(Roodepoort), Olifantsfontein, Pretoria West, Diepsloot, Atteridgeville, Dube, Cullinan, Daveyton, Eersterust, Duduza,Tsakane, Bophelong, Protea Glen, Jeppe, Orange Farms, Boipatong, Rabie Ridge, Hillbrow, Ekangala, Kwa-Thema,Erasmia, Etwatwa, Hammanskraal, Roodepoort, Tsakane, Westbury and Florida.The Department further conducted 315 child safety awareness DVD screenings and child safety talks in crèches and schoolswithin the province. The objective was, in the main, to raise awareness and educate kids on child safety issues and thereporting mechanisms available to them. In addition, the Department held several activities during the reporting periodaimed at the commemoration of the16 days of Activism Campaign, Women’s month as well as the Child Protection Week.3. Promotion of school safetyDuring the year under review, the Department implemented the repackaged school safety programme to comprehensivelyaddress current school safety challenges in the province. The repackaged model is intended, among others, to –••Provide an integrated framework and approach to all aspects of school safety and security issues;••Clearly identify the roles and coordination mechanisms of the different role-players from the Department, the Departmentof Education, the Department of Health and Social Development, SAPS, Non-Governmental Organisations and theprivate sector ; and,••Set up a structure to implement and monitor the school safety programme.The following additional achievements were recorded during the reporting period:Capacity building of schools (establishment of school safety teamsSchool safety training workshops were conducted as part of the departmental school safety programme. The aim of thetraining was to assist schools to identify, respond to safety threats and report incidents of violence, which might occur atschool. The focus of the training was mainly on assisting schools with the development of safety plans and the establishmentof safety teams, which consist of relevant stakeholders meant to offer support to the school management team. A total of255 schools were trained and safety plans developed. 281 school safety teams were established and a total of 489 schoolsafety plans were monitored during the reporting period.The following school safety interventions were made during the reporting period:••426 random school searches were conducted in all identified problematic school within the province. (This wasdone to proactively mitigate violent behaviour that might erupt as a result of learners bringing alcohol and drugs anddangerous weapons to schools); and,••28 school safety desks were established.The school safety desks were established in schools and learners recruited and trained as school safety ambassadors tocoordinate school safety projects addressing safety challenges within the schooling environment. These desks further createa platform where learners can report violent incidents and challenges relating to problems such as bullying, gangsterism,alcohol and substance abuse, sexual assault and harassment.Programme 3: Crime Prevention and <strong>Community</strong> Police Relations • <strong>Annual</strong> <strong>Report</strong> <strong>2011</strong>/12 |51
Sub-programme: Promotion of <strong>Safety</strong>Performance indicatorBaseline (Actual Output)Actual Performance against targetTarget (<strong>2011</strong>/<strong>2012</strong>) Actual (<strong>2011</strong>/<strong>2012</strong>)Reason for variance2010/11Number of functional youthcrime prevention desks as perminimum norms and standardsin all police stations135 functional youth Deskstructures135 Functional Youth CrimePrevention Desks as perminimum norms and standardsin all police stations135 youth desks functionalas per minimum norms andstandards in all police stationsTarget met.Number of functional clusteryouth desk leadership andProvincial leadership structures6 regional and 1 provincial youthdesk structure established22 Functional Cluster youthdesk leadership structures andProvincial Leadership structure22 Cluster youth desk leadershipstructures and 1 InterimProvincial leadership structureestablished and functionalTarget met. First phase ofProvincial Executive committeewhich consists of Cluster YouthDesk Chairpersons has beencompleted. Second phase toelect the Top 5 leadershiphas not been finalized sincefurther consultations withSAPS, Provincial CPF Board,municipalities and other youthformations was required.The provincial leadership willformally be unveiled in June<strong>2012</strong> as part of youth monthcommemoration.Number of signed Memorandumof Understanding (MOU) withSAPS- Signed MOU with SAPS 1 MOU signed with SAPS Target met.Number of cluster youth DeskProgramme of Action (POA)supported and monitored6 Regional and Provincial POAimplemented22 cluster youth desk POA’ssupported and monitored22 cluster POA’s covering 135police stations were supported.Target met.<strong>Annual</strong> and Quarterly partnershipmeetings with Youth desks andCPF’sNo baseline<strong>Annual</strong> and Quarterly partnershipmeetings with Youth desks andCPF’s2 provincial meetings held inJuly and March with SAPS (allstations), Provincial SAPS,CPF and Youth Desks. 30partnership meetings were heldwith SAPS and CPF’s both atCluster and station levelTarget exceeded. Thesemeetings were held to jointlycoordinate and strengthenyouth crime prevention desksprogrammes in all policestations.Number of youth desk volunteerstrained450 volunteers trained 550 youth desk volunteerstrained853 youth desk volunteerstrainedTarget exceeded. More trainingopportunities were offeredto the youth desk membersthrough partnerships with variousstakeholders such as City of JHB,Hollard and the South AfricanAssociation of Youth Clubs.52 | <strong>Annual</strong> <strong>Report</strong> <strong>2011</strong>/12 • Department of <strong>Community</strong> <strong>Safety</strong>
Sub-programme: Promotion of <strong>Safety</strong>Performance indicatorNumber of youth in conflict withthe law profiles analyzedBaseline (Actual Output)2010/11Youth in conflict with the lawprofiles analyzed in 1 clusterActual Performance against targetTarget (<strong>2011</strong>/<strong>2012</strong>) Actual (<strong>2011</strong>/<strong>2012</strong>)Youth in conflict with the lawprofiles in 4 clusters analyzedYouth in conflict with the lawprofiles analyzed in 4 clustersanalysed in Temba,Ga- Rankuwa,Benoni (Boksburg) andKrugersdorp clustersReason for varianceTarget met. 22 profiles ofyouth in conflict with the lawwere analyzed in Temba andGa- Rankuwa Clusters. Theprofiles received from Bosasaand Boksburg Juvenile centreshad youth offenders from allover <strong>Gauteng</strong>; however focuswas on young offenders comingfrom Temba, Hammanskraal andTembisa. The areas were chosendue to high rate of alcoholand substance abuse by youngpeople within the areas.Number of youth focusinterventions programsdeveloped and implemented- Youth focus interventionsprograms developed andimplemented in 4 clustersYouth focus interventionsprograms developed andimplemented in 4 clustersTarget met. 84 young peoplewere taken for rehabilitation and16 successfully completed the 8week program. The program alsoincluded awareness workshopsand road shows as well as Lawenforcement to deal with thescourge of substance abusewithin the area.Number of leadership andmentorship programs for youth- 1 youth leadership andmentorship programsimplemented1 youth leadership andmentorship programsimplementedTarget met. Program coordinatedin Temba and involved the16 young people who havesuccessfully completed substanceabuse the rehabilitationprogram. Individual developmentplans were designed for eachindividual and workshops onskills development and economicempowerment were conducted.Furthermore 2 of the 6 youngpeople were offered bursaries tofurther their studies.Programme 3: Crime Prevention and <strong>Community</strong> Police Relations • <strong>Annual</strong> <strong>Report</strong> <strong>2011</strong>/12 |53
Sub-programme: Promotion of <strong>Safety</strong>Performance indicatorBaseline (Actual Output)Actual Performance against targetReason for variance2010/11Target (<strong>2011</strong>/<strong>2012</strong>) Actual (<strong>2011</strong>/<strong>2012</strong>)Consolidated DepartmentalVAWAC planApproved Provincial Joint Plan1 Consolidated DepartmentalVAWAC planDeveloped and implemented thedepartmental Violence againstWomen and Children prevention(VAWAC) plan. Coordinated theprovincial VAWAC program (365days program of action and the16 days of activism campaign.Finalized the VAWAC strategyreview and the implementationplan, established and Launchedthe Provincial Gender basedviolence Prevention Forum,Coordinated Child protectionweekTarget met. The gender basedviolence prevention Forumwas established and launchedin August <strong>2011</strong> to mobilizestakeholders from government,civil society and GBV preventionactivists to join forces in effortsgeared towards preventinggender based violence.Quarterly departmental VAWACreport submittedQuarterly departmental VAWACreports submittedQuarterly departmental VAWACreports submittedQuarterly reports submittedTarget met. <strong>Report</strong>s submittedto the Office of the Premieras (Intergovernmental GenderForum).Number of child safetypromotion workshops20 child safety promotionworkshops30 child safety promotionworkshops33 child safety promotionworkshops conductedTarget exceeded. Moreworkshops conducted as perthe need.Number of Men As <strong>Safety</strong>Promoters (MASP) groupsestablishedNumber of MASP volunteerstrained15 MASP groups established 50 MASP groups established 61 MASP groups established Target exceeded due tointerest from communities andstakeholders to have MASPgroups established.525 MASP volunteers trained 1750 MASP volunteers trained 1800 MASP volunteers trained Target exceeded. In some areasmore men got interested injoining the MASP groups andwere included in the trainings.Number of MASP programmessupported20 MASP programmes supported 40 MASP programmes supported 46 MASP programmessupportedTarget exceeded. This was dueto the large number of MASPgroups established.Number of women safetyWorkshops conducted12 women safety workshopsconducted24 women safety workshopsconducted29 women safety workshopsconductedTarget exceeded. Moreworkshops conducted aspart of Women’s monthcommemoration.Number of elderly and peoplewith disabilities workshopsconducted12 elderly and people withdisabilities workshops conducted24 elderly and people withdisabilities workshops conducted24 elderly and people withdisabilities workshops conductedTarget met.Number of schools trained 180 trained schools 250 trained schools 255 schools trained on theprovincial school safety programTarget exceeded. More schoolswere trained than it wasanticipated.54 | <strong>Annual</strong> <strong>Report</strong> <strong>2011</strong>/12 • Department of <strong>Community</strong> <strong>Safety</strong>
Sub-programme: Promotion of <strong>Safety</strong>Performance indicatorBaseline (Actual Output)Actual Performance against targetReason for variance2010/11Target (<strong>2011</strong>/<strong>2012</strong>) Actual (<strong>2011</strong>/<strong>2012</strong>)Number of safety plansdeveloped and safety teamsestablished180 school safety plansdeveloped and safety teamsestablished250 school safety plansdeveloped and safety teamsestablished255 safety plans developed and281 teams establishedTarget exceeded. This processwas a continuation fromthe previous financial year,furthermore more schools wereidentified as problematic due toescalating numbers of violentincidents reported.Number of school safety plansmonitored307 school safety plansmonitored487 school safety plansmonitored489 school safety plansmonitoredTarget was exceeded due toincidence of violence thatoccurred in schools andtherefore more schools had to bemonitored.Quarterly provincialimplementation committeeworkshopsQuarterly ProvincialImplementation CommitteeWorkshops4 Quarterly ProvincialImplementation CommitteeWorkshops2 quarterly provincial workshopsheld and 4 district planningworkshops heldTarget met, quarterly meetingsheld with stakeholders.Workshops and meetings werefurther held with the districtsto plan for training workshops.It was necessary for theseworkshops to be held withdistricts to ensure that planninghappens at local level andthat key local stakeholders areengaged.Number of liquor enforcementoperations114 liquor enforcementoperations200 liquor enforcementoperations337 liquor enforcementoperationsTarget exceeded, this was mainlydue to more shebeens andtaverns identified as problematici.e. non compliance with regardsto selling for under- agedchildren and trading outside thepermitted trading hours.Number of school safetysearches coordinated100 school searches 600 school safety searchescoordinated426 school safety searchescoordinatedTarget not met, the deploymentof patrollers in schools haveresulted in some stability inmost schools resulting in lessreporting of violent incidents,thus focus was diverted to theestablishment of school safetydesks and other interventionssuch as awareness talks andcampaigns on alcohol andsubstance abuse prevention.Number of substance abuseawareness campaigns and talksconducted241 substance abuseawareness campaigns and talks300 substance abuseawareness campaigns and talksconducted341 substance abuseawareness campaigns and talksconductedTarget exceeded. The programhas been one of the flagships forthe youth desk in addressing thescourge of alcohol and substanceabuse among young people,including those still in school.Programme 3: Crime Prevention and <strong>Community</strong> Police Relations • <strong>Annual</strong> <strong>Report</strong> <strong>2011</strong>/12 |55
Sub-programme: Promotion of <strong>Safety</strong>Performance indicator Baseline (Actual Output)Number of correctional servicevisits held2010/11170 Correctional service visits 400 Correctional service visitsheldActual Performance against targetTarget (<strong>2011</strong>/<strong>2012</strong>) Actual (<strong>2011</strong>/<strong>2012</strong>)416 Correctional service visitsheldReason for varianceTarget exceeded, more schoolsparticipated in the programwith some of the school evensponsoring the tours.Number of child safetyawareness conducted30 child safety awareness 50 child safety awarenessconducted315 child safety awarenessconductedTarget exceeded. The projecthas been the flagship forthe National Youth Service(NYS) learners deployed inpolice stations throughout theProvince targeting crèches andprimary schools, project wasalso implemented as part of theschool holiday program.Number of schools wherepatrollers are deployedPatrollers deployed in 20 schools Patrollers deployed in 130schools132 patrollers in schoolsparticipated in HlayisekaprogrammeTarget exceeded due to theneed for more patrollers at otherschools.Number of school safety desksestablished at police stations5 school safety desks establishedat police stations20 school safety desksestablished at police stations28 school safety desksestablishedTarget exceeded. More schoolswere interested in the schoolsafety project.Number of regional social crimeprevention plans developed andimplemented6 joint social crime preventionplans developed andimplemented6 regional social crimeprevention plans developed andimplemented6 plans developed andimplementedTarget met. Plans developedand implemented in partnershipwith municipalities, SAPS andprovincial departments.Number of people trained onsocial crime preventionNo baseline300 people trained on socialcrime prevention300 people trained TrainingWorkshops held with 300people (Nation Youth Servicelearners) to train them on the4 day accredited social crimeprevention programme.292 National Youth Servicelearners and 8 officials attendedthe Accredited Social CrimePrevention Training. Thetraining program was developedand facilitated by the Centre forJustice and Crime Prevention(CJCP). The training programwas aimed at providingdepartmental volunteers (youthdesk members) with informationon how to design and implementsafety interventions on their ownor through partnerships.Quarterly social crime preventionworkshops conducted20 social crime preventiontrainings workshops conducted4 social crime preventionworkshops conducted2 Workshops held (1 Provincial<strong>Community</strong> <strong>Safety</strong> ForumWorkshop and 1 workshop withSedibeng District Municipality)Target not met, only 2workshops were held, howevermeetings were held with allmunicipalities for joint planningand implementation of SocialCrime prevention initiatives.56 | <strong>Annual</strong> <strong>Report</strong> <strong>2011</strong>/12 • Department of <strong>Community</strong> <strong>Safety</strong>
Sub-programme: Promotion of <strong>Safety</strong>Performance indicatorBaseline (Actual Output)Actual Performance against targetTarget (<strong>2011</strong>/<strong>2012</strong>) Actual (<strong>2011</strong>/<strong>2012</strong>)Reason for variance2010/11Number of established CSF’ssupported and strengthenedEstablishment of 15 CSF’ssupported and strengthened15 established CSF’s supportedand strengthenedEstablished 6 functional CSF’sTarget of establishing 15 CSF’swas not met. The Departmentcontinued engagements withmunicipalities to support thefunctioning of their CSF’s and toensure that their functioning is inline with the National Policy.Sessions with Ekurhuleni andEmfuleni Municipalities to guideand support towards the launchof their CSF’s which are bothscheduled for April <strong>2012</strong>. Thedirectorate also attended CSFmeeting of other municipalitiesto ensure their functionality andto provide guidance. Sedibengand West Rand CSF’s incorporateall their local municipalities.Number of liquor educationcampaigns targeting liquortraders15 liquor education campaignstargeting liquor traders held15 liquor education campaignstargeting liquor traders30 liquor education campaignstargeting liquor traders heldTarget exceeded, otherworkshops were facilitated bySAPS.Quarterly liquor education andenforcement planning andevaluation workshops conductedQuarterly liquor education andenforcement planning andevaluation workshops conducted4 Quarterly liquor educationand enforcement planning andevaluation workshops conducted7 Quarterly liquor educationand enforcement planning andevaluation workshops conductedTarget exceeded. Moreworkshops held in partnershipwith the Department ofEconomic Development andSAPS. The workshops mainlytargeted SAPS liquor officersand were also used to shareinformation around the provincialplans to address challengesrelating to liquor regulationwithin the province.Changes to planned targets: No changes were made to planned targetsProgramme 3: Crime Prevention and <strong>Community</strong> Police Relations • <strong>Annual</strong> <strong>Report</strong> <strong>2011</strong>/12 |57
Sub-Programme: Social Crime PreventionPurposeThe main purpose of the sub-programme is to provide professional and volunteer-based victim support servicesto victims of crime in the province, with special focus on victims of sexual and domestic violence.Strategic ObjectivesThe primary strategic objective in this regard is to reduce crimes against women and children, which is achieved,in the main, through the following activities:••Provision of professional services to victims of crime within the province;••Provision of residential services for victims within the province;••Provision of volunteer-based victim support services at police station level in the province; and,••Coordination of victim empowerment in the province.Performance indicators and targetsProvision of professional victims services for victims within <strong>Gauteng</strong>Professional therapeutic services are offered at the Ikhaya Lethemba one-stop centre situated in Braamfontein. Professionalservices are offered in partnership with the Ithemba Rape Crisis Centre, the Teddy Bear Clinic and the NPA. There is also anactive partnership with the SAPS at Ikhaya Lethemba where the Hillbrow and Johannesburg-Central FCS units are housed.A total of 1215 adult victims of crime, especially domestic and sexual offences, entered the centre and received intensivetherapeutic sessions. Upon entering the centre a full assessment of their circumstances and needs was carried out and apersonalised service package was developed for them. In addition, 487 children were seen by the Teddy Bear Clinic andoffered professional psycho-social support services. Approximately 318 (65%) of these children’s intervention resulted in thesubmission of forensic social work reports, which are necessary to ensure that harsher sentences imposed by the courts onthe perpetrators.This family justice service unit is also encompassed at the centre and is manned by Lifeline and the NPA. During the reportingperiod, a total of 402 family legal support sessions were held and 328 victims received post-court appearance counselling.These counselling sessions are aimed at educating victims on the outcomes of their cases and providing them with support,especially in the event that they are not happy with the outcome of their court cases. Finally, 483 victims were assistedin terms of court preparation services. It is important to note that victims are allowed to appoint a significant other withintheir ‘circle of influence’ to participate in court preparation sessions. Statistics showed that about 85% of clients that initiateobtaining a protection order at Ikhaya Lethemba return to court to obtain final orders. This is an above-average achievementwhen one compares it to general research that indicates that less than 50% of clients seeking protection orders completethe process.The medico legal unit, which forms part of the professional services unit, was unable to meet its targets during the reportingperiod. Due to delays in the appointment of staff, services could not be offered in house and victims had to be referredto the Hillbrow medical centre. To deal with the gap in services that this arrangement created, social workers were sentto the site to ensure that all victims who came through this service site were able to still access other tertiary services at thecentre. The employment of staff was concluded in December <strong>2011</strong> and operations then commenced. It should be statedthat challenges were, however, experienced with regard to access to medication. As a result of these challenges, targetswere not met. The matter was raised with the Department of Health.Support to victims of crime through the provision of residential servicesThe Ikhaya Lethemba victims’ centre largely deals with victims of social crime. In many instances, acts of victimisation takeplace within the victim’s home. This results in a situation where the victim cannot remain in the home environment but requiresrelocation to safe, secure accommodation. The centre remains the only shelter that is completely Government-owned in theprovince and can, at full capacity, provide shelter to 140 women and children. The length of stay varies depending onthe personal circumstances of the individual victim. Women and their children can remain overnight, for a few weeks oreven months. The length of stay is also informed by the outcome of the professional assessment on admission, including anexamination of the risk of returning the victim to the abusive home environment. This centre operated well during the financialyear under review and accommodated 296 victims of sexual and domestic violence, which included women and children.Although this is slightly under target, it is important to note that this is due to the enhanced relationship between IkhayaLethemba and community based shelters. Through this network, the centre has aimed to place victims within their communityof origin as a first option given the need to minimise disruption relating to employment and schooling.58 | <strong>Annual</strong> <strong>Report</strong> <strong>2011</strong>/12 • Department of <strong>Community</strong> <strong>Safety</strong>
Children can only be accommodated with their mothers as the centre does not operate as a place of safety. The Departmentis fully mindful of the fact that one of the contributing factors for women to remain in abusive relationships is their financialdependence on their abusers. As a result of this realisation, the Department offers skills development courses, includinghairdressing, beauty therapy, beading and computer skills. 140 women were accommodated in these programmes duringthe period under review. Many women who come into the centre do have full time employment and as a result the centreoffers a free early childhood development programme. During the reporting period, some 88 children were accommodatedin the crèche facility within the centre. Care was given to these children on a daily basis. This care included the provisionof meals and supervision by suitably trained child care educators, along with skilled volunteers. In order to deal with theemotional repercussions of the violence, social workers provide a programme of compulsory psycho-social support forresidents. A total of 652 counselling sessions were offered to residents while in house. Additional group work programmes,art therapy, journaling classes and extensive recreational programmes were offered to the residents during the reportingperiod.The provision of volunteer-based victim support services at police station levelThe Ikhaya Lethemba centre also supports the provision of victim support at police stations across the province. This serviceis offered from a network of victim empowerment rooms manned by volunteers who provide basic reception, assessment andreferral services to victims. These sites do not provide professional services as they don’t have professional staff physically atthe sites. That said, however, they are networked with local Non Governmental Organisation (NGO) and Ikhaya Lethemba.This ensures that there is a comprehensive basket of services available to most communities in the province.A total of 134 (98%) of Victim Empowerment Centres (VEC) in the province were confirmed to be functional during thereporting period. The VECs are largely run by the SAPS with the support of the Department. There are challenges withthe provision of VECs at all stations due to the fact that some stations do not have physical space available for this service.During the reporting period, 259 volunteer training sessions were held. These sessions ensure that there is adequatetraining and support to volunteers so that they can provide an appropriate service to victims. Furthermore, a total of 542supervision sessions were carried out to support volunteers and to refer cases that require more long-term professional care.The Department, in partnership with the funded VEC network, also has a programme of quality assurance visits wheremembers of staff visit and monitor services at the VECs. The Department, working together with local property managementcompanies, succeeded in launching some twelve green doors during the reporting period. An extensive audit of sexualoffences dockets in the province was also conducted during the reporting period. 843 dockets were audited and thefindings of these audits were analysed and shared with police management in order to contribute towards improved servicedelivery to victims.Finally the Department has three regional offices in Duduza, Orange farm and Sharpeville. These offices operatedsuccessfully during the period under review.Coordination of victim empowermentThe lead department for victim empowerment remains the Department of Health and Social development. That said,however, it is important to note that the Department provides support and assistance with the coordination of victim supportwhere the need arises. The Department attends the provincial victim empowerment forum and the shelter network forum,both of which are run by the Department of Social Development. The Department also assists with the coordination of sevenlocal forums within the province. In addition, the Department, in partnership with the Department of Social Development,successfully launched a partnership with 10 NGOs that specialise in victim empowerment. The NGOs include the AlphaTrauma, Riet Family Care, Areageng, WAWA, Lifeline JHB, Lifeline Pretoria, Eldorado Park Crisis Centre, Polokego, MoshyMate and Kopano Manyo. All mentioned programmes assist the Department in its endeavours aimed at achieving areduction in crimes against women and children, as per the provincial outcome of “All people in South Africa are and feelsafe”.Programme 3: Crime Prevention and <strong>Community</strong> Police Relations • <strong>Annual</strong> <strong>Report</strong> <strong>2011</strong>/12 |59
Sub-programme: Social Crime PreventionPerformance Indicator Baseline (Actual Output)Number of adults receivingprofessional psycho-socialsupport2010/111060 adults receivedprofessional psycho-socialsupportActual Performance against targetTarget (<strong>2011</strong>/<strong>2012</strong>) Actual (<strong>2011</strong>/<strong>2012</strong>)1104 adults receivingprofessional psycho-socialsupport1215 adults receivedprofessional psycho-socialsupportReason for varianceTarget overachieved with111. This may be attributedto the close working referralrelationship with in-houseFamily Child Violence PolicingServices (FCS) clusters.Number of children receivingprofessional psycho socialsupport436 children receivedprofessional psycho socialsupport480 children receivedprofessional psycho socialsupport487 children receivedprofessional psycho socialsupportTarget exceeded due to highernumber referrals for social workforensic reports.Number of victims receivingmedico legal servicesThis target was not met duringthe reporting period400 victims receiving medicolegal services79 victims received medicolegal servicesTarget not achieved due todelay in appointment ofspecialized medico legal staff.In addition, there was lack ofcommitment of Departmentof Health to supply theDepartment with requiredmedical supplies as agreed in2010/<strong>2011</strong> financial year.Number of victims ofaggravated robbery / violentcrime referred for psycho socialinterventions44 victims of aggravatedrobbery / violent crime referredfor psycho social interventions100 victims of aggravatedrobbery / violent crime referredfor psycho social interventions113 victims of aggravatedrobbery / violent crime referredfor psycho social interventionsThe over-achievement of thistarget is attributed to the directreferral from local business suchas Kentucky Fried Chicken andother shops form the CarltonShopping Centre for debriefingand containment services.Number of family legal supportsessions- 300 family legal supportsessions402 family legal supportsessionsOutreach campaigns to externalshelters, training of SAPSofficials led to overachievementof target.Number of victims receivingpost court appearance sessions276 victims received post courtappearance sessions240 victims receiving post courtappearance sessions328 victims received post courtappearance sessionsTarget exceeded. This may beattributed to the close workingreferral relationship within-house Family Child ViolencePolicing Services (FCS) clusters.Number of victims receivingcourt preparation services477 victims received courtpreparation services480 victims receiving courtpreparation services483 victims received courtpreparation servicesTarget overachieved. Thismay be attributed to the closeworking referral relationshipwith in-house Family ChildViolence Policing Services(FCS) clusters. In addition,target was also overachieveddue to the fact that the primaryvictim is allowed to nominate asignificant other to attend courtpreparation sessions.60 | <strong>Annual</strong> <strong>Report</strong> <strong>2011</strong>/12 • Department of <strong>Community</strong> <strong>Safety</strong>
Sub-programme: Social Crime PreventionPerformance Indicator Baseline (Actual Output)Number of victims provided withresidential services at IkhayaLethemba2010/11481 victims provided withresidential services at IkhayaLethembaActual Performance against targetTarget (<strong>2011</strong>/<strong>2012</strong>) Actual (<strong>2011</strong>/<strong>2012</strong>)360 victims provided withresidential services at IkhayaLethemba296 victims provided withresidential services at IkhayaLethembaReason for varianceTarget not met due to the factthat clients that presented withcomplex cases remained longerin shelter, thus impacting onnew admissions.It should also be noted thatmost clients are encouragedto remain within their originalenvironment to preventdisruption of family and broadercommunity support services.Empowerment within theclient’s milieu ensures longerterm impact in terms of copingskills.Number of victims from regionalvictims offices placed atcommunity based shelters8 victims from regional victimsoffices placed at communitybased shelters60 victims from regional victimsoffices placed at communitybased shelters11 victims from regional victimsoffices placed at communitybased sheltersTarget not met due to the factthat clients are referred to thenearest shelter facility in theirregion. In addition, VictimEmpowerment norms andstandards compel victims to bereferred within their locality toensure that schooling of minorsand employment status ofvictims are not affected.Number of womenaccommodated in skillsdevelopment138 women accommodated inskills development120 women accommodated inskills development140 women accommodated inskills developmentTarget exceeded. Clientsadmitted register for morethan one skills developmentprogramme. Count dependson actual training programmescompleted.Number of childrenaccommodated in ECD centre45 children accommodated inECD centre88 children accommodated inECD centre88 children accommodated inECD centreTarget met.Number of adult residentsreceiving psycho socialinterventions590 adult residents receivedpsycho social interventions208 adult residents receivedpsycho social interventions652 adult residents receivedpsycho social interventionsThe target refers to sessions andnot clients. Thus 1 client mayreceive more than one psychosocial sessions and thereforetarget was exceeded.Number of functional VEC’sas per minimum norms andstandards122 functional VEC’s as perminimum norms and standards130 functional VEC’s as perminimum norms and standards134 functional VEC’s as perminimum norms and standardsTarget exceeded. 4 VEC’s wereestablished at the followingsatellite police stations CosmoCity, Park Station, Munsievilleand Moffat Park.Programme 3: Crime Prevention and <strong>Community</strong> Police Relations • <strong>Annual</strong> <strong>Report</strong> <strong>2011</strong>/12 |61
Sub-programme: Social Crime PreventionPerformance Indicator Baseline (Actual Output)Volunteers and communitystructures trained2010/11267 volunteers andcommunity structures trainedActual Performance against targetTarget (<strong>2011</strong>/<strong>2012</strong>) Actual (<strong>2011</strong>/<strong>2012</strong>)200 volunteers andcommunity structures trained259 volunteers andcommunity structures trainedReason for varianceTarget exceeded. NGO-VECLinkage programmeprovided more capacity toroll-out training. Training wasfocused on larger numberof volunteers as set out intarget to enhance the qualityof service delivery.Quality assurance visits 780 quality assurance visits 536 quality assurance visits 542 quality assurance visits Target exceeded NGO-VECLinkage programme providedmore capacity to conductDevelopment QualityAssurance visits.Supervision sessions withVEC volunteers769 supervision sessionswith VEC volunteers536 supervision sessionsheld with VEC volunteers542 supervision sessionsheld with VEC volunteersTarget exceeded. NGO-VECLinkage programme providedopportunity to have morestructured supervisionsessions with volunteers.Educational projects forVAWAC- 35 Educational projects forVAWAC35 Educational projects forVAWACTarget met.Sexual offences docketsaudited on FCS cluster levelAudit dockets conducted in10 police stations.A total of 253 dockets havebeen audited.4 sexual offences docketsaudited on FCS cluster level5 clusters audited, a totalof 843 dockets have beenaudited.Target met. The followingclusters participated:Alexander, Springs,Sebokeng, Sunnyside andPretoria.Functional Regional VictimsOffices (RVO’s)3 functional regional victims’offices3 functional regional victim’soffices (RVO’s)3 functional regional victim’soffices (RVO’s)Target met.Attendance of quarterly regionalforum meetings (7 forums)36 quarterly regional forummeetings attended28 quarterly regional forummeetings attended (7 forums)28 meetings attended Target met.Attendance of Bi-monthlyprovincial VEP forummeetings6 Bi-monthly provincial VEPforum meetings attended6 Bi-monthly provincial VEPforum meetings attended6 bi-monthly provincial VEPmeetings attendedTarget met.Attendance of quarterlyshelter network meetings4 quarterly shelter networkmeetings attended4 quarterly shelter networkmeetings attended4 shelter network meetingsattendedTarget met.Attendance of quarterlyNational VEP meetings4 quarterly National VEPmeetings attended4 quarterly National VEPmeetings attended4 National VEP meetingsattendedTarget met.Changes to planned targets: No changes were made to planned targets62 | <strong>Annual</strong> <strong>Report</strong> <strong>2011</strong>/12 • Department of <strong>Community</strong> <strong>Safety</strong>
Sub-programme 3.3: Public Education and InformationPurposeThe aim of the sub-programme is to enable citizens to know and be able to participate in Departmental programmes aimedat promoting public safety.The sub-programme is responsible for external and internal communications function of the Department. This includesdevelopment communications, marketing and media services of the Department. This is done through the implementation ofthe Department’s three strategies, namely the Outreach, Media Relations as well as Marketing and Internal Communicationstrategies. The three strategies are developed and implemented annually. The strategies are all linked to the nationaland provincial communications frameworks. The events management function of the Department is also located in thesub-programme, straddling all directorates of the sub-programmes. As part of the Take Charge campaign and mobilisingand supporting the social movement against crime and road accident fatalities, the sub-programme also organises andsupports three Take Charge sectors that complement the mobilisation and communication work done by the Department incommunities. The three sectors are Labour, Faith Based Organisations (FBO) and the Sports, Arts, Culture and Edutainment(SPACE). The SPACE sector was previously known as the celebrity sector. The Department has enlisted sector coordinatorswhose primary function is to focus dedicated support to sectors through facilitating the implementation of the sectors’Programmes of Action (POAs).The highlight during the financial year has been the conceptualisation and roll-out of the Know-Your-Neigbourhood Campaigninto areas such as Bedfordview, Sunnyside, Booysens, Vereeniging, Carletonville, Temba, Brakpan, Meadowlands andSprings. The key achievements of the campaign are reduction in house robberies, because neighbours have been vigilant intheir environment. More people are now reporting crime and criminal activities in the areas where the campaign has beenlaunched. Police response times have improved because now people are making use of sector policing numbers whichare displayed on sector vehicles, rather than telephoning the police station, which often increases the amount of time thepolice take in responding to certain crime scenes. The Department will continue to rollout the campaign in other areas of theprovince in the new financial year.Strategic ObjectivesThe sub-programme performs its duties and functions in pursuit of the following strategic objectives:••To increase awareness through marketing;••To increase awareness through outreach programmes;••To increase positive media coverage on Departmental programmes and services;••To ensure effective and efficient stakeholder management; and,••To inform internal employees on the Department.Performance indicators and targetsMarketing and internal communicationsThe Department’s marketing strategy was intensified during the year under review. Services and programmes were extendedto reach a vast number of citizens in the province through various marketing channels. Corporate exhibitions targeted thefollowing areas:••Major shopping malls in the province where Departmental officials interacted with shop owners and customers;••Petro Ports on national roads where a huge number of road users were informed and educated on road safety rulesand given safety tips, during the Easter holiday and festive seasons;••Pension Payout points, where the elderly were educated and guided on safety tips and encourage to report abuse;and,••Employees of the <strong>Gauteng</strong> Provincial Government were educated and encouraged to join safety structures within theircommunities.Programme 3: Crime Prevention and <strong>Community</strong> Police Relations • <strong>Annual</strong> <strong>Report</strong> <strong>2011</strong>/12 |63
This has increased the number of corporate exhibitions from the annual target of 29 to 35 during the year under review asfollows:••Bramley pension payout on the 4 th of April <strong>2011</strong>;••Alexandra pension payout on the 4 th of April <strong>2011</strong>;••N14 on the 19 th of April <strong>2011</strong> on both sides of the road;••N3 on the 20 th of April <strong>2011</strong> on both sides of the road;••N1 on the 21 st of April <strong>2011</strong> on both sides of the road;••Tsakane Corporate Exhibition on the 6 th of May <strong>2011</strong>;••Silver Lakes mall in Boschkop on the 27 th of May <strong>2011</strong>;••Lenasia Pension payout point exhibition on the 3 rd of June <strong>2011</strong>;••Birch Acres Mall exhibition on the 24 th of June <strong>2011</strong>;••Carletonville King’s Mall on the 8 th of July <strong>2011</strong>;••Trade Route Mall exhibition on the 5 th of August <strong>2011</strong>;••Eastgate Mall exhibition on the 26 th of August <strong>2011</strong>;••Brooklyn Mall Exhibition on the 02 nd of September <strong>2011</strong>;••Cresta Mall Exhibition on the 09 th of September <strong>2011</strong>;••The Glen Shopping Mall on the 13 th of September <strong>2011</strong>;••Melrose Arch Shopping Mall on the 23 rd of September <strong>2011</strong>;••Attlyn Shopping Mall exhibition on the 7 th of October <strong>2011</strong>;••Vaal Mall exhibition on the 14 th of October <strong>2011</strong>;••Centurion Mall exhibition on the 21 st of October <strong>2011</strong>;••Magaliesburg Junction on the 4 th of November <strong>2011</strong>;••Vandyke Park on the 11 th of November <strong>2011</strong>;••N3 Total Petro port on the 14 th of November <strong>2011</strong>;••N3 Total Petro port on the 15 th of November <strong>2011</strong>;••Melrose Arch Shopping Mall on the 22 nd of November <strong>2011</strong>;••N14 Total Petro port on the 30 th of November <strong>2011</strong>;••N14 Total Petro port exhibition on the 30 th of November <strong>2011</strong>;••N14 Total Petro port on the 01 st of December <strong>2011</strong>;••N1 Shell Ultra City exhibition on the 02 nd December <strong>2011</strong>;••N1 Total Petro port exhibition on the 06 th December <strong>2011</strong>;••N1 Engine exhibition at Hammanskraal on the 8 th December <strong>2011</strong>;••Departments of Economic Development and Education on the 3 rd of February <strong>2012</strong>;••Departments of Education on the 3 rd of February <strong>2012</strong>;••Department of Roads and Transport on the 17 February <strong>2012</strong>;••Sports, Arts and Culture on the 23 rd February <strong>2012</strong>;••Westgate mall on the 16 th March <strong>2012</strong>; and,••Menlyn mall on the 30 th March <strong>2012</strong>.In addition, the Department branded a total of 92 events, both internal and external. These events comprise public meetingswith communities, focus months events, MEC’s visits to police stations and organisations, Take Charge sector events, mediaevents and events spearheaded by other business units in the Department. The Department’s services and programmes areadvertised through branding material and distribution of pamphlets to citizens.Further, the Department rolled out the street pole advertising during the 2 nd quarter with an SMS number 32026. Thekeywords attached to the SMS number are: Bribe, Police and Abuse to encourage community feedback and participation.Since the SMS campaign started in November <strong>2011</strong>, the Department received 70 messages broken down as follows:••31 messages were received as complaints against the police and these were referred to the Directorate: Monitoring,Evaluation and Service Delivery Complaints for investigation;••33 messages were complaints about abuse and these were referred to Ikhaya Lethemba; and,••6 messages were complaints alleging corruption, which were referred to the relevant authorities for attention.A strategy to popularise the number will be rolled out in the new financial year. The street pole advertising has allowed theDepartment to reach more than 2 000 000 people on busy roads of the province. Of particular importance is the fact thatthe street pole advertisements display all Departmental programmes and encourage community participation and feedback.64 | <strong>Annual</strong> <strong>Report</strong> <strong>2011</strong>/12 • Department of <strong>Community</strong> <strong>Safety</strong>
Publications and Promotional Material14 publications were planned and 5 were producedThe Department continues to ensure that the citizens of <strong>Gauteng</strong> has access to information by publishing and distributinggovernment information through booklets and <strong>Annual</strong> reports in four different languages, newsletter, posters and pamphlets toalso report back to citizens on the work of the government. These publications are also published on the department website.The following corporate publications and information material were produced and distributed during the year under review:••2000 copies of the Budget Speech booklet;••4000 copies of the Budget Speech <strong>Community</strong> Version in four languages of the province, namely: English, Zulu, SouthSotho and Afrikaans;••280 685 topical pamphlets and posters. All were developed, designed and produced in house and only 200placards were outsourced;••Three editions of Keeping in Touch newsletter were produced; and,••<strong>Safety</strong> tips booklet.The department also expanded the marketing scope and now has the presence in the following social networks which arelinked to the department website••Facebook – People are encouraged during events and through publications and the departmental website joint theDepartment on social media platforms. The Department currently has ±1240 friends on Facebook and is sending andaccepting friend requests on a daily basis.••Twitter - The Department is currently following 7 people on Twitter and has 4 followers••LinkedIn – The Department currently has no associations on LinkedIn. This is anticipated to change as a Social mediastrategy has been developed.Development communication and events managementOutreach Programmes are a communications tool in engaging communities on issues that affect their lives, their rightsand obligations as citizens. It is also aimed at illustrating developmental opportunities and how to access them, thepolicies and activities of government, specific campaigns affecting communities, service delivery plans and challenges. Thedepartment has conducted outreach programmes through <strong>Gauteng</strong> Izimbizo, <strong>Community</strong> <strong>Safety</strong> Public Meetings, CrimeAwareness Road shows on services and programmes of the department, Launch of Know Your Neighbourhood Campaignand stakeholder meetings.The Department participated and coordinated Economic Opportunities Road shows which are <strong>Gauteng</strong> Provincial GovernmentProgrammes. The programme targets communities of <strong>Gauteng</strong> in empowering them about economic opportunities availablein government and how they can access them. All government departments participate in this programme.Other <strong>Gauteng</strong> Provincial Government programmes which included Commemorative Days, Back to School Campaign,<strong>Gauteng</strong> Education Imbizo, Health Imbizo, Opening of the Legislature, Women’s Month activities, International Day ofPeople with disabilities, Public Service Week and Mandela Day, the department also participated in.In support of the Departmental activities, Events Management was provided during Focus Months: namely Launch of <strong>Safety</strong>and Security Month, Child Protection Week, Budget Speech, Women’s Month, <strong>Community</strong> <strong>Safety</strong> Public Meetings, YouthMonth, Launch of Festive Season Campaign, Public Exhibitions, Know Your Neighbourhood Campaigns and 16 Days ofActivism of no violence against Women and Children. The Department exceeded its target of 68 outreach activities forthe reporting period. A total of 69 outreach activities were conducted during the year under review and these are listedhereunder for ease of reference.••Organised 2 <strong>Gauteng</strong> Imbizo in Toekomsrus on the 6 th April <strong>2011</strong> and Barrage 17 th August <strong>2011</strong>;••Participated at Freedom Day Commemoration on the 27 th April <strong>2012</strong>;••Coordinated MEC’s School Visit and donation of Computers on the 15 th April <strong>2011</strong> at Rebane Laka Secondary SchoolMamelodi;••Participated in 4 Economic Opportunities Roadshow Fochville 20 th April <strong>2012</strong>, Diepsloot 23 rd June <strong>2011</strong>, Randfointein22 nd November <strong>2011</strong> and Tembisa 23 rd February <strong>2012</strong>;••Organised 4 <strong>Community</strong> <strong>Safety</strong> Public Meeting at Brakpan on the 6 th May <strong>2012</strong>, Eldorado Park 6 th September <strong>2011</strong>,Ormonde View 8 th September <strong>2011</strong> and Reiger Park 16 th February <strong>2012</strong>;••Participated and organised 3 Child Protection Week National launch of Child Protection 30 th May <strong>2011</strong> PaarlshoopLanglaagte, Open Day Standard Bank Arena 1 st June <strong>2011</strong> and School Roadshow 3 rd June <strong>2011</strong>;••Coordinated Awareness to Female Offenders going on Parole at Johannesburg Correctional Centre 7th June <strong>2011</strong>;Programme 3: Crime Prevention and <strong>Community</strong> Police Relations • <strong>Annual</strong> <strong>Report</strong> <strong>2011</strong>/12 |65
••Participated and organised 4 Youth Month Commemoration of Youth Day 16th June <strong>2012</strong> Orlando Stadium, YouthMonth <strong>Safety</strong> workshop 15th June <strong>2012</strong> Kagiso, Dobsonville 21st June <strong>2012</strong> and Sauceville 27th June <strong>2012</strong>;••Coordinated and organised 9 Launch of Know Your Neighbourhood Campaign Bedfordview 18th June <strong>2012</strong>,Sunnyside 13th July <strong>2011</strong>, Booysens 13th September <strong>2012</strong>, Vereeniging 17th September <strong>2012</strong>, Carletonville 28thSeptember <strong>2011</strong>, Temba 13 th October <strong>2011</strong>, Brakpan 22 nd October <strong>2011</strong>, Meadowlands 12 th February <strong>2012</strong> andSprings 21 February <strong>2012</strong>;••Participated at Women’s Day Commemorative on the 9th August <strong>2011</strong> Tshwane Union Building;••Coordinated Budget Speech Presentation and Stakeholder Engagement on the 5th July <strong>2011</strong>;••Coordinated Mandela Day activity Devon on the 18th July <strong>2012</strong>;••Coordinated Female Roadblock R21 towards OR Tambo airport on the 23rd August <strong>2012</strong>;••Coordinated 2 Awareness Campaign to people with disability and Elderly Soweto on the 25th August <strong>2011</strong> andDevon 16th November <strong>2011</strong>;••Coordinated Public Service Week Exhibitions at Duduza Thusong Service Centre on the 22nd September <strong>2012</strong>;••Coordinated 3 Public Exhibitions Devon Thusong Service Centre 10th November <strong>2011</strong>, <strong>Community</strong> <strong>Safety</strong> GroundFloor 9th December <strong>2011</strong> and Soweto Ipelegeng Thusong Service Centre 28th March <strong>2012</strong>;••Coordinated and Organised National Launch of 16 Days of Activism Campaign on the 25th November <strong>2011</strong>Atteridgeville;••Participated at International Day of People with Disabilities 3rd December <strong>2011</strong> in Tshwane;••Coordinated Launch of Festive Season Campaign on the 7th December <strong>2011</strong> N14 Diepsloot;••Coordinated Closing of 16 Days of Activism Campaign on the 10th December <strong>2011</strong> Kwa-Thema;••Coordinated Back to School Campaign Alexandra 18th January <strong>2012</strong>;••Coordinated <strong>Safety</strong> and Security Month Stakeholder Meeting 24th January <strong>2012</strong> Turfontein;••Coordinated Launch of <strong>Safety</strong> and Security Month 3rd February <strong>2012</strong> Turfontein;••Coordinated Crime Perception Session 22nd February <strong>2012</strong> Sheraton Hotel;••Participated at the launch of Premier’s Hotline on the 2nd February <strong>2012</strong>;••Participated at the Opening of Legislature 20th February <strong>2012</strong> Evaton;••Participated at the Deputy Presidential visit Munsieville on the 24th February <strong>2012</strong>;••Participated at Heritage Day Commemoration on the 24th September <strong>2012</strong> at Cradle of Human Kind Westrand;••Participated at the Olievenhoutbosch SOD Turning on the 16th March <strong>2012</strong> at Hekpoort; and,••Coordinated Health Imbizo on the 14th March <strong>2012</strong>.••16 Crime Awareness road shows were held as follows:••Meadowlands on the 10th April <strong>2011</strong>;••Eldorado Park 10th May <strong>2011</strong>;••Toekomsrus 27th May <strong>2011</strong>;••Orange Farm 31st May <strong>2011</strong>;••Lenasia South 27th July <strong>2011</strong>;••Eden Park 29th July <strong>2011</strong>;••Geluksdal 26th August <strong>2011</strong>;••Nigel 9th September <strong>2011</strong>;••Mamelodi West 20th October <strong>2011</strong>;••Tarlton 25th October <strong>2011</strong>;••Etwatwa 2nd December <strong>2011</strong>;••Ennerdale 24th January <strong>2012</strong>;••Zithobeni 31st January <strong>2012</strong>;••Devon 16th March <strong>2012</strong>;••Brazzaville 23rd March <strong>2012</strong>; and,••De Deur 30th March <strong>2012</strong>.A total of 32 000 people were reached.Media Monitoring and Research: <strong>Annual</strong> target 12 reports and actual was 12, target metThe unit generated total coverage of the Department 574 times during the financial year. The unit was particularly responsiveto issues raised in the media as well as to media enquiries on a daily basis. Some of the issues that drove coverage andthe highlight for the Department are:••Successes of the <strong>Gauteng</strong> Traffic Police; <strong>Gauteng</strong> Traffic Police spokesperson;••The launch and the roll out of the Know Your Neighbourhood Campaign: MEC Mazibuko••Unveiling of Easter Campaign Plan: MEC Mazibuko;••Departmental Budget Speech: MEC Mazibuko;••Crime awareness campaigns: MEC’s spokesperson;••Focus Months: MEC’s spokesperson;••Announcement of Provincial statistics: Premier, MEC Mazibuko and Provincial Commissioner of Police;••MEC’s quarterly media briefings: MEC Mazibuko;••School and Tavern raids: MEC’s spokesperson;66 | <strong>Annual</strong> <strong>Report</strong> <strong>2011</strong>/12 • Department of <strong>Community</strong> <strong>Safety</strong>
••Unveiling of plans to keep malls and ranks safe: MEC Mazibuko;••The 16 Days of no Violence against Women and Children campaign;••Assembly of domestic violence victims : MEC Mazibuko;••Launch of Festive season: MEC Mazibuko;••<strong>Safety</strong> and Security month activities: MEC spokesperson;••Dialogue with visually impaired on road safety issues: MEC Mazibuko;••MEC quarterly media briefings: MEC Mazibuko; and,••Crime perception session with foreign embassies: MEC Mazibuko.Most reports received in the media were covered positive showing that there is concerted effort to maintain good reportingand to showcase the good work the department is doing. Both local and mainstream media are showing undivided supportto the department particularly electronic media.Media Writing: Target was 8 articles and the actual was 8, target metIn an attempt to showcase some of the departmental programmes and strengthen safety in the province, the unit has writteneight articles/ opinion pieces and all have been published in different media house.These following topics/ subjects were covered in these articles:••Condemning bad taxi drivers - published in Daily Sun;••Profiling Youth Month and Youth Desks - published in Daily Sun and Sowetan;••Condemning the xenophobic attacks - published in a Daily Sun and The Citizen;••Profiling the Know Your Neighbourhood Campaign - published in The Citizen;••Profiling the Victim Empowerment Centres - published in The New Age and The Star;••Condemning Police Killings - published in The Citizen and The Star;••Profiling 16 Days of no Violence against Women and Children - published in Sunday World and The New Age; and,••<strong>Safety</strong> Month - published in The Star and Pretoria News.Media Engagement: 12 engagements per financial year, actual 19, target exceededA total of 19 media engagements were held during the financial year as follows:••Media Briefing for Easter Road <strong>Safety</strong> Campaign in April : MEC;••The MEC participate a media interview on What’s Yours Take on Masechaba Show: MEC;••The unit supported the media briefing session on provincial crime statistics: Premier, Provincial Commissioner and theMEC Mazibuko;••The MEC participated in David O Sullivan’s show on TALK Radio 702: MEC Mazibuko;••An interview on excessive speeding in the province on Khozi fm with <strong>Gauteng</strong> Traffic Spokesperson;••Feedback on roadworthy operations: <strong>Gauteng</strong> Traffic Police spokesperson;••Substance abuse in Hammanskraal on Moretele <strong>Community</strong> Radio: MEC spokesperson;••License scam in <strong>Gauteng</strong>: MEC Spokesperson;••The launch of school patrollers: MEC Mazibuko and MEC Creecy;••Public protest led by the ANCYL: MEC spokesperson;••The Spokesperson for <strong>Gauteng</strong> Traffic Police took part in the current affairs show in Jozi fm on festive season statisticsand operations: <strong>Gauteng</strong> Traffic Police spokesperson;••The Spokesperson for <strong>Gauteng</strong> Traffic Police took part in Kasie fm on festive season statistics and operations: <strong>Gauteng</strong>Traffic Police spokesperson;••Media launch to announce <strong>Safety</strong> and Security Month activities: MEC Mazibuko;••A media interview took at Kaya fm on <strong>Safety</strong> and Security Month : MEC Mazibuko;••Interactive engagement with listeners was held at Radio Pulpit on activities of <strong>Safety</strong> Month : MEC spokesperson;••Live interview with Andy Mashaile at Eastwave radio on <strong>Safety</strong> Month activities: MEC Spokesperson and CPFProvincial Chairperson;••Spokesperson for GTP was invited in Kasie to discuss corruption/bribery by GTP: <strong>Gauteng</strong> Traffic Policespokesperson;and,••Media briefing, dialogue with embassies and business on crime perception which took place at the Sheraton Hotel:Premier of <strong>Gauteng</strong>, MEC Mazibuko and Provincial Commissioner of Police.Sports, Arts, Culture and Edutainment sectorThe department has a partnership with celebrities, sports and arts personalities in the province as Ambassadors of <strong>Safety</strong>.SPACE sector (Sports, Arts, Culture and Edutainment) is in the process of restructuring. 52 stakeholder meetings and activitiesconducted during the year under review to plan sector events as well as support departmental events as follows: In total thesector was active in 52 events for the year as follows:••Sector participated and coordinated Crime and <strong>Safety</strong> Campaign Launch in Hammanskraal on the 17 th April <strong>2011</strong>;••Sector participated during the Workers Day Celebration held on the 1 st May <strong>2011</strong> in Atteridgeville;••The Sector in partnership with Neighbourhood Solutions planned and conducted Sports against Crime event inDavidsonville on the 2 nd May <strong>2011</strong>;Programme 3: Crime Prevention and <strong>Community</strong> Police Relations • <strong>Annual</strong> <strong>Report</strong> <strong>2011</strong>/12 |67
••Workshop was held with Artists at Musicians’ Campaign against Drugs rehearsal event on the 6 th May <strong>2011</strong> inCarnival City;••Sector supported the Crime Awareness Roadshow in Eldorado Park on the 10 th May <strong>2011</strong> as part of Child ProtectionWeek;••The Sport against Crime soccer tournament was held with Hammanskraal stakeholders on the 11 th June <strong>2011</strong> focusingon substance abuse and teenage pregnancy as part of Youth Month activities;••The Sports against Crime event was held with Neigboughood Solutions on the 16 th June <strong>2011</strong>at Princess High SchoolWitpoortjie focusing on substance abuse in the area;••Sport against Crime Soccer Tournament was held with Sports Inter-Change Sports club on the 25 th June <strong>2011</strong> at NikeSports Complex Pimville in Soweto to mark Youth Month;••A Sport against Crime Event was held with Sports Interchange in Attridgeville on 9 th July <strong>2011</strong>;••The Sector Presented the Take Charge Campaign at the workshop in Diepsloot on the 30 th July <strong>2011</strong>;••Women’s Day Celebration, celebrating Women in Sport was held at Princess High Schools, Witpoortjie on the 9 thAugust <strong>2011</strong>;••Women’s day celebration was held at Tshepo Themba <strong>Community</strong> Centre in Etwatwa Daveyton on the 9 th August<strong>2011</strong>;••Fun run event was planned and held with Sports Inter-change Sports Club on the 20 th August <strong>2011</strong> at Rietvlei;••Sports tournament was held on the 20 th August <strong>2011</strong> in Roodepoort, attended by young women from Tshepisong andMathole;••Campaign against Abuse of the Disabled people was held on the 21 th August <strong>2011</strong> at Temba Boikanyo Center forthe Disabled;••The sector participated at the Eskom safety week campaign at Ekurhuleni on the 19 th August <strong>2011</strong>;••The Sports against crime event was held with Hammanskraal Sports Council at Hammanskraal on the 27 th August<strong>2011</strong>;••The Athletics South Africa Central <strong>Gauteng</strong> held a Fun run in Kagiso Sports Complex on the 27 th August <strong>2011</strong>,targeting youth between ages 14- 21 in Kagiso and the surrounding areas;••The SPACE Sector supported by the Labour Sector and FBO Sector held the Heritage Month Celebration event atEtwatwa on the 22 nd September <strong>2011</strong>;••The first harvest celebration by Nigerian nations was held at Bedfordview on the 3 rd September <strong>2011</strong>. The Sectorpresented Anti Xenophobic messages;••Workshop was held with Cultural Groups and Etwatwa Stakeholders on the 13 th September <strong>2011</strong> at Etwatwa topresent about the Take Charge Campaign;••Take Charge workshop was held with the 20 Performing Arts legends on the 22 nd September <strong>2011</strong> at IkhayaLethemba Braamfontein;••Sector supported the Youth Desk Seminar held on the 4 th October <strong>2011</strong> organised by Roodepoorts Youth Desk andNeighborhood Solution;••The sector held a workshop on the 5 th October <strong>2011</strong> with a band of young people from Magson Manor to encouragethem to participate in the Take Charge Campaign;••A workshop was held with Leboneng Brass band and various artists on the 11 th and 13 th October <strong>2011</strong> to presentTake Charge Campaign and plans in terms of creating substance abuse awareness campaign;••Campaign to create awareness on substance abuse (Nyaupe) was held on the 12 th October <strong>2011</strong> in Hammanskraal;••Sector participated in the walk against substance abuse on the 22 nd October <strong>2011</strong> at Etwatwa;••The Walk against Crime, Xenophobia and Substance Abuse event was held on the 29 th October <strong>2011</strong> at MehlarengStadium;••Take Charge workshop was held at Soweto Information Centre on the 13 th November <strong>2011</strong>;••Take Charge workshop was held and conducted in Eldorado Park on the 15 th November <strong>2011</strong> at the POP CentreGoud Street Eldorado Park;••Take Charge workshop was held with Isithebe Theatre Production on the 16 th November <strong>2011</strong> to explore the 16 DaysCampaign programme;••Sports against Crime Unity tournament was held on the 19 th November <strong>2011</strong> at the Nelson Mandela Stadium inHammanskraal;••The Launch of Take Charge Campaign was held in Meadowlands zone Soweto information Centre on the 14 thNovember <strong>2011</strong>;••Sector supported the Youth Summit held on the 21 st November <strong>2011</strong> in Roodepoort Wilropark;••Dance event was held in Meadowlands on the 27 th November <strong>2011</strong> at Bapedi <strong>Community</strong> Hall to mobilize youthagainst crime;••HIV/AIDS Walk <strong>2011</strong> and Roll-out of 16 day of Activism Campaign was held on 1 st December <strong>2011</strong> in Etwatwa;••16 Days Campaign against women and child abuse sports tournament was held with Neighborhood Solutions on the3 rd December <strong>2011</strong> at Princess High School in Roodepoort;68 | <strong>Annual</strong> <strong>Report</strong> <strong>2011</strong>/12 • Department of <strong>Community</strong> <strong>Safety</strong>
••Sector participated at Hammanskraal <strong>2011</strong> Volunteers Awards ceremony held on the 9 th December <strong>2011</strong> atHammanskraal <strong>Community</strong> Centre;••<strong>Annual</strong> Sports against Crime Fun Run was held in partnership with Sports Interchange on the 10 th December <strong>2011</strong> atChris Hani Sports Complex;••Launch of Etwatwa Festive Game was held on the 15 th December <strong>2011</strong> as a holiday programme for Etwatwacommunity;••Sector coordinated Etwatwa festive Games started from the 17 th – 23 rd December <strong>2011</strong> to promote safety and socialcohesion over festive season;••An Inter-sectoral Campaign to create awareness on safety in schools and children in Dobsonville was held on the 28 thJanuary <strong>2012</strong> as part of Back to School Campaign at Umthombowolwazi <strong>Community</strong> Hall;••<strong>Safety</strong> Awareness Campaign was held in a form of a fun run on the 4 th February <strong>2012</strong> at Hunters field Stadium inKatlehong;••The <strong>Safety</strong> Awareness Campaign was held in partnership with Nambitha Project for the vulnerable groups on the 11 thFebruary <strong>2012</strong> in Atlas Studios;••The Sector participated at the launch of volunteer programme for sports on the 13 th February <strong>2012</strong> in Pretoria;••Awareness campaign was planned and conducted with Nambitha Projects on the 11 th February <strong>2012</strong> in Sedibeng;••Take Charge workshop was held with Sedibeng Youth Organisation on the 14 th February <strong>2012</strong>;••Take Charge workshop was held with Dobsonville Sports Organisation on the 19th February <strong>2012</strong>;••Campaign Against Abuse of the Disabled and vulnerable groups were held with Bathabile Solutions on the 3 rd March<strong>2012</strong> in Lakeside, Vaal;••Take Charge workshop was held with a group of youth on the 5 th March <strong>2012</strong> in Evaton;••Take Charge workshop was held with Lakeside Stakeholders’ Forum on the 18 th March <strong>2012</strong> to present and finalisedthe programme of action for <strong>2012</strong> in terms of campaigns and outreach programmes; and,••Sector supported the School <strong>Safety</strong> Campaign held on the 19 th March <strong>2012</strong> in Lakeside.The sector directly interacted with 35 139 people.Faith Based SectorThe sector is composed of religious organizations that mobilize churches across the province. The sector draws its componentsfrom the Christian and Indigenous African Churches. The Steering Committee is also composed of all faith representatives.The sector embarked on the following activities during the year under review.4 Steering Committee meetings, 68 stakeholder meetings were held during the year under review to plan 26 eventsand activities were held as follows:The sector participated in the Intersectoral Crime and <strong>Safety</strong> Campaign Launch in Hammanskraal from the 17th – 20th April<strong>2011</strong>;••Planned and organized together with South African Council of Churches (SACC) and the Premier’s office, the prayerfor peaceful election that took place on the 12th May <strong>2011</strong>, at the standard Bank Arena;••The Interdenominational prayer service was held on Sunday, June 5, 2001, at the Rhoda Yende Hall, in Sharpevilleas part of the Child Protection Week;••The Interdenominational Pentecost Commemoration service was held on Sunday, June 12, <strong>2011</strong>, at the New RobinsonChapel AME Church, in Tladi (Soweto);••The sector addressed an Awards Ceremony of the AME Church on the Take Charge Campaign and acknowledgedthe role of the Sectors held on the 11th August <strong>2011</strong>;••The sector conducted a seminar on the Crime Prevention and <strong>Safety</strong> Awareness for the African Spiritual Churches onSaturday, August 20, <strong>2011</strong>, at the Mogale City Municipality Conference room;••The sector conducted a seminar on crime prevention and safety awareness for the Spiritual/Independent Churches onSaturday, August 27, <strong>2011</strong> was held at the St. Emmanuel Apostolic Church in Mohlakeng;••A presentation on the Take Charge Campaign and substance abuse was made at the Conference of Church Youth heldat the Wilberforce Institute, in Evaton, on Friday, September 9, <strong>2011</strong>;••A workshop on substance use in schools was held on Thursday, September 22, <strong>2011</strong>, at the Jerry Moloi Library, inEtwatwa;••The sector participated in the SACC Ecumenical Indaba held on Thursday and Friday, August 25 and 26, <strong>2011</strong> todevelop an agenda for churches;••A presentation on the programmes of the department on the safety of women, especially Ikhaya Lethemba, the GreenDoors and the Victim Empowerment Centres, was delivered at the Dorcas Woman for Action - a Soweto church womenorganisation – during a prayer rally meeting held in Meadowlands, on September 15, <strong>2011</strong>;Programme 3: Crime Prevention and <strong>Community</strong> Police Relations • <strong>Annual</strong> <strong>Report</strong> <strong>2011</strong>/12 |69
••The sector facilitated the march of more than 300 learners from Etwatwa Secondary Schools who raised awarenessabout Alcohol and Drug Abuse, as well as delivered a Memorandum to the Station Commander of the Etwatwa PoliceStation;••The sector presented on the Take Charge Campaign at the Dewali Festival Prayers at Lenasia South Hindu Temple, onOctober 26, <strong>2011</strong>;••The sector participated in the Interfaith Prayer Service held at the Regina Mundi Catholic Church, in Soweto on the27th October <strong>2011</strong>;••Sector participated at the <strong>Annual</strong> Conference of the AME Church on November 11, <strong>2011</strong>, at the Naledi <strong>Community</strong>Hall (Soweto);••Sector created awareness about policing strategy in preventing crime in Meadowlands on November 20, <strong>2011</strong> ofthe local police who was killed on duty;••Sector coordinated Church Women marking the 16 Days of Activism of No Violence against Women and Childrenand commemoration of the World AIDS Days on December 1, <strong>2011</strong>, in Cloverdene;••Sector coordinated Churches praying for Road <strong>Safety</strong> during the Festive Season at the East Driefontein, in Carletonville,on December 15, <strong>2011</strong>;••The sector held two seminars on the use of taxis by African Independent Churches, in partnership with Ikhaya le Ziyoni,on December 13 and 20, <strong>2011</strong>, in Vosloorus and Soweto;••Sector coordinated the Take Charge presentation at the workshop hosted by Ikhaya Leziyoni at Ikwezi Primary School,in Mofolo (Soweto), on January 21, <strong>2012</strong>;••Sector coordinated Seminar on domestic violence on the February 14, <strong>2012</strong>, in Braamfontein;••A presentation on the programmes of the department on Crime Prevention was done at the AME Church Conferenceon February 16, <strong>2012</strong>, in Isando;••Workshop was conducted on Social Media Networks Crimes on February 23, <strong>2012</strong>, at the Maranatha ReformedChurch of Christ, in Khutsong Carltonville;••Conducted a workshop on women and children abuse on Tuesday, March 13, <strong>2012</strong>, at Sithabile Youth and ChildrenCentre, in Cloverdene;••Presented on the Green Doors at the AME Church conference held at the Cousin-Senatle Convention Centre, in Evaton,on March 16, <strong>2012</strong>; and,••Sector participated in a workshop facilitated by the Unleash Potential <strong>Community</strong> Project on March 18, <strong>2012</strong>, atLakeside Secondary School.The sector directly interacted with approximately 25307 people.Labour SectorThe Labour sector is composed by the three union federations that exist in the province. These are the Congress of SouthAfrican Trade Unions (COSATU), the National Council of Trade Unions (NACTU) and the Federation of Unions of SouthAfrica (FEDUSA). The sector also has a steering committee comprising representatives from all three federations. The sectorembarked on the following activities during the year.49 stakeholder meetings were held during the year under review to plan 42 awareness campaigns and activities whichtook place as follows:••The sector participated at the Soweto Educational Summit held on the 9 th April <strong>2011</strong> at the University of JohannesburgSoweto campus;••The sector conducted a Take Charge workshop on the 11 th April <strong>2011</strong> at Hammanskraal;••The sector participated and supported Wal Mart Film Festival coordinated by COSATU on the 13 th April <strong>2011</strong> atSoweto Ekhaya Centre Zone 4;••The sector distributed pamphlets on the 15 th April <strong>2011</strong> at the Johannesburg City Hall in an event organized byCOSATU. Purpose was to reach more workers on Take Charge Campaign and promote safety during the EasterHolidays;••The sector participated in an inter-sectoral Crime and <strong>Safety</strong> Campaign Launch in Hammanskraal from the 17 th – 20 thApril <strong>2011</strong>;••The sector participated in the COSATU May Day (workers day) event on the 1 st May <strong>2011</strong> at Masterpiece MuripeStadium in Atteridgeville;••A workshop was conducted with Truck Drivers on the 2 nd May <strong>2011</strong> at the Logistic Company;••The Labour Sector Steering Committee members attended the Child Protection Day on the 1 st June <strong>2011</strong> at StandardBank Arena organized by the Department Of <strong>Community</strong> <strong>Safety</strong>;••The sector coordinated the Anti-Children Abuse Campaign was held on the 3 rd June <strong>2011</strong> at Majaneng ward 76 inTemba (Tshwane region) to create awareness on the challenges children come across in their daily lives;70 | <strong>Annual</strong> <strong>Report</strong> <strong>2011</strong>/12 • Department of <strong>Community</strong> <strong>Safety</strong>
••The sector distributed School uniforms and gifts to the orphans and vulnerable children on the 10 th June <strong>2011</strong> at TsipiNoto Primary School (Etwatwa) as part of the Youth Month Programme;••The sector participated in a Youth Month Event organised by POPCRU on the 16 th June <strong>2011</strong> at Caiphus Nyokagrounds in Ekurhuleni;••The sector participated in Mandela Day event organized by COSATU on the 18 th July <strong>2011</strong>, in Vosloorus Home forthe Physically Challenged;••Crime Awareness Campaign was conducted in the Vereeniging Taxi Rank on the 19 th July <strong>2011</strong>;••Five School <strong>Safety</strong> Campaign Road Shows were held in four schools, learners and educators were reached on TakeCharge and road safety on 15 th August <strong>2011</strong> in Thabang Primary School Vosloorus, 16 th August <strong>2011</strong> DebruinPrimary School Katlehong, 17 th August <strong>2011</strong> Qalakasha Primary School Balfour and 19 th August <strong>2011</strong> BhekekayoPrimary School Olifantsfontein;••The sector held Anti Xenophobic game on the 31 st July <strong>2011</strong> in Sinaba Stadium. Wits University played the foreignersTeam;••COSATU Shop Stewards Council was held on the 15 th September <strong>2011</strong> at Johannesburg City Hall, organised byCOSATU for all its affiliates;••Sector coordinated Heritage Day event held on the 24 th September <strong>2011</strong> at Stompie Skosana Hall;••Take Charge and Anti Crime workshop was held on the 6 th August <strong>2011</strong> at Wattville Business Opportunity Centre;••The sector participated in the three days workshop in Birchwood Executive Hotels organised by SADTU EkurhuleniRegion from the 12 th - 14 th August <strong>2011</strong>;••Crime awareness workshop with domestic workers was held on the 22 nd September <strong>2011</strong> at Bedfordview MethodistChurch;••Ten workshops were held for domestic workers on Take Charge and Anti Xenophobia. 18 th August <strong>2011</strong> – twoworkshops were held with domestic workers in – Fourways Garden, The Club house Phase 2 Hermajesty , Douglasdale– Sandton Bible Church on the 24 th August <strong>2011</strong> ,Wendywood in Christ Church Sandton on the 24 th August <strong>2011</strong>,Limbro Park in Limbro Tennis Club on the 25 th August <strong>2011</strong> ,Gallo Manor in Gallo Manor <strong>Community</strong> Centre on 26 thAugust <strong>2011</strong>, GraighallPark in Wesleyan Church on the 26 th August <strong>2011</strong> ,Parkview in St. Colambus Church on the30 th August <strong>2011</strong>, Saxonworld in the War Museum on the 31 st August <strong>2011</strong>, Morningside on the 31 st August <strong>2011</strong>;••Labour sector participated in the SADTU provincial conference on the 22 nd to 24 th September <strong>2011</strong> at BirchwoodExecutive Hotels;••Take Charge workshop was held at Booysens Hotel on the 28 th to 30 th September <strong>2011</strong>;••The sector participated in the launch of the SADC Decade of Action for Road <strong>Safety</strong>, in Centurion, on October 7,<strong>2011</strong>;••An Inter-sectoral Campaign to create awareness on safety of schools and children in Dobsonville was held on the 28 thJanuary <strong>2012</strong> at Umthombowolwazi <strong>Community</strong> Hall;••The sector participated in the Cosatu Shopsteward Council held on the 31 st January <strong>2012</strong>;••Take Charge workshop was held with Benoni Taxi Association on the 21 st February <strong>2012</strong>;••A crime awareness campaign workshop with workers was held on the 25th February <strong>2012</strong> at COSATU NationalOffices; and,••International Women’s Day Celebration was held on the 23rd March <strong>2012</strong> at COSATU Provincial Offices in JHB.The sector directly interacted with 53071 people.Internal CommunicationDuring the year under review the unit intensified the internal communication strategy to empower and encourage fullparticipation of <strong>Safety</strong> Ambassadors in the departmental activities and programmes. About 130 safety internal messagesand announcements were circulated to staff from Human Resource management campaigns to all departmental events andactivities.DVD’s of focus months activities and messages were displayed on internal screens at the head office and <strong>Gauteng</strong> Trafficpolice officials were reached through Tetra radio broadcasting, whereby the Head of the Department encouraged andinformed them about activities and events of the department. <strong>Safety</strong> Ambassadors are always informed of activities andexhibitions conducted by the department.16 Internal campaigns and activities were conducted as follows:••5 HOD’s interaction with staff;••Year end function;••<strong>Safety</strong> Ambassador Campaign;••2 x HOD’s broadcast on tetra;••Circulated a holiday message from the HOD during the festive season;••6 Messages displayed on internal screens;••Road <strong>Safety</strong> messages;••Sports Recruitment Drive;Programme 3: Crime Prevention and <strong>Community</strong> Police Relations • <strong>Annual</strong> <strong>Report</strong> <strong>2011</strong>/12 |71
••Youth Month;••Know your neighbour campaign;••<strong>Safety</strong> Ambassador campaign; and,••16 Days of Activism.5 GPG corporate exhibitions were conducted as follows;••Departments of Economic Development and Education on the 3rd of February <strong>2012</strong>;••Departments of Education on the 3rd of February <strong>2012</strong>;••Department of Roads and Transport on the 17 February <strong>2012</strong>; and,••Sports, Arts and Culture on the 23 February <strong>2012</strong>.Sub-programme: Public Education and InformationPerformance Indicator Baseline (Actual Output) Actual performance against target Reason for variance2010/11 Target (<strong>2011</strong>/<strong>2012</strong>) Actual (<strong>2011</strong>/<strong>2012</strong>)Media monitoring andresearch conducted4 media monitoring reports 12 media monitoring reports 12 media monitoring reports Target met.Media writing done - 8 media writing done 8 media writing done Target met.Media engagementconducted- 12 media engagementsconducted19 media engagementsconductedTarget exceeded, more mediaopportunities were exploredand utilized.Frequency of servicemarketing29 times of servicemarketing35 times of servicemarketingTarget exceeded, moredepartmental activitieswere supported due to<strong>Safety</strong> Month activities andfree space were given byShopping Malls for Exhibition.Publications produced 8 publications produced 14 publications produced 5 publications produced Target not met because fewernewsletters were producedand the annual report was ledby the Office of the HOD.Outdoor advertising contractsconcluded1 outdoor advertising contractconcluded2 outdoor advertisingcontracts concluded1 outdoor advertising contractconcludedTarget not met, there wasa delay in rolling outdoor toother municipalities as theydid not have agreements withany service provider.Number of awarenesscampaigns held48 awareness campaignsheld68 awareness campaignsheld69 awareness campaignsheldTarget exceeded, moreKnow Your Neighborhoodcampaigns were launched incommunities.Number of sector campaignsheldNumber of internalcampaigns40 sector campaigns held 45 sector campaigns held 120 sector campaigns held Target exceeded, sectorsresponded more positivelyand had more events rolledout.12 internal campaigns held 12 internal campaigns held 26 internal campaigns held Target exceeded, morechannels were used tocommunicate with internalstaff, posters, safety internaland tetra broadcast.Changes to planned targets: No changes were made to planned targets.72 | <strong>Annual</strong> <strong>Report</strong> <strong>2011</strong>/12 • Department of <strong>Community</strong> <strong>Safety</strong>
Sub-programme: <strong>Community</strong> Police RelationsPurposeThe purpose of the Directorate: <strong>Community</strong> Police Relations is to promote good relations between the policeand communities.Strategic Objectives••To promote good relations between the police and communities;••To support <strong>Community</strong> Police Forums (CPFs) and Boards;••To mobilise hostel and business communities; and,••To sustain the community patroller programme.Performance indicators and targetsIn the year under review, the Directorate assessed all 137 CPFs to determine the extent to which they comply with theminimum standards set by the Directives and Guidelines developed by the Department. Due to an increase in the numberof campaigns initiated by CPFs, the Directorate exceeded its target on the support provided to such community structures.The Directorate was called upon to revive and or intervene in 168 CPFs that required conflict resolution and support toensure effective functioning of the structures. The Department provided CPFs with computers and trained 288 CPF membersin computer literacy. Induction sessions were held for 72 CPFs as there was a need to ensure that members understood theirroles and responsibilities. More business communities were mobilized in this financial year as they showed a great dealof interest in participating in crime prevention initiatives that would assist them. Rural <strong>Safety</strong> Plans were developed in threepolice station areas namely, Devon, Hammanskraal and Bronkhorstspruit. Patrollers were deployed at various sites in theprovince such as Cradle of Humankind (200), Dinokeng Game Reserve (100) and Metrorail sites (300), as part of a Tourist<strong>Safety</strong> Ambassadors programme as well as to provide much needed safety to commuters. In addition, 4 188 communitypatrollers were deployed at 396 schools in <strong>Gauteng</strong> as part of the school safety programme.Sub-programme: <strong>Community</strong> Police RelationsPerformance Indicator Baseline (Actual Output)Actual performance against target2010/11Target (<strong>2011</strong>/<strong>2012</strong>) Actual (<strong>2011</strong>/<strong>2012</strong>)Number of CPFs assessed 135 CPFs assessed annually 135 CPFs and 23 boards 137 CPFs and 23 boardsannuallyassessed annually assessed annuallyReason for varianceTarget exceeded, Due to thechallenges and interventionsdone on a constant basis,the Directorate had to doassessments on more thanone occasion for CPFs insome stations.Number of CPFs supported 135 CPFs supported 135 CPFs and 23 boardssupported173 CPFs and 23 boardssupportedThe target was exceededdue to increased requestsby active CPFs that heldcampaigns to address issuesof safety in their localities.Number of CPFs and boardmembers trained200 CPFs trained 200 CPFs and boardmembers trained288 CPFs and boardmembers trainedThe target was exceeded dueto the demand by CPFs fora computer literacy trainingprogramme.Number of CPF publicmeetings conducted /supported134 public meetingsconducted /supported135 CPF public meetingsconducted /supported130 CPF public meetingsconducted /supportedThe target was not metdue to the challenge ofmobilising communities insuburbs where they prefer tocommunicate through e-mailsand the security companiesfora.Programme 3: Crime Prevention and <strong>Community</strong> Police Relations • <strong>Annual</strong> <strong>Report</strong> <strong>2011</strong>/12 |73
Sub-programme: <strong>Community</strong> Police RelationsPerformance IndicatorBaseline (Actual Output)Actual performance against targetReason for variance2010/11Target (<strong>2011</strong>/<strong>2012</strong>) Actual (<strong>2011</strong>/<strong>2012</strong>)Number of induction sessionsconducted55 induction sessionsconducted38 induction sessionsconducted72 induction sessionsconductedTarget was exceeded due tothe need by CPFs to ensurethat they understand theirroles and responsibilities.Hostel communities mobilized 34 hostels POA supported 35 hostels POA supported 2 hostels POA supported Target not met. Dueto political challengesexperienced by the hostelleadership, it was difficult toengage hostel communitiesand implement a POA.- 50 hostel Izindunas trained 0 Target not met. Dueto political challengesexperienced by the hostelleadership, it was difficult toengage hostel communitiesand implement a POA, whichincludes training.Number of businesscommunities mobilised26 business communitiesmobilised22 business communitiesmobilised26 business communitiesmobilisedTarget exceeded, morebusiness communities wereon board to participate incrime prevention initiatives.Patrollers resourced in 112precincts107 patrollers resourced in112 precincts4020 patrollers resourced in112 precincts59 patrollers resourced in112 precinctsTarget not met. The processof distribution of resourcingwas interrupted by thedeployment of patrollers inschools.Number of precincts wherepatrollers are to be recruited- 5 precincts where patrollersare to be recruited7 precincts where patrollersare to be recruitedThe target was exceededdue to the demand for thepatroller programme insuburbs.Number of precincts wherepatrollers are inducted107 precincts wherepatrollers are inducted112 precincts where 250patrollers are inducted48 precincts where patrollersare inductedTarget not met. The processof induction sessionswas interrupted by thedeployment of patrollers inschools.Number of patrollers trained - 1000 precincts wherepatrollers are trained0 precincts where patrollerswere trainedTarget not met. The processof training was interrupted bythe deployment of patrollersin schools.Number of patroller groupsassessed107 patroller groupsassessed112 patroller groupsassessed85 patroller groups assessed Target not met. Theprocess of assessmentwas interrupted by thedeployment of patrollers inschools.74 | <strong>Annual</strong> <strong>Report</strong> <strong>2011</strong>/12 • Department of <strong>Community</strong> <strong>Safety</strong>
Sub-programme: <strong>Community</strong> Police RelationsPerformance IndicatorNumber of patrollers intourist safety ambassadorsprogramme facilitatedBaseline (Actual Output)Actual performance against target2010/11Target (<strong>2011</strong>/<strong>2012</strong>) Actual (<strong>2011</strong>/<strong>2012</strong>)- 200 patrollers in tourist 303 patrollers deployed.safety ambassadors 200 patrollers deployedprogramme facilitated in Maropeng and 103in Dinokeng as safetyambassadorsReason for varianceTarget exceeded. Due to thegood work done by patrollersin Maropeng, there was ademand that the programmebe rolled out at DinokengGame Reserve.Number of patrollers deployedin schools participating inHlayiseka Programme20 patrollers in schoolsparticipated in HlayisekaProgramme120 patrollers in schoolsparticipated in HlayisekaProgramme132 patrollers in schoolsparticipated in HlayisekaProgrammeTarget exceeded due to theneed for more patrollers atother schools.Number of patrollers deployedin identified schools- 150 patrollers deployed in30 identified schools4188 patrollers deployed in130 identified schoolsThe Directorate exceeded thenumber due to the demandfor patrollers at severalschools.Number of local rural safetyplans developed (addedtarget)- 3 local rural safety plansdeveloped3 local rural safety plansdevelopedTarget met.Changes to planned targets: There was an additional target on the development of local rural safety plans which wasadded to the planned targets.Programme 3: Crime Prevention and <strong>Community</strong> Police Relations • <strong>Annual</strong> <strong>Report</strong> <strong>2011</strong>/12 |75
Programme 4: Traffic Management04“Reducing road fatalities.”
Programme 4: Traffic ManagementPurposeThe aim of this programme is to provide traffic law enforcement services for the province. These include Traffic Services, whichencompass law enforcement, community training, escorting of abnormal loads and testing of driving school instructors. TheTransport Inspectorate, which renders a law enforcement function to ensure safe, reliable and authorised public passengerroad transportation in terms of various public transport mandates and legislation, forms an integral part of the programme.Special Services is responsible for specialised patrol services, information management and inspections of driving licensetestingcentres, vehicle-testing stations and driving schools as well as providing a 24-hour communication service. The TrafficTraining College provides training to traffic officers, examiners of vehicles and examiners for driving licenses.The Department has agreed on two strategic objectives for this programme in keeping with the Executive Council-approvedRoad <strong>Safety</strong> Strategy, which, in essence, seeks to ensure that the programme contributes to a significant reduction in thenumber of road accidents and fatalities in the province. There are no changes to the budget structure of the programme.Strategic ObjectivesThe Chief Directorate: Traffic Management exercises its powers and performs its duties and functions in pursuit of thefollowing strategic objectives:••To render effective and efficient road traffic and crime prevention law enforcement; and,••To promote road traffic safety for all road users through education and training.Performance indicators and targetsImproved road user environmentThe road environment has been identified to be one of the contributory factors in road traffic accidents andfatalities. It is for this reason that the Traffic Management programme has elevated this aspect to become oneof its performance indicators. In order to give effect to this indicator, the Chief Directorate conducted 12 roadsafety inspections at various identified hazardous locations to enable the Department to record area-specificroad environment challenges with a view to developing appropriate multi-agency intervention plans. In thisregard, these inspections were conducted in the following areas:••R59;••Die Adelaar Secondary School;••R21 Freeway;••R24 Krugersdorp;••R511 from Diepsloot to Laudium;••N12 West Rand;••N17;••R564 West Christiaan De Wet;••R101;••R25 (Bronkhorstspruit);••N3 (between Spruitview and De Hoek Toll Plaza); and,••Brakfontein Interchange/Eufees road (N14 Freeway).During these audits, the following observations were made:Common Driver Offences••Unsafe following distance;••Learners walking unsafely on the road;••Overloaded and unsafe learner transport;••Insufficient points men;••Drag racing during weekends by motorcyclists (breakfast runs);••Motorists driving at an excessive speed, with most exceeding the 120 km/h speed limit;••Vehicles making illegal u-turns and crossing over painted islands;••Speed; and,••Failing to stop at a robot.Programme 4: Traffic Management • <strong>Annual</strong> <strong>Report</strong> <strong>2011</strong>/12 |77
Road engineering hazards••Faded road markings;••Sharp bands without danger plates or sharp curve chevrons;••No speed calming measures;••No visible boards indicating on-ramps; and,••Inadequate road signs.Pedestrian behaviourIt was discovered that pedestrians mostly jaywalk due to lack of proper pedestrian crossings. This, however, cannot be truefor inner-city jaywalking, where jaywalking still happens despite the availability of traffic lights at intersections.Improved vehicle fitnessIt has been widely established that unroadworthy vehicles significantly contribute towards road accidents and resultantfatalities. This fact has led to the programme conducting law enforcement operations to remove unroadworthy vehicles fromthe road. In this regard, the Department managed to stop and inspect 1 107 089 vehicles in order to determine vehicleand driver fitness. As a direct result of these operations, some vehicles were issued with warnings for minor defects andthey were directed to repair those defects. Other vehicles were issued with summonses for major defects. It is important tonote that vehicles that were found to be ferrying passengers without the necessary documents permitting them to do so wereimpounded and their drivers charged accordingly. Drivers who were found to be driving with false drivers licenses wereaccordingly arrested.Improved road user complianceRoad safety can be attained if motorists adhere to the rules of the road. The human factor has also been identified to beone of the contributory factors to road traffic fatalities and accidents and this is primarily caused by lack of adherence to therules of the road. Part of the problem in relation to adherence to the rules of the road is lack of compliance by pedestrians.During the reporting period, the Chief Directorate placed emphasis on operations aimed at removing pedestrians from theroad as they account for over 40% of the total number of fatalities each year.In this regard, the Chief Directorate conducted 1105 such operations which were largely conducted on freeways andhighways. Over and above this, these operations sought to prevent pedestrians from jaywalking. To this end, over 400pedestrians were arrested for various offences ranging from being on foot on the freeways and jaywalking.A zero-tolerance approach towards certain road traffic offencesIt is common cause that certain road traffic offences are more serious than others. The Chief Directorate decided to classifysome of the more serious offences as those requiring no tolerance. In this regard, drunken driving, excessive speedingand reckless and negligent driving are offences on which the Department has adopted a zero-tolerance approach. A totalof 10 588 law enforcement operations targeting these offences were executed during the period under review. Of the1126 arrests effected during these targeted operations, 223 (19.8%) related to drunken driving, 561 (49.8%) to excessivespeeding and 342 (30.3%) to reckless and negligent driving.Overload controlIt is important to enforce laws pertaining to load control. Overloaded vehicles cause considerable damage to road surfaceand this leads to accidents and fatalities. In the period under review, the Chief Directorate directed a total of 198 064 heavymotor vehicles to Traffic Control Centers in the province where they were screened and weighed for overloading. Throughthese operations, vehicles which were found to be overloaded were charged accordingly.Crime prevention operations conductedIn executing its crime prevention mandate, the Chief Directorate conducted 2 420 crime prevention operations during thereporting period. The primary focus of the Chief Directorate in this regard was on the recovery of stolen and hijacked trucksgiven the impact of the losses of the consignments carried by these trucks on the provincial economy. The Anti-truck HijackingUnit was instrumental in this regard. In addition, the Chief Directorate, through the Special Law Enforcement Unit, targetedthe recovery of stolen/hijacked light motor vehicles, with the unit succeeding in recovering about 200 vehicles.Improved stakeholder coordinationThe reduction of road fatalities cannot be achieved without the involvement of relevant stakeholders. For purposes of lawenforcement coordination, the Chief Directorate convened four Traffic Management <strong>Gauteng</strong> (TMG) meetings. Through thisstructure, the Chief Directorate plans, organises and executes joint law enforcement operations.78 | <strong>Annual</strong> <strong>Report</strong> <strong>2011</strong>/12 • Department of <strong>Community</strong> <strong>Safety</strong>
The primary focus of this structure during the reporting period was on law enforcement operations targeting the Easter andFestive Season periods as these account for an upsurge in the number of fatalities. Furthermore, the TMG facilitated theexecution of special operations, which focused on drunken driving and reckless and negligent driving as it related to learnertransport vehicles.In addition, the Chief Directorate convened meetings with stakeholders in the taxi industry as part of its responsibility to curbtaxi conflict and violence in the province. Due to the sporadic nature of conflict situations, it has proven difficult to project thenumber of mediations that were going to be necessary during any given period. The Department experienced an increasein conflict situations during the reporting period. Some of these conflicts, unfortunately, led to the loss of lives. In this regard,the Chief Directorate conducted 35 such meetings in order to mediate and conciliate taxi conflict.Road safety educationOne of the key pillars of the Road <strong>Safety</strong> Strategy is education. This pillar is premised on the idea that law enforcementon its own is not sufficient to change driver behaviour and attitude. It is for this reason that law enforcement needs to becomplemented by education in order to change road user behaviour. In this regard, 412 road safety awareness campaignswere conducted. Through these campaigns various community members were targeted to teach them about safe road usageas well as to raise awareness on road safety tips.Awareness campaigns were conducted in some of the following areas, namely: Moshoeshoe Road (Mandela Squire),Thabong Shopping Centre), Golden Highway (Palm Springs, Evaton West, Beverly Hills Sonderwater, Welgevonden,Pololokong, Mandela Square, Boitumelo, Waterdaal, Buccleuch Easter launch, Lakeside Mall, Germiston Taxi Rank,Daveyton Taxi Rank, Way Bridge (TCC), R21 Olifantsfontein, Golden Walk, Daveyton Mall, Somhlolo Taxi Rank, N3exhibition, Nasrec Offramp, Diepkloof Park, Rand Show, Vosloorus (Chris Hani Mall), Kingsway, Duduza Rank, Germiston,Tsakane Mall, Brakpan Station, Germiston Station, Rondebult, Wolfe Informal settlement, Phumlani Mall, Winnie Mandela,Ivory Park Informal settlement, Isipho sethu LSEN. Dukathole Informal settlement, Ratanda Sports ground, Benoni Station,Phumlani Mall, Lakeside Taxi Rank, Ratanda Primary, Sithokomele Primary, Qhaqhulla Primary, Chris Hani Taxi Rank, WolfInformal Settlement, N3 Road Block, Festival Mall, Kopanong shopping centre (Hammanskraal), Renbro Spar, WalmansthalN1, N1 Zambesi, Buccleuch, R101(Hammanskraal), Diepkloof interchange, Hammanskraal: Dinokeng, Kekana Gardens,Atterigdeville: Mbolekwa Stadium, Hammanskraal: Police Station, Garankuwa Court, Old Age Walk, Ga-rankuwaSports Ground, Thorn tree Plaza, Moloto Road, Benoni: Heidelberg TCC, Ciomerz sand, Hammanskraal: Jubilee Mall,HATO Taxi organization, Diepsloot, Soshanguve: Block XX, Bara taxi, Southgate taxi, Diepkloof taxi, Randfontein taxi,Mohlakeng, Muldersdrift, Kagiso, Lanseria, Pinehaven, Muldersdrift, Zwartkops, Video informal settlement, Lanseria, ThaboMbeki, Randfontein taxi, Heidelberg, N14 Ventersdorp, Krugersdorp road, R512 Lanseria informal settlement, BuccleuchInterchange, Mandela Square, Boitumelo, Waterdaal, Lochvaal, R59 (Meyerton, Sicelo Shiceka), Redan, Daleside, GoldenHighway, Bophelong, Muvhango, Kanana, Moshoeshoe Road, Rothdene, Lenz railway station, Petroport N12 West,Naturena, Klipspruit, Vlakfontein, Kagiso, Merafong Taxi rank, Khutsong, Westonaria, N12 Lenasia, N3 Berry Marais, IvoryPark informal settlement, Winnie Mandela informal settlement, Ramaphosa informal settlement, Holomisa Informal settlement,Vosloorus, Vilalisa informal settlement, Thokoza, Natalspruit hospital, Tshepisong, Refilwe, Kanana, Thabong ShoppingCentre, Golden Highway (Palm Springs), Evaton West, Beverly Hills, Actonville, R23, Van Dyk Road and Rynsoord,Bekkersdal centre, Simunye, Honeydew, Randburg, Eldorado Park, Zuurbekom, Zandspruit, De hoek, Fochville, Diepkloofcamp, Ellis Park stadium, Dries Niemandt, Supersport Park, Soccer City, Loftus stadium, N3 Heidelberg, Nelson MandelaBridge, Charity and Faith Mission Church, Grace Bible in Garankuwa, Grace Bible Church in Soweto, Bapsfontein informalsettlement, Bapsfontein primary school, Katlehong, Daveyton taxi rank and mall, Thembisa informal settlement, Kemptonparkpolice station, N3 Kliprivier, Overkruin, Kwathema score, Fordsburg stadium, Angelo squatter camp, Maryfitzgerald Square,Thabatswane, Lindela, Noord taxi rank, Tamboville, Primose Centre in Roodepoort and Thabo Mbeki informal Settlement.Road safety schools educational programmeDuring the period under review, the Chief Directorate conducted educational programmes in several schools acrossthe province. Presentations for high school learners were conducted in the following school, namely: Kenneth Masikelahigh, Dinoto, Masithwalisane, Ekangala High, The Way Christian school, Modiri high, Sutherland high, Wierda park,Thuthuzelekani high, Randfontein high, Ithutheni high, Ladirile high, Mfundo Secondary, Lodirile secondary, Mabuya HighSchool, Phomolong High School, Maboya secondary school, Nick Mpshe high, Winterveldt High, Thuto-Tiro high school,General Smuts High school, Lebohang high school, Ferndale high, Greenwold high, Lorensia high School, Cosmo Cityhigh, Steve Tshwete High, Tswaing Secondary School, Almont Technical High School, Phomolong High School, HansKekana Secondary school, Norkempark, Lettlotlo, Setlalentoa, Asser Maloka, Lesiba and General Smuts High School.Programme 4: Traffic Management • <strong>Annual</strong> <strong>Report</strong> <strong>2011</strong>/12 |79
Child in Traffic presentations were conducted in some of the following areas, namely: Petunia Moon, Lebohang Pre-School, Delville Crèche, Goedhope Creche, Tsakane Educare, Mpumelelo day care, Tjokkerpjie Creche, LesediBathabile, Thagalang, Adonia Tsakane Progress, Itumeleng, Morning Star, Germiston Educare, Itireleng day care, HappyKideo (Bronkhorstspruit), Bambi pre –school (Wierdapark), Boikanyo Primary School (Garankuwa), Little toes day care(Garankuwa), Maropeng Primary School, Oleseng day care (Garankuwa), Modisa – Bana day care, St Joseph Kulane,Leratong e.l.c, Mampephu e.l.c, Refilwe Crèche, Kabelo e.l.c, Tiisano day care, Keagile day care, Sibongile e.l.c, Vernaday care, Valhalla day care, Mina Moo Nursery School, Mokonyama primary, Kokotla Primary, Motjibosane Primary,Jabulani Primary, Phenyo, Kamogelo, Kekana Gardens crèche, Ekangala: Sihluziwe primary school, Walter Sisulu, Seroto-Matshetla, Milton, Kutumela Molefi, Gontse primary school, Ikokobetseng primary, Phahamang primary, Seeiso Primary,Ikokobetseng primary, 3M GDE training session, Buhle Nursary school, Ikhaya Le Bantwana, Cosmo City primary school,Caroline crèche, Bumpa day care and Tarlton preschool.Road traffic trainingThe Boekenhoutkloof Traffic College presented 2 basic traffic officers training courses and also presented 5 courses on theExaminers of Vehicles and 6 Courses on the Examiners of Drivers Licenses.Programme: Traffic ManagementPerformance Indicator Baseline (Actual Output)2010/11Improved road user environment 12 road safety inspectionsconducted0 executive traffstats meetingsconducted.Actual performance against targetTarget (<strong>2011</strong>/<strong>2012</strong>) Actual (<strong>2011</strong>/<strong>2012</strong>)12 road safety inspections 12 road safety Inspectionsconducted4 traffstats executive meetings 0 traffstats executive meetingsconducted.Reason for varianceTarget met.Target not met due toreprioritization of the focus.12 monthly reports on capturedaccident report forms12 monthly reports on capturedaccident report forms12 monthly reports on capturedaccident report formsTarget met.Improved vehicle fitness1 278 516 vehicles stopped andinspected systematically1 200 000 vehicles stopped andinspected systematically1 107 089 vehicles stopped andinspectedThe target was not met becausethe formula of determiningthis target is based on thenumber of traffic officers.Therefore, the target wasnot met as the Departmentexperienced a significant numberof resignations, deaths andsuspensions during the yearunder review.80 | <strong>Annual</strong> <strong>Report</strong> <strong>2011</strong>/12 • Department of <strong>Community</strong> <strong>Safety</strong>
Programme: Traffic ManagementPerformance Indicator Baseline (Actual Output)Actual performance against target2010/11Target (<strong>2011</strong>/<strong>2012</strong>) Actual (<strong>2011</strong>/<strong>2012</strong>)Road traffic training conducted 13 Courses presented 2 Basic Traffic Officers Training 2 Basic Traffic Officers TrainingCourse conductedCourse conductedReason for varianceTarget met.5 Courses on Examiner ofvehicles conducted (Enrolmentdependent on RTMCrequirements)4 Courses on Examiner ofDrivers Licenses conducted5 Course on Examiner ofVehicles conducted4 for Examiner of Drivers LicenseCourse presentedTarget met.Target met.Changes to planned targets: No changes were made to the planned target.82 | <strong>Annual</strong> <strong>Report</strong> <strong>2011</strong>/12 • Department of <strong>Community</strong> <strong>Safety</strong>
Programme 4: Traffic Management • <strong>Annual</strong> <strong>Report</strong> <strong>2011</strong>/12 |83
03ANNUAL FINANCIAL STATEMENTSFOR DEPARTMENT OF COMMUNITY SAFETY“Financial statements, annual performance report andcompliance with laws and regulations.”84 | <strong>Annual</strong> <strong>Report</strong> <strong>2011</strong>/12 • Department of <strong>Community</strong> <strong>Safety</strong>
3. ANNUAL FINANCIAL STATEMENTSTable of Contents<strong>Report</strong> of the Audit Committee 86<strong>Report</strong> of the Accounting Officer 88<strong>Report</strong> of the Auditor-General 97Appropriation Statement 100Notes to the Appropriation Statement 113Statement of Financial Performance 115Statement of Financial Position 116Cash Flow Statement 117Accounting policies 119Notes to the <strong>Annual</strong> Financial Statements 123Disclosures Notes to the <strong>Annual</strong> Financial Statements 134Annexures 142<strong>Annual</strong> Financial Statements • <strong>Annual</strong> <strong>Report</strong> <strong>2011</strong>/12 |85
REPORT OF THE AUDIT COMMITTEE - VOTE 8for the year ended 31 March <strong>2012</strong>We are pleased to present our report for the financial year ended 31 March <strong>2012</strong>The Audit Committee consists of the external members listed hereunder and is required to meet a minimum of at least threetimes per annum as per provisions of the Public Finance Management Act (PFMA). In terms of the approved Terms ofReference (GPG Audit Committee Charter), five meetings were held during the current year, i.e.3 meetings for QuarterlyPerformance <strong>Report</strong>ing (financial and non-financial) and two meetings to review and discuss the <strong>Annual</strong> Financial Statementsand the Auditor General <strong>Report</strong>.Name of MemberNumber of Meetings AttendedIshwar Ramdas (Chairperson) 04Clive Kneale (Member) 05Nontobeko Ntsinde (Member) 04Executive MembersIn terms of the GPG Audit Committee Charter, the Officials listed hereunder are obliged to attend the meetings of the AuditCommittee:Compulsory AttendeesNumber of Meetings AttendedMongezi Tshongweni (Head of Department) 03Vuyani Nobongoza (Chief Financial Officer) 05Jabulile Tshabalala (Acting Chief Risk Officer) 02The Audit Committee noted that the Head of Department did not attend one meeting. However a Letter of apology wastendered with a duly authorised representative attending on his behalf. Therefore, the Audit Committee is satisfied that theDepartment adhered to the provisions of the GPG Audit Committee Charter.The members of the Audit Committee met with the senior management of the Department and Internal Audit, collectivelyto address risks and challenges facing the Departments. A number of in-committee meetings were held to address controlweaknesses and conflicts with the Department.Audit Committee ResponsibilityThe Audit Committee reports that it has complied with its responsibilities arising from section 38 (1) (a) of the PFMA andTreasury Regulation 3.1.13. The Audit Committee also reports that it has adopted appropriate formal terms of reference asits Audit Committee Charter, has regulated its affairs in compliance with this Charter and has discharged all its responsibilitiesas contained therein.The effectiveness of internal controlThe Audit Committee has observed that the overall control environment has continued to improve during the year underreview. However, there are still some concerns with the level of internal controls within the Department where evidence oflapses of effective monitoring and enforcement by management were observed.During the year under review, several deficiencies in the system of internal control and deviations were reported by theAuditor-General South Africa. In certain instances, the matters reported previously have not been fully and satisfactorilyaddressed.The quality of in year management and monthly / quarterly reports submitted in terms of the PFMA andthe Division of Revenue Act86 | <strong>Annual</strong> <strong>Report</strong> <strong>2011</strong>/12 • Department of <strong>Community</strong> <strong>Safety</strong>
REPORT OF THE AUDIT COMMITTEE - VOTE 8for the year ended 31 March <strong>2012</strong>The Audit Committee is satisfied with the content and quality of monthly and quarterly reports prepared and issued by theAccounting Officer of the Department during the year under review, in compliance with the statutory reporting framework.Evaluation of Financial StatementsThe Audit Committee has:••reviewed and discussed the audited <strong>Annual</strong> Financial Statements to be included in the <strong>Annual</strong> <strong>Report</strong>, with the Auditor-General and the Accounting Officer;••reviewed the Auditor-General’s management report and management’s response thereto;••reviewed the Department’s compliance with legal and regulatory provisions; and••reviewed significant adjustments resulting from the audit.The Audit Committee concurs with and accepts the Auditor-General’s conclusions on the <strong>Annual</strong> Financial Statements, andis of the opinion that the audited <strong>Annual</strong> Financial Statements be accepted and read together with the report of the Auditor-General.Internal AuditThe Audit Committee is satisfied that the Internal Audit plans addresses a clear alignment with the major risks, adequateinformation systems coverage, a good balance between different categories of audits, i.e. risk-based, mandatory,performance and follow-up audits and involvement and support by management of the plans.The Audit Committee has noted considerable improvement in the communication between the Executive Management, theAuditor General and the Internal Audit Function, which has strengthened the Corporate Governance initiatives.The Audit Committee wishes to stress that in order for the Internal Audit Function to operate at optimal level as expected by theAudit Committee, it requires more capacity and skills. This is being addressed and corrective action is being implemented.Risk ManagementThe Risk Management Committee reports to the Audit Committee on the Departments’ management of risk on a quarterlybasis. The Audit Committee is satisfied that the actual management of risk is receiving timely and sufficient attention.Forensic InvestigationsThe Audit Committee is not satisfied that the forensic investigations are properly reported with age-analysis of all reportedissues indicated. Details of results in respect of investigations conducted as a result of calls through the fraud hotline werenot provided to the Committee.One-on-One with the Accounting OfficerThe Audit Committee has met with the Accounting Officer for the Department to ensure that there are no unresolved issuesAuditor-General South AfricaThe Audit Committee has met with the Office of the Auditor-General South Africa to ensure that there are no unresolved issuesMr Ishwar RamdasChairperson of the Audit CommitteeDate: 06 August <strong>2012</strong>
REPORT OF THE ACCOUNTING OFFICER - VOTE 8for the year ended 31 March <strong>2012</strong>(As per the actual transcript of the audit committee report issued by the department’s Audit Committee)General review of the state of financial affairs1.1 Improvement of financial management in the department – appointment of CFOFor the financial year <strong>2011</strong>/12, the Department of <strong>Community</strong> <strong>Safety</strong> have embarked on a rigorous processof addressing the following key aspects of the Department, ie.••Corporate Governance••Financial Management and reporting••Asset Management••Implementation of Key controls to ensure efficient Financial operating systems within the Department••Development of an efficient Risk Management process in attending to various risks identified by both our internalauditors (GAS) and the Auditor General.1.2 Important policy decisions and strategic issues facing the department:Civilian SecretariatThe Civilian Secretariat for Police Service Act was assented to by the President on 16 May <strong>2012</strong> and came into effect on1 December <strong>2011</strong>. The department will require additional capacity to give effect to various provisions of the Act includingmonitoring the implementation of the Domestic Violence Act by the SAPS and monitoring the utilisation of the SAPS budget.The department has eighteen months to establish a Provincial Secretariat and this process has commenced in earnest. Forthe financial year <strong>2012</strong>\13 an amount of R3 million has been appropriated by Parliament.1.3 Key decisions made in the departmentTurnaround strategy of the training collegeIn keeping with the Cabinet Memorandum that was approved by the provincial Executive in transforming the BoekenhoutkloofTraffic College into a Centre of Excellence the Department has commenced with a process of upgrading the currentinfrastructure of the college, effecting repairs where necessary, procuring the necessary equipment and giving the Collegethe much needed facelift. This is work in progress that the Department will be prioritising in the coming financial year.National Coordination Results for Traffic OfficersThe implementation of the DPSA resolution for salary coordination of traffic officers had an adverse impact on the budget ofthe Department in that the budget of Programme 4 was significantly affected by effecting backlog overtime payments andpayment to other officers which was outstanding from the preceding year.Implementation of AARTOThe Implementation of the Administrative Adjudication of Road Traffic Offences Act (AARTO) remained a challenge for theyear under review in that the Service Level Agreement that is supposed to regulate the relationship between the Departmentand the Road Traffic Management Corporation has still not been finalised and this had a negative impact on the finalisationof key concerns of the Department.The RTMC has further requested provinces and other issuing authorities to bear the costs for the postage of registered mailof camera speed infringement notices as required by legislation. This is a major challenge for the Department as this wasnot budgeted for and presented huge financial implications.Additionally, the Department is further expected to upgrade its bandwidth in relation to the eNatis system and the costs areastronomical.88 | <strong>Annual</strong> <strong>Report</strong> <strong>2011</strong>/12 • Department of <strong>Community</strong> <strong>Safety</strong>
REPORT OF THE ACCOUNTING OFFICER - VOTE 8for the year ended 31 March <strong>2012</strong>1.4 Major projects undertaken or completed during the yearPatroller ProgrammeOver the past four (4) financial years, the Department of <strong>Community</strong> <strong>Safety</strong> introduced a Patroller Program with a viewof mobilizing <strong>Gauteng</strong> communities to assist the police in the fight against crime. In terms of the program, patrollers aredeployed in various key strategic areas of the <strong>Gauteng</strong> Provincial Government precinct to monitor possible crime andcriminal activities in the area. The program is well established as a brand which enjoys community support and it prides itselfwith volunteers throughout the province trained amongst others to provide security functions.As part of improving level of education in our schools, the <strong>Gauteng</strong> Department of Education (GDE) has in the past fewyears recognized a need to introduce technology in schools as part of enhancing and deepening learner education. This ledto implementation of the <strong>Gauteng</strong> <strong>Online</strong> Project which facilitated installation of computers systems in most of the <strong>Gauteng</strong>schools. This move was greatly welcomed by communities of <strong>Gauteng</strong> given its apparent benefits.The Department of Education understood the security risk associated with this project and decided to introduce securityguards at school premises in their attempt to mitigate this challenge. Over the years, this approach has not succeeded inaddressing the identified challenge, instead the <strong>Gauteng</strong> Province continue to register high incidents of vandalism and theftof computers/equipment in school premises. This security gap remained a challenge for the provincial government as itundermines limited financial resources and a need to expand the program to all schools of the <strong>Gauteng</strong> Province.Therefore, the Department of <strong>Community</strong> <strong>Safety</strong> jointly with its counterpart, Department of Education, as part of Job CreationProgramme, took a decision to deploy the patrollers in schools to deal with challenges as identified above. As a result of thisinitiative, estimates of approximately 4 188 patrollers are deployed in 398 schools throughout the province. However, theprogram has been having a series of challenges. Some of the challenges include payment of patrollers, deployment process,and the conduct of patrollers as well as resources. It must be stated that processes are in place to address such challenges.Patrollers are also deployed as Tourist <strong>Safety</strong> Ambassadors at the Cradle of Humankind and Dinokeng Game Reserve. 300Patrollers were identified and trained for deployment at Metrorail sites.1.5 Spending trendsThe department’s spending trends are as follows:Year Main Appropriation R’000 Adjusted AppropriationR’000Actual Amount SpentR’000(Over)/UnderExpenditure R’0002009/10 345 475 347 483 368 659 (21 176)2010/11 369 940 374 397 381 538 (7 141)<strong>2011</strong>/12 423 747 423 747 400 622 23 1251.6 Reasons for under-spendingThe departmental expenditure trends for the financial year <strong>2011</strong>/12 can be analysed as follows:-••Compensation of Employees - R 6, 696 millionSavings were realised as a result of vacant positions not being filled during the financial year.••Goods and Services - R 16, 429 millionAn amount of R 6, 575 million allocated to the Close Circuit Television project was not spend as a result of challengesexperienced during the procurement processes for implementation of this project. Furthermore G-fleet experienced systemchallenges to process the G-fleet invoices for February <strong>2011</strong> and March <strong>2011</strong>.
REPORT OF THE ACCOUNTING OFFICER - VOTE 8for the year ended 31 March <strong>2012</strong>When the interface takes place it immediately increase expenditure in the accounting records of the department. Theaverage monthly amount the department pays to G-fleet is R 4, 784 million.••The department incurred irregular expenditure amounting to R 6,398 millionAs you are aware the Department of <strong>Community</strong> <strong>Safety</strong> is on daily basis interacting with the <strong>Community</strong>, Law EnforcementAgencies and any other stakeholder to achieve safe and secured <strong>Gauteng</strong> Province.Reference is made to procurement of goods and services, namely;••Period or duration of tender was extended; and••Payment of patrollers through section 21 entity though not registered by Provincial TreasuryAs a result of that due to the nature of some activities prompt response / or immediate attention is required to ensure servicedelivery. To the best of our ability, the Department has responded within the prescribed of good governance on such matterswithin our mandate. Going forward, the Department will exercise utmost precaution and due care to avoid such occurrencein the current and future financial years.1.7 VirementThe virements of the financial year under review:Virement From:Programme no. & name Item (level 3) Virements (negativeno.)Virement To:Programme no. & name Item (level 3) Virements (positiveno.)Programme 1 : Managementand AdministrationProgramme 2 : CivilianOversightProgramme 2 : CivilianOversightProgramme 3 : CrimePrevention and <strong>Community</strong>Police RelationsProgramme 4 : TrafficManagementProgramme 4 : TrafficManagementProgramme 4 : TrafficManagementProgramme 4 : TrafficManagementProgramme 4 : TrafficManagementGoods and services (997) Programme 3 : Crime Preventionand <strong>Community</strong> Police RelationsGoods and services (276) Programme 3 : Crime Preventionand <strong>Community</strong> Police RelationsGoods and services (425) Programme 3 : Crime Preventionand <strong>Community</strong> Police RelationsCompensation ofEmployees(4 894) Programme 4 : TrafficManagementGoods and services (2 073) Programme 3 : Crime Preventionand <strong>Community</strong> Police RelationsGoods and services (82) Programme 3 : Crime Preventionand <strong>Community</strong> Police RelationsGoods and services (118) Programme 3 : Crime Preventionand <strong>Community</strong> Police RelationsGoods and services (16) Programme 1 : Management andAdministrationGoods and services (45) Programme 3 : Crime Preventionand <strong>Community</strong> Police RelationsGoods and services 997Interest and Rent on276LandGoods and services 425Compensation ofEmployees4 894Goods and services 2 073Transfers and Subsidies 82Payments for FinancialAssetsPayments for capitalassetsPayments for capitalassetsGrand Total ( 8 926) Grand Total 8 9261181645Service rendered by the department••Whereas the detail of the service delivery environment for the Department was referred to elsewhere in the report, itis important that I mention, as Accounting Officer, that the key service delivery areas of the Department have includedthe following aspects during the reporting period:••The promotion of good relations between the police and the communities they police. In this regard, the primary focuswas on the strengthening of CPFs and the <strong>Community</strong> Police Boards established in terms of the SAPS Act.90 | <strong>Annual</strong> <strong>Report</strong> <strong>2011</strong>/12 • Department of <strong>Community</strong> <strong>Safety</strong>
REPORT OF THE ACCOUNTING OFFICER - VOTE 8for the year ended 31 March <strong>2012</strong>••Know-Your-Neighbourhood Campaign, which is informed by the belief held by the Department that all members of thecommunities in the province need to be encouraged to know who their neighbours are as part of the provincial arsenalin the battle against crime and lawlessness;••The fight against the abuse of alcohol, drugs and other dependence-producing substances contributing to theperpetration of serious and violent crimes in the province;••The policing and management of public demonstrations and protest marches, which seeks to ensure adherence withthe provisions of section 17 of the Constitution of the Republic of South Africa, 1996; and,••The reduction in the number of road accidents and fatalities in support of the “Decade of Action for Road <strong>Safety</strong>”.2.2 Tariff policyAll Enforcement agencies utilise the National Road Traffic Act of 1996 in determining the traffic offence tariffs and theNational Traffic Act.Tariffs for road traffic offencesThese tariffs are charged in accordance with schedule 3 of the Administrative Adjudication of Road Traffic Offences ActNo. 46 of 1998.Tariffs for the training provided by the Boekenhoutkloof Traffic College are determined in consultation with the ProvincialTreasury. Increases in the fees were applicable from the 17th January <strong>2011</strong>.The increases were approved in terms of the law by the Provincial Treasury.Description Tariff Period AmountAmountJanuary <strong>2011</strong> – December<strong>2011</strong>January <strong>2012</strong> – December<strong>2012</strong>Course Fees R RTraffic Officers Twelve Months 23 312.00 25 680Examiners of Vehicles Twelve Months 13 496.00 14 850Examiners of Driving Licences Twelve Months 16 359.00 17 995Boarding / Accommodation FeesTraffic Officers Twelve Months 25 520.00 27 846Examiners of Vehicles Twelve Months 4 663.00 5 150Examiners of Driving Licences Twelve Months 5 726.00 6 300Undercover parking Monthly 30.00 30.00The College runs a 12 months Basic Traffic Officer’s Diploma and the course fee structure is aligned to this course duration.The course was previously run over a 6 months period however the National Road Traffic Act, Act 93 of 1996 provides forthe RTMC to coordinate all training in the country. Consequently, the above-stated courses are registered with the RTMCand in this regard the duration and course dates are duly prescribed by the RTMC. The RTMC in consultation with LGSETAreviewed the Basic Traffic Officers course in line with new training requirements which is unit standard based. This newmethod was introduced during January <strong>2011</strong>.2.3 InventoriesRefer to <strong>Annual</strong> Financial Statement Annexure (6)Capacity constraintsFor the year under review, the department continued to deliver on its POA concerning provincial and road safetystrategies.
REPORT OF THE ACCOUNTING OFFICER - VOTE 8for the year ended 31 March <strong>2012</strong>Organisations to whom transfer payments have been madeThe expenditure on Transfers and Subsidies relates to payments of insurance of Patrollers to ABSA Insurance and Financialadvisors (PTY) LTD and the payment of Workmen’s Compensation as a result of Injury on Duty. Refer to the <strong>Annual</strong> FinancialStatement Annexure (1E and IH respectively).Corporate governance arrangements5.1 Risk management approachThe risk unit ensured monthly reporting and was monitored through Risk Committee meetings, chaired by the acting CFO.Monitoring of action plans to audit findings were done on a monthly basis. All Chief Directorates were involved in the globalrisk assessment of the department, where strategic risks were identified for the financial year. The units reported monthly tothe Risk Committee on the progress of implementation plans developed to address internal audit findings as well as progresson Auditor-General findings and recommendations. This ensured that risks identified were controlled and did not hamperservice delivery.5.2 Effectiveness of internal audit and audit committeeThe department attended all four Audit Committee meetings. These meetings were chaired by a member from outside thepublic sector and included one representative of civil society. Both financial and non-financial performance was discussed.The Audit Committee provides valuable support and plays an oversight role in relation to financial management, corporategovernance and risk management.The Department of Finance’s <strong>Gauteng</strong> Audit Service (GAS) is designed to add value and improve departmental operations.GAS has been fully operational during the financial year under review and assisted in evaluating and improving theeffectiveness of the department’s internal controls, management and governance processes. Recommendations by GAS onaudit findings were implemented. The following categories of audits were conducted by GAS during the financial year:Category 1: Risk and compliance auditFinancial ManagementThe scope of the Audit will entail the following internal control components, namely:-••Reviewing the governance structure i.e. positioning; ethical values; integrity and competency of management and staffof the Budget Management Unit to ensure the achievement of departmental objectives;••Review compliance with relevant acts, regulations, policies and procedures; and,••Reviewing the manner in which authority and responsibility is assigned to ensure accountability (i.e. delegation ofauthority);Supply Chain ManagementThe scope of the audit entails the following, namely:-••Determining the status of implementation with respect to the action plans made in the SCM report issued in 2010/<strong>2011</strong>financial year and to report such status to management;••To assess the impact of recommendations and actions implemented by management in mitigating the identified risks;and,••To obtain revised implementation dates and management comments where applicable.Traffic Management/Implementation of Road <strong>Safety</strong> StrategyThe scope of the audit was based on a review of the following internal control components namely:-••Processes and systems in place to eliminate fraud and corruption within the Law Enforcement Agencies;••The National Road <strong>Safety</strong> Strategy informs the Provincial Road <strong>Safety</strong> Strategy; and,••Compliance with relevant acts, regulations, policies and procedures.92 | <strong>Annual</strong> <strong>Report</strong> <strong>2011</strong>/12 • Department of <strong>Community</strong> <strong>Safety</strong>
REPORT OF THE ACCOUNTING OFFICER - VOTE 8for the year ended 31 March <strong>2012</strong>Follow Up Audit on AG findingsThe objective of the follow up audit was to ascertain that appropriate action was taken by management to address thereported AG findings as well as the timeliness thereof, to evaluate the adequacy and effectiveness of the system of internalcontrols to ensure achievement of Departmental objectives. Areas covered were as follows:-••Reviewed systems in place to action findings raised by the Auditor General (AG);••Reviewed the status of implementation of the action plans agreed on findings raised in the A-G’s Management reportissued on 29 July <strong>2011</strong>; and,••Obtained relevant evidence to ensure that the agreed action plans were implemented by the management.Risk Management and Corporate GovernanceThe scope of the audit encompassed the five internal control components as follows:-••Review of the alignment of the Department strategic objectives to the overall GPG objectives;••Review the alignment of Strategic plan to the organisational structure;••Compliance with PFMA, TR, King III on Corporate Governance, other legislations; policies and procedures, directivesor/and circulars;••Review of the existence of structures and committees across the Departments and their function thereof in compliancewith PFMA; TR and applicable charters or rules governing such structures;••Review of the formal code of conduct; (review availability avenues for people to confidentiality reports alleged violationsof the code of conduct, policies, and other acts of misconduct);and,••Review and ascertain the existence of the delegation of authority and responsibilities.Category 2: Performance auditAudit on Performance InformationThe objective of the audit was as follows:-••Policies, acts, regulations, systems and procedures;••Strategic, annual performance and operational planning processes;••Control environment, risk management and control activities relating to performance information;••Communication, monitoring and evaluation; and,••Performance management process.Category 3: Computer auditReview of IT OperationsThe audit scope was as follows, namely:-••IT Strategy and direction;••General organisation and management;••System development;••IT policies; procedures and standards;••Business unit structures;••The physical environment in which the computer system operates;••Operation and management of computer facilities;••Security system level;••Segregation of duties;••User account management;••Change management;••Problem management;••Assets management; and,••Service Level Agreement.Trafman application controls reviewThe scope of audit was based on the control environment for Trafman application within the department. Policies andprocedures as well as the operating environment and security for the system.
REPORT OF THE ACCOUNTING OFFICER - VOTE 8for the year ended 31 March <strong>2012</strong>Code of ConductThe department makes use of the Public Service Code of Conduct as the base to guide the behaviour and conduct ofemployees. The code of conduct is presented at all induction sessions for newly appointed employees of the department.All senior managers submitted their Declaration of Interest forms to the office of the Public Service Commission. In orderto ensure that managers involved in making procurement decisions do not have conflicting interests, members of theDepartmental Acquisition Committee are required to complete a declaration indicating any interests they may have withbidding companies/organisations. In addition, the department required supply chain management officials to declare theirinterests as well.The OHS Committee conducted its monthly meetings, and twenty safety representatives received training in health and safetymatters.5.3 Governance structures••Audit Committee;••Policy Management Committee;••Performance Management Committee;••Risk Management Committee;••IT Steering Committee;••Departmental Acquisition Committee (DAC);and,••Bid Evaluation Committee (BEC).The department continued to improve its corporate governance arrangements pertaining to decision making structures, thepolicy environment, performance information management, and organizational performance monitoring. This environmenthas significantly assisted the department with the implementation, monitoring and review of planned versus actual targetsthereby entrenching the corporate governance environment. Further aspects of the KING III <strong>Report</strong> will be considered in thenext financial year.New / Proposed activities••Mobile Police Stations project; and,••Closed Circuit Television – CCTV.Asset managementThe Department has the following types of Assets on the Asset register, i.e. Capital Assets, Minor Assets and IntangibleAssets (Software). The department has moved from a manual asset register to the SAP Asset Management module, to ensurecompliance with the Asset Management Reforms. This has assisted the Department in ensuring that reporting is made easierand assists in the verification process.Redundant / obsolete assets were disposed of through the Asset Disposal Committee, in accordance with theAsset Disposal Policy. Assets whereby the Department didn’t derive direct benefit from, were transferred to theuser entity, this being SAPS. The Assets maintained on the Asset Register were in good condition.The Asset Register was updated as and when acquisitions and movements occurred. Asset Verification was conducted andthe Asset Register was updated accordingly. Monthly Reconciliations were performed to ensure that the General Ledger onthe BAS system reconciled with the Asset Register.These reconciliations were submitted to the Provincial Treasury on a monthly basis.No maintenance projects were undertaken in the year under review, as the Department didn’t have an Infrastructure Capitalbudget.94 | <strong>Annual</strong> <strong>Report</strong> <strong>2011</strong>/12 • Department of <strong>Community</strong> <strong>Safety</strong>
REPORT OF THE ACCOUNTING OFFICER - VOTE 8for the year ended 31 March <strong>2012</strong>InventoriesThe Department was in the process of migrating to the SAP Inventory Management System. Stock counts were done on aquarterly basis in all warehouses. The value of the stock on hand was disclosed on the Interim Financial Statements and the<strong>Annual</strong> Financial Statement.Information on predetermined objectivesThe department develops annual plans, monitors the implementation of approved plans and reviews progress made byvarious units on a monthly and quarterly basis. Organizational performance monitoring is informed by the national andprovincial framework on the monitoring and evaluation of organisational performance and the department’s policy onperformance information management.Quarterly Review Sessions were held to review performance for the past quarter and highlight planned targets and projectionsfor the next quarter. Corrective measures and additional activities are put in place if needed, then recorded and monitoreduntil the matter is concluded and/or resolved.The financial In Year Monitoring (IYM) report together with other relevant financial information is submitted to ProvincialTreasury on a monthly and quarterly basis. The department submits the following information on a quarterly basis:••Non-financial performance report to the Provincial Treasury;••Non-financial performance report to the Standing Committee on <strong>Community</strong> <strong>Safety</strong>; and,••Financial and non-financial performance reports to the Audit Committee.In addition, the department submits a monthly progress report on the POA to the office of the Premier.Standing Committee On Public Accounts(SCOPA) resolutionsNo SCOPA resolutions or report for the financial year <strong>2011</strong>/12.Prior modification to Audit <strong>Report</strong>sNot Applicable.Exemptions and deviation received from National TreasuryNo exemptions and deviations were received National Treasury during the financial year <strong>2011</strong>/12.Interim Financial Statements (IFS)The Department has completed the IFS at the end of each quarter as per compliance requirements. Guidance and advicewas provided by the <strong>Gauteng</strong> Provincial Treasury and the Audit Committee with the objective of complying with NationalTreasury requirements. The financial statements were reviewed by <strong>Gauteng</strong> Audit Services (GAS).
REPORT OF THE ACCOUNTING OFFICER - VOTE 8for the year ended 31 March <strong>2012</strong>ApprovalThe <strong>Annual</strong> Financial Statements set out on pages 88 to 96 have been approved by the Accounting Officer.Adv Mongezi TshongweniHead of Department31 May <strong>2012</strong>96 | <strong>Annual</strong> <strong>Report</strong> <strong>2011</strong>/12 • Department of <strong>Community</strong> <strong>Safety</strong>
AUDITOR GENERAL REPORTfor the year ended 31 March <strong>2012</strong>REPORT OF THE AUDITOR-GENERAL TO THE GAUTENG PROVINCIAL LEGISLATURE ON VOTE NO. 8 GAUTENGDEPARTMENT OF COMMUNITY SAFETYREPORT ON THE FINANCIAL STATEMENTSIntroductionI have audited the financial statements of the <strong>Gauteng</strong> Department of <strong>Community</strong> <strong>Safety</strong> set out on pages 100 to 140,which comprise the appropriation statement, the statement of financial position as at 31 March <strong>2012</strong>, the statement offinancial performance, statement of changes in net assets and the cash flow statement for the year then ended and thenotes, comprising a summary of significant accounting policies and other explanatory information.Accounting officer’s responsibility for the financial statementsThe accounting officer is responsible for the preparation of these financial statements in accordance with theDepartmental financial reporting framework prescribed by the National Treasury and the requirements of the PublicFinance Management Act, 1999 (Act No. 1 of 1999) (PFMA), and for such internal control as the accounting officerdetermines is necessary to enable the preparation of financial statements that are free from material misstatement,whether due to fraud or error.Auditor-General’s responsibilityMy responsibility is to express an opinion on these financial statements based on my audit. I conducted my audit inaccordance with the Public Audit Act, 2004 (Act No. 25 of 2001) (PAA), the General Notice issued in terms thereofand International Standards on Auditing. Those standards require that I comply with ethical requirements and planand perform the audit to obtain reasonable assurance about whether the financial statements are free from materialmisstatement.An audit involves performing procedures to obtain audit evidence about the amounts and disclosures in the financialstatements. The procedures selected depend on the auditor’s judgement, including the assessment of the risks ofmaterial misstatement of the financial statements, whether due to fraud or error. In making those risk assessments,the auditor considers internal control relevant to the entity’s preparation of the financial statements in order to designaudit procedures that are appropriate in the circumstances, but not for the purpose of expressing an opinion onthe effectiveness of the entity’s internal control. An audit also includes evaluating the appropriateness of accountingpolicies used and the reasonableness of accounting estimates made by management, as well as evaluating the overallpresentation of the financial statements.I believe that the audit evidence I have obtained is sufficient and appropriate to provide a basis for my audit opinion.OpinionIn my opinion, the financial statements present fairly, in all material respects, the financial position of the <strong>Gauteng</strong>Department of <strong>Community</strong> <strong>Safety</strong> as at 31 March <strong>2012</strong>, and its financial performance and cash flows for the yearthen ended in accordance with the Departmental financial reporting framework prescribed by the National Treasuryand the requirements of the PFMA.Emphasis of matterI draw attention to the matter below. My opinion is not modified in respect of this matter.Material underspending of budgetAs disclosed in the appropriation statement, the department has materially underspent the budget on the civilianoversight and crime prevention, community police relations and traffic management programmes to the amount ofR23,1 million. As a consequence, the department has not fully achieved its objectives.Additional matterI draw attention to the matter below. My opinion is not modified in respect of this matter.
Financial reporting frameworkThe financial reporting framework prescribed by the National Treasury and applied by the department is a complianceframework. The wording of my opinion on a compliance framework should reflect that the financial statements havebeen prepared in accordance with this framework and not that they “present fairly”. Section 20(2)(a) of the PAA,however, requires me to express an opinion on fair presentation of the financial statements. The wording of my opiniontherefore reflects this requirement.REPORT ON OTHER LEGAL AND REGULATORY REQUIREMENTSIn accordance with the PAA and the General Notice issued in terms thereof, I report the following findings relevant toperformance against predetermined objectives, compliance with laws and regulations and internal control, but not forthe purpose of expressing an opinion.Predetermined objectivesI performed procedures to obtain evidence about the usefulness and reliability of the information in the annualperformance report as set out on pages 17 to 82 of the annual report.The reported performance against predetermined objectives was evaluated against the overall criteria of usefulness andreliability. The usefulness of information in the annual performance report relates to whether it is presented in accordancewith the National Treasury annual reporting principles and whether the reported performance is consistent with theplanned objectives. The usefulness of information further relates to whether indicators and targets are measurable (i.e.well defined, verifiable, specific, measurable and time bound) and relevant as required by the National TreasuryFramework for managing programme performance information.The reliability of the information in respect of the selected programmes is assessed to determine whether it adequatelyreflects the facts (i.e. whether it is valid, accurate and complete).There were no material findings on the annual performance report concerning the usefulness and reliability of theinformation.Additional matterAlthough no material finding concerning the usefulness and reliability of the performance information was identifiedin the annual performance report, I draw attention to the matter below. This matter does not have an impact on thepredetermined objectives audit findings reported above.Achievement of planned targetsOf the total number of planned targets, only 99 were achieved during the year under review during the year underreview. This represents 36% of total planned targets that were not achieved during the year under review.Compliance with laws and regulationsI performed procedures to obtain evidence that the department had complied with applicable laws and regulationsregarding financial matters, financial management and other related matters. My findings on material non-compliancewith specific matters in key applicable laws and regulations as set out in the General Notice issued in terms of the PAAare as follows:98 | <strong>Annual</strong> <strong>Report</strong> <strong>2011</strong>/12 • Department of <strong>Community</strong> <strong>Safety</strong>
<strong>Annual</strong> financial statementsThe financial statements submitted for auditing were not prepared in accordance with the prescribed financial reportingframework as required by section 40(1)(b) of the PFMA. Material misstatements of disclosure items identified by theauditors in the financial statements were subsequently corrected resulting in the financial statements receiving anunqualified audit report.Irregular expenditureThe accounting officer did not take effective steps to prevent irregular expenditure as required by section 38(1)(c)(ii) ofthe PFMA and Treasury Regulation 9.1.1.Procurement and contract managementGoods and services of a transaction value above R500 000 were not always procured without inviting competitivebids as required by Treasury Regulation 16A6.1. Deviations were approved in contravention of Treasury Regulation16A6.4.Internal controlI considered internal control relevant to my audit of the financial statements, annual performance report and compliancewith laws and regulations. The matters reported below under the fundamentals of internal control are limited to thesignificant deficiencies that resulted in the findings on the annual performance report and the findings on compliancewith laws and regulations included in this report.Financial and performance managementNo adequate review and monitoring of compliance with applicable laws and regulations.Johannesburg31 July <strong>2012</strong>
APPROPRIATION STATEMENTfor the year ended 31 March <strong>2012</strong>Appropriation Statement Adjusted Appropriation Shifting ofFundsAppropriation per programme<strong>2011</strong>/12 2010/11Virement FinalAppropriationActualExpenditureVariance Expenditureas % offinal appropriationFinalAppropriationR’000 R’000 R’000 R’000 R’000 R’000 % R’000 R’0001.AdministrationCurrent payment 54 254 (1 176) (997) 52 081 50 166 1 915 96.3% 47 821 47 821Transfers and subsidies - - - - - - - 1 051 1 051Payment for capital assets 1 605 1 130 16 2 751 2 751 - 100% - -Payment for financial assets - 46 - 46 46 - 100% 99 992.Civilian Oversight 55 859 - (981) 54 878 52 963 1 915 - 48 971 48 971ActualExpenditureCurrent payment 23 846 (1 121) (701) 22 024 11 840 10 184 53.8% 15 162 15 162Transfers and subsidies - - - - - - - - -Payment for capital assets 100 1 114 - 1 214 1 213 1 99.9% - -Payment for financial assets - 7 - 7 7 - 100% 1 13.Crime Prevention and<strong>Community</strong> Police Relations23 946 - (701) 23 245 13 060 10 185 - 15 163 15 163Current payment 85 246 11 (1 123) 84 134 81 894 2 240 97.3% 66 692 66 692Transfers and subsidies 800 (12) 82 870 870 - 100% 564 564Payment for capital assets 190 - 45 235 235 - 100% 186 186Payment for financial assets - 1 118 119 119 - 100% - -86 236 - (878) 85 358 83 118 2 240 67 442 67 4424.Traffic ManagementCurrent payment 251 973 (12 233) 2 560 242 300 233 515 8 785 96.4% 236 284 216 533Transfer and subsidies 562 475 - 1 037 1 037 - 100% 1 666 1 666Payment for capital assets 5 171 11 693 - 16 864 16 864 - 100% 4 871 31 763Payment for financial assets - 65 - 65 65 - 100% - -257 706 - 2 560 260 266 251 481 8 785 242 821 249 962Subtotal 423 747 - - 423 747 400 622 23 125 94.5% 374 397 381 538100 | <strong>Annual</strong> <strong>Report</strong> <strong>2011</strong>/12 • Department of <strong>Community</strong> <strong>Safety</strong>
Appropriation Statement Adjusted Appropriation Shifting ofFundsStatutory AppropriationCurrent paymentTransfers and subsidiesPayment for capital assetsPayment for financial assetsAppropriation per programme<strong>2011</strong>/12 2010/11Virement FinalAppropriationActualExpenditureVariance Expenditureas % offinal appropriationFinalAppropriationR’000 R’000 R’000 R’000 R’000 R’000 % R’000 R’000ActualExpenditureTotal 423 747 - - 423 747 400 622 23 125 94.5% 374 397 381 538TOTAL (brought forward)Reconciliation with statement of financial performanceFinalAppropriation<strong>2011</strong>/12 2010/11ActualExpenditureFinalAppropriationActualExpenditureADDDepartmental receipts 13 781 11 848Direct Exchequer receiptsAid assistanceActual amounts per statement of financial performance (total revenue) 437 528 386 245ADDAid assistanceDirect Exchequer paymentsPrior year unauthorised expenditure approved without fundingActual amounts per statement of financial performance (total expenditure) 400 622 381 538
APPROPRIATION STATEMENTfor the year ended 31 March <strong>2012</strong>AdjustedAppropriationShifting ofFundsAppropriation per economic classification<strong>2011</strong>/12 2010/11Virement FinalAppropriationActualExpenditureVariance Expenditureas % of finalappropriationFinalAppropriationActualexpenditureR’000 R’000 R’000 R’000 R’000 R’000 % R’000 R’000Current paymentsCompensation of employees 241 926 - - 241 926 235 230 6 696 97.2% 208 472 220 406Goods and services 173 393 (28 868) (537) 143 988 127 332 16 656 88.4% 157 488 118 756Interest and rent on land - 14 350 276 14 626 14 853 (227) 106.6% - 7 047Transfers and subsidies - - - - - - - - -Provinces and municipalities - - - - - - - - -Departmental agencies and accounts - - - - - - - - -Universities and technikons - - - - - - - - -Foreign governments and international organisations - - - - - - - -Public corporations and private enterprises 800 (39) - 761 761 - 100% 562 562Non-profit institutions - - - - - - 2 2Households 562 502 82 1 146 1 146 - 100% 1 666 1 666Gifts and donations - - - - - - - -Payments for capital assets - - - - - - - - -Buildings and other fixed structures - - - - - - - - -Machinery and equipment 7 066 13 936 61 21 063 21 063 - 100% 6 045 32 937Heritage assets - - - - - - - - -Specialised military assets - - - - - - - - -Biological assets - - - - - - - - -Land and subsoil assets - - - - - - - - -Software and other intangible assets - - - - - - - 62 62Payments for financial assets - 119 118 237 237 - 100% 100 100Total 423 747 - - 423 747 400 622 23 125 94.5% 374 397 381 538102 | <strong>Annual</strong> <strong>Report</strong> <strong>2011</strong>/12 • Department of <strong>Community</strong> <strong>Safety</strong>
APPROPRIATION STATEMENTfor the year ended 31 March <strong>2012</strong>Detail per programme 1 – ADMINISTRATION for the year ended 31 March <strong>2012</strong><strong>2011</strong>/12 2010/11Detail per sub-programme AdjustedAppropriationShifting ofFundsVirement FinalAppropriationActualExpenditureVariance Expenditureas % of finalappropriationFinalAppropriationActualexpenditureR’000 R’000 R’000 R’000 R’000 R’000 % R’000 R’0001.1 OFFICE OF THE MECCurrent payment 5 960 380 - 6 340 6 199 141 97.8% 4 515 4 515Transfers and subsidies - - - - - - - - -Payment for capital assets - - - - - - - - -Payment for financial assets - - - - - - - 99 991.2 OFFICE OF THE HODCurrent payment 6 990 (124) - 6 866 6 340 526 92.3% 4 873 4 873Transfers and subsidies - - - - - - - -Payment for capital assets - 16 - 16 16 - 100% - -Payment for financial assets - - - - - - - -1.3 FINANCIAL MANAGEMENTCurrent payment 14 066 (889) (554) 12 623 12 040 583 95.4% 12 185 12 185Transfers and subsidies - - - - - - - - -Payment for capital assets - - - - - - - -Payment for financial assets - - - - - - - -1.4 CORPORATE SERVICESCurrent payment 23 762 (1 069) - 22 693 22 182 511 97.7% 26 248 26 248Transfers and subsidies - - - - - - 1 051 1 051Payment for capital assets 1 605 1 114 - 2 719 2 719 - 100% - -Payment for financial assets - 16 - 16 16 100% - -1.5 LEGALCurrent payment 2 234 617 - 2 851 2 763 88 96.9% - -Transfers and subsidies - - - - - - - -Payment for capital assets - - - - - - - -Payment for financial assets - - - - - - - -
Detail per sub-programme AdjustedAppropriationShifting ofFunds<strong>2011</strong>/12 2010/11Virement FinalAppropriationActualExpenditureVariance Expenditureas % of finalappropriationFinalAppropriationActualexpenditureR’000 R’000 R’000 R’000 R’000 R’000 % R’000 R’0001.6 SECURITYCurrent payment 1 242 (91) (443) 708 642 66 90.7% - -Transfers and subsidies - - - - - - - -Payment for capital assets - - 16 16 16 - 100% - -Payment for financial assets - 30 - 30 30 - 100% - -Total 55 859 - (981) 54 878 52 963 1 915 96.5% 48 971 48 971Program 1 Per Economic classification AdjustedAppropriationStatutory Appropriation per economic classification<strong>2011</strong>/12 2010/11Shifting ofFundsVirement FinalAppropriationActualExpenditureVariance Expenditureas % of finalappropriationFinalAppropriationActualexpenditureR’000 R’000 R’000 R’000 R’000 R’000 % R’000 R’000Current paymentsCompensation of employees 33 788 - - 33 788 31 874 1 914 94.3% 29 849 29 849Goods and services 20 466 (1 176) (997) 18 293 18 292 1 100% 17 972 17 972Interest and rent on land - - - - - - - - -Transfers and subsidies - - - - - - - - -Provinces and municipalities - - - - - - - - -Departmental agencies and accounts - - - - - - - - -Universities and technikons - - - - - - - - -Foreign governments and international organisations - - - - - - - - -Public corporations and private enterprises - - - - - - - - -Non-profit institutions - - - - - - - - -Households - - - - - - - - -Gifts and donations - - - - - - - - -Payments for capital assets - - - - - - - - -Buildings and other fixed structures - - - - - - - - -Machinery and equipment 1 605 1 130 16 2 751 2 751 - 100% 989 989104 | <strong>Annual</strong> <strong>Report</strong> <strong>2011</strong>/12 • Department of <strong>Community</strong> <strong>Safety</strong>
Program 1 Per Economic classification AdjustedAppropriationStatutory Appropriation per economic classification<strong>2011</strong>/12 2010/11Shifting ofFundsVirement FinalAppropriationActualExpenditureVariance Expenditureas % of finalappropriationFinalAppropriationActualexpenditureR’000 R’000 R’000 R’000 R’000 R’000 % R’000 R’000Heritage assets - - - - - - - - -Specialised military assets - - - - - - - - -Biological assets - - - - - - - - -Land and subsoil assets - - - - - - - - -Software and other intangible assets - - - - - - - 62 62Payments for financial assets - 46 - 46 46 100% 99 99Total 55 859 (981) 54 878 52 963 1 915 96.5% 48 971 48 971Detail per programme 2 – CIVILIAN OVERSIGHT for the year ended 31 March <strong>2012</strong>Detail per sub-programme AdjustedAppropriationShifting ofFunds<strong>2011</strong>/12 2010/11Virement FinalAppropriationActualExpenditureVariance Expenditureas % of finalappropriationFinalAppropriationActualexpenditureR’000 R’000 R’000 R’000 R’000 R’000 % R’000 R’0002.1 POLICY AND RESEARCHCurrent payment 10 867 - - 10 867 3 123 7 744 28.7% 3 571 3 571Transfers and subsidies - - - - - - - - -Payment for capital assets 100 (100) - - - - - - -Payment for financial assets - - - - - - - - -2.2 MONITORING AND EVALUATIONCurrent payment 11 854 (1 121) (693) 10 040 7 621 2 419 75.9% 10 611 10 611Transfers and subsidies - - - - - - - -Payment for capital assets - 1 214 - 1 214 1 213 1 99.9% - -Payment for financial assets - 7 - 7 7 - 100%% 1 1
Detail per sub-programme AdjustedAppropriationShifting ofFunds<strong>2011</strong>/12 2010/11Virement FinalAppropriationActualExpenditureVariance Expenditureas % of finalappropriationFinalAppropriationActualexpenditureR’000 R’000 R’000 R’000 R’000 R’000 % R’000 R’0002.3 MANAGEMENTCurrent payment 1 125 - (8) 1 117 1 096 21 98.1% 980 980Transfers and subsidies - - - - - - - - -Payment for capital assets - - - - - - - - -Payment for financial assets - - - - - - - -Total 23 946 - (701) 23 245 13 060 10 185 56.2% 15 163 15 163Programme 2 Per Economic classification AdjustedAppropriationShifting ofFunds<strong>2011</strong>/12 2010/11Virement FinalAppropriationActualExpenditureVariance Expenditureas % of finalappropriationFinalAppropriationActualexpenditureR’000 R’000 R’000 R’000 R’000 R’000 % R’000 R’000Current payments - - - - - - - -Compensation of employees 13 818 - - 13 818 11 276 2 542 81.6% 10 861 10 861Goods and services 10 028 (1 957) (701) 7 370 (273) 7 643 (3.7%) 4 301 4 301Interest and rent on land - 837 - 837 837 - 100% - -Transfers and subsidies to:Provinces and municipalities - - - - - - - -Departmental agencies and accounts - - - - - - - - -Universities and technikons - - - - - - - - -Foreign governments and international organisations - - - - - - - - -Public corporations and private enterprises - - - - - - - - -106 | <strong>Annual</strong> <strong>Report</strong> <strong>2011</strong>/12 • Department of <strong>Community</strong> <strong>Safety</strong>
Programme 2 Per Economic classification AdjustedAppropriationShifting ofFunds<strong>2011</strong>/12 2010/11Virement FinalAppropriationActualExpenditureVariance Expenditureas % of finalappropriationFinalAppropriationActualexpenditureR’000 R’000 R’000 R’000 R’000 R’000 % R’000 R’000Non-profit institutions - - - - - - - - -Households - - - - - - - - -Gifts and donations - - - - - - - - -Payment for capital assetsBuildings and other fixed structures - - - - - - - - -Machinery and equipment 100 1 113 - 1 213 1 213 - 100% - -Heritage assets - - - - - - - - -Specialised military assets - - - - - - - - -Biological assets - - - - - - - - -Land and subsoil assets - - - - - - - - -Software and other intangible assets - - - - - - - - -Payments for financial assets - 7 - 7 7 - 100% 1 1Total 23 946 (701) 23 245 13 060 10 185 56.2% 15 163 15 163Detail per programme 3 – CRIME PREVENTION AND COMMUNITY POLICE RELATIONS for the year ended 31 March <strong>2012</strong><strong>2011</strong>/12 2010/11Detail per sub-programme AdjustedAppropriationShifting ofFundsVirement FinalAppropriationActualExpenditureVariance Expenditureas % of finalappropriationFinalAppropriationActualexpenditureR’000 R’000 R’000 R’000 R’000 R’000 % R’000 R’0003.1 SOCIAL CRIME PREVENTIONCurrent payment 19 007 (2 658) (135) 16 214 16 199 15 99.9% 17 346 17 346Transfers and subsidies - 27 - 27 27 - 100% - -Payment for capital assets 190 (190) - - - - - 102 102Payment for financial assets - - - - - - - - -3.2 COMMUNITY POLICE RELATIONSCurrent payment 38 255 2 669 (228) 40 696 40 696 - 100% 28 392 28 392
Detail per sub-programme AdjustedAppropriationShifting ofFunds<strong>2011</strong>/12 2010/11Virement FinalAppropriationActualExpenditureVariance Expenditureas % of finalappropriationFinalAppropriationActualexpenditureR’000 R’000 R’000 R’000 R’000 R’000 % R’000 R’000Transfers and subsidies 800 (39) - 761 761 - 100% 562 562Payment for capital assets - 190 45 235 235 - 100% - -Payment for financial assets - 1 - 1 1 - 100% - -3.3 PROMOTION OF SAFETYCurrent payment 11 207 - (1 013) 10 194 10 194 - 100% 8 452 8 452Transfers and subsidies - - 82 82 82 - 100% 2 2Payment for capital assets - - - - - - - - -Payment for financial assets - - - - - - - - -3.4 PUBLIC AWARENESS AND INFORMATIONCurrent payment 13 770 11 253 14 034 13 673 361 97.4% 10 582 10 582Transfers and subsidies - - - - - - - - -Payment for capital assets - - - - - - - 84 84Payment for financial assets - - 118 118 118 100% - -3.5 MANAGEMENTCurrent payment 3 007 (11) - 2 996 1 132 1 864 37.8% 1 920 1 920Transfers and subsidies - - - - - - - - -Payment for capital assets - - - - - - - - -Payment for financial assets - - - - - - - - -Total 86 236 - (878) 85 358 83 118 2 240 97.4% 67 442 67 442108 | <strong>Annual</strong> <strong>Report</strong> <strong>2011</strong>/12 • Department of <strong>Community</strong> <strong>Safety</strong>
Programme 3 Per Economic classification AdjustedAppropriation<strong>2011</strong>/12 2010/11Shifting of Funds Virement FinalAppropriationActualExpenditureVariance Expenditureas % of finalappropriationFinalAppropriationActualexpenditureR’000 R’000 R’000 R’000 R’000 R’000 % R’000 R’000Current paymentsCompensation of employees 29 548 - (4 894) 24 654 22 414 2 240 90.9% 22 367 22 367Goods and services 55 698 11 3 495 59 204 59 204 - 100% 44 326 44 326Interest and rent on land - - 276 276 276 - 100% - -Transfers and subsidies to:Provinces and municipalities - - - - - - - - -Departmental agencies and accounts - - - - - - - - -Universities and technikons - - - - - - - - -Foreign governments and international organisations - - - - - - - - -Public corporations and private enterprises 800 (39) - 761 761 - 100% 562 562Non-profit institutions - - - - - - - 2 2Households 27 82 109 109 - 100% - -Gifts and donations - - - - - - - - -Payment for capital assetsBuildings and other fixed structures - - - - - - - -Machinery and equipment 190 - 45 235 235 - 100% 185 185Heritage assets - - - - - - - - -Specialised military assets - - - - - - - - -Biological assets - - - - - - - - -Land and subsoil assets - - - - - - - - -Software and other intangible assets - - - - - - - - -Payments for financial assets - 1 118 119 119 - 100% - -Total 86 236 - (878) 85 358 83 118 2 240 97.4% 67 442 67 442
Detail per programme 4 – TRAFFIC MANAGEMENT for the year ended 31 March <strong>2012</strong>Detail per sub-programme AdjustedAppropriation<strong>2011</strong>/12 2010/11Shifting of Funds Virement FinalAppropriationActualExpenditureVariance Expenditureas % of finalappropriationFinalAppropriationActualexpenditureR’000 R’000 R’000 R’000 R’000 R’000 % R’000 R’0004.1 TRAFFIC LAW ENFORCEMENTCurrent payment 118 293 (1 482) 131 116 942 116 944 (2) 100% 118 600 93 021Transfers and subsidies - - - - - - - -Payment for capital assets 5 116 5 221 - 10 337 10 337 - 100% 2 933 31 685Payment for financial assets - 55 - 55 55 - 100% - -4.2 ROAD SAFETY PROJECTCurrent payment 42 010 - 2 490 44 500 44 478 22 100% 40 936 43 626Transfers and subsidies - - - - - - - - -Payment for capital assets - - - - - - - 1 860 -Payment for financial assets - - - - - - - -4.3 GDS ALLOCATION FOR INTELLIGENTTRANSPORT SYSTEM (ROAD SAFETY)Current payment 3 739 - - 3 739 3 605 134 96.4% 4 708 4 708Transfers and subsidies - - - - - - - - -Payment for capital assets - - - - - - - - -Payment for financial assets - - - - - - - - -4.4 SPECIAL SERVICESCurrent payment 20 200 (2 916) (791) 16 493 14 458 2 035 87.7% 13 494 14 259Transfers and subsidies - - - - - - - - -Payment for capital assets - 2 916 - 2 916 2 916 - 100% - -Payment for financial assets - - - - - - - - -110 | <strong>Annual</strong> <strong>Report</strong> <strong>2011</strong>/12 • Department of <strong>Community</strong> <strong>Safety</strong>
Detail per sub-programme AdjustedAppropriation<strong>2011</strong>/12 2010/11Shifting of Funds Virement FinalAppropriationActualExpenditureVariance Expenditureas % of finalappropriationFinalAppropriationActualexpenditureR’000 R’000 R’000 R’000 R’000 R’000 % R’000 R’0004.5 TRAINING TRAFFIC COLLEGECurrent payment 20 760 (3 001) 730 18 489 16 566 1 923 89.6% 19 515 19 612Transfers and subsidies 562 475 - 1 037 1 037 - 100% 1 666 1 666Payment for capital assets 55 914 - 969 969 - 100% 78 78Payment for financial assets - - - - - - - -4.6 PUBLIC TRANSPORT INSPECTIONCurrent payment 29 428 (2 952) - 26 476 25 905 571 97.8% 26 433 28 709Transfers and subsidies - - - - - - - -Payment for capital assets - 2 616 - 2 616 2 616 - 100% - -Payment for financial assets - 10 - 10 10 - 100% - -4.7 ROAD SAFETY EDUCATIONCurrent payment 16 467 (1 749) - 14 718 10 626 4 092 72.2% 11 658 11 658Transfers and subsidies - - - - - - - - -Payment for capital assets - 26 - 26 26 - 100% - -Payment for financial assets - - - - - - - - -4.8 MANAGEMENTCurrent payment 1 076 (133) - 943 933 10 98.9% 940 940Transfers and subsidies - - - - - - - - -Payment for capital assets - - - - - - - - -Payment for financial assets - - - - - - - - -Total 257 706 - 2 560 260 266 251 481 8 785 96.6% 242 821 249 962
Programme 4 Per Economic classification AdjustedAppropriation<strong>2011</strong>/12 2010/11Shifting of Funds Virement FinalAppropriationActualExpenditureVariance Expenditureas % of finalappropriationFinalAppropriationActualexpenditureR’000 R’000 R’000 R’000 R’000 R’000 % R’000 R’000Current paymentsCompensation of employees 164 772 - 4 894 169 666 169 666 - 100% 145 395 157 329Goods and services 87 201 (25 746) (2 334) 59 121 50 109 9 012 84.8% 90 889 52 157Interest and rent on land - 13 513 - 13 513 13 740 (227) 101.7% - 7 047Transfers and subsidies to:Provinces and municipalities - - - - - - - - -Departmental agencies and accounts - - - - - - - - -Universities and technikons - - - - - - - - -Foreign governments and international organisations - - - - - - - - -Public corporations and private enterprises - - - - - - - - -Non-profit institutions - - - - - - - - -Households 562 475 1 037 1 037 100% 1 666 1 666Gifts and donations - - - - - - - - -Payment for capital assets - - - - - - - - -Buildings and other fixed structures - - - - - - - -Machinery and equipment 5 171 11 693 - 16 864 16 864 - 100% 4 871 31 763Heritage assets - - - - - - - - -Specialised military assets - - - - - - - - -Biological assets - - - - - - - - -Land and subsoil assets - - - - - - - - -Software and other intangible assets - - - - - - - - -Payments for financial assets - 65 - 65 65 - 100% - -Total 257 706 - 2 560 260 266 251 481 8 785 96.6 242 821 249 962112 | <strong>Annual</strong> <strong>Report</strong> <strong>2011</strong>/12 • Department of <strong>Community</strong> <strong>Safety</strong>
NOTES TO THE APPROPRIATION STATEMENT - VOTE 8for the year ended 31 March <strong>2012</strong>Detail of transfers and subsidies as per Appropriation Act (after Virement)Detail of these transactions can be viewed in the note on Transfers and subsidies, disclosure notes andAnnexure 1 (E and H) to the <strong>Annual</strong> Financial Statements.Detail of specifically and exclusively appropriated amounts voted (after Virement)Detail of these transactions can be viewed in note 1 (<strong>Annual</strong> Appropriation) to the <strong>Annual</strong> Financial Statements.Detail on payments for financial assetsDetail of these transactions per programme can be viewed in the note on Payments for financial assets to the<strong>Annual</strong> Financial Statements.Explanations of material variances from Amounts Voted (after Virement)4.1 Per Programme Final Appropriation Actual Expenditure Variance R’000 Variance as a % ofFinal AppropriationAdministration 54 878 52 963 1 915 97%Civilian Oversight 23 245 13 060 10 185 56%Crime Prevention and <strong>Community</strong> Police85 358 83 118 2 240 99%RelationsTraffic Management 260 266 251 481 8 785 97%The following is an explanation of variances per programmeProgramme 1: Administration – R 1 915 millionThe underspending is due to vacant positions not filled during the financial year.Programme 2: Civilian Oversight – R 10 185 millionThe underspending is due to an amount of R 6, 575 million allocated to the Close Circuit Television project that was notspend as a result of challenges experienced during the procurement processes for implementation of this project and vacantpositions not filled during the financial yearProgramme 3: Crime Prevention and <strong>Community</strong> Police Relations – R 2 240 millionThe underspending is due to vacant positions not filled during the financial year under review.Programme 4: Traffic Management – R 8 785 millionThe underspending is due system challenges experienced by G-fleet to process the invoices for February <strong>2011</strong> and March<strong>2011</strong>. When the interface takes place it immediately increase expenditure in the accounting records of the department. Thetotal amount of invoices which did not interface is R 7 819 million.4.2 Per Economic classification Final Appropriation Actual Expenditure Variance Variance as a % ofFinal AppropriationR’000 R’000 R’000 R’000Current paymentsCompensation of employees 241 926 235 230 6 696 97%Goods and services 143 988 127 332 16 656 89%
NOTES TO THE APPROPRIATION STATEMENT - VOTE 8for the year ended 31 March <strong>2012</strong>4.2 Per Economic classification Final Appropriation Actual Expenditure Variance Variance as a % ofFinal AppropriationR’000 R’000 R’000 R’000Interest and rent on land 14 626 14 853 (227) 100%Transfers and subsidiesPublic corporations and private enterprises 761 761 - 100%Households 1 146 1 146 - 100%Payments for capital assetsMachinery and equipment 21 063 21 063 - 100%Payments for financial assets 237 237 - 100%The department under spend the planned budget by R 23, 125 million.The following is an explanation of variances per economic classification:••Compensation of Employees - R 6, 696 millionSavings were realised as a result of vacant positions not being filled during the financial year.••Goods and Services - R 16, 656 million••An amount of R 6, 575 million allocated to the Close Circuit Television project was not spend as a result of challengesexperienced during the procurement processes for implementation of this project. Furthermore G-fleet experiencedsystem challenges to process the G-fleet invoices for February <strong>2011</strong> and March <strong>2011</strong>. When the interface takes placeit immediately increase expenditure in the accounting records of the department. The average monthly amount thedepartment pays to G-fleet is R 4, 784 million.114 | <strong>Annual</strong> <strong>Report</strong> <strong>2011</strong>/12 • Department of <strong>Community</strong> <strong>Safety</strong>
STATEMENT OF FINANCIAL PERFOMANCE - VOTE 8for the year 31 March <strong>2012</strong>PERFORMANCE Note <strong>2011</strong>/12 2010/11R’000 R’000REVENUE<strong>Annual</strong> appropriation 1 423 747 374 397Departmental revenue 2 13 781 11 848TOTAL REVENUE 437 528 386 245EXPENDITURECurrent expenditureCompensation of employees 3 235 230 220 406Goods and services 4 127 332 118 756Interest and rent on land 5 14 853 7 047Total current expenditure 377 415 346 209Transfers and subsidiesTransfers and subsidies 7 1 907 2 230Total transfers and subsidies 1 907 2 230Expenditure for capital assetsTangible capital assets 8 21 063 32 937Software and other intangible assets 8 - 62Total expenditure for capital assets 21 063 32 999Payments for financial assets 6 237 100TOTAL EXPENDITURE 400 622 381 538SURPLUS/(DEFICIT) FOR THE YEAR 36 906 4 707Reconciliation of Net Surplus/(Deficit) for the yearVoted funds 23 125 (7 141)<strong>Annual</strong> appropriation 23 125 (7 141)Departmental revenue 2 13 781 11 848SURPLUS/(DEFICIT) FOR THE YEAR 36 906 4 707
STATEMENT OF FINANCIAL POSITION - VOTE 8as at 31 March <strong>2012</strong>POSITION Note <strong>2011</strong>/12 2010/11ASSETSR’000 R’000Current assets 30 426 30 540Unauthorised expenditure 9 29 742 29 742Fruitless and wasteful expenditure 10 326 326Cash and cash equivalents 11 25 42Prepayments and advances 12 - 14Receivables 13 333 416TOTAL ASSETS 30 426 30 540LIABILITIESCurrent liabilities 30 426 30 540Voted funds to be surrendered to the Revenue Fund 14 23 451 326Departmental revenue and NRF Receipts to be surrendered to the Revenue 15 3 213 3 024FundBank overdraft 16 3 347 12 603Payables 17 415 14 587TOTAL LIABILITIES 30 426 30 540116 | <strong>Annual</strong> <strong>Report</strong> <strong>2011</strong>/12 • Department of <strong>Community</strong> <strong>Safety</strong>
CASH FLOW STATEMENT - VOTE 8for the year ended 31 March <strong>2012</strong>CASH FLOW Note <strong>2011</strong>/12 2010/11R’000 R’000CASH FLOWS FROM OPERATING ACTIVITIESReceipts 437 528 386 245<strong>Annual</strong> appropriated funds received 1.1 423 747 374 397Departmental revenue received 3 13 781 11 848Net (increase)/decrease in working capital (14 075) 18 273Surrendered to Revenue Fund (13 592) (9 198)Current payments (377 415) 346 209Payments for financial assets (237) (100)Transfers and subsidies paid (1 907) (2 230)Net cash flow available from operating activities 27 30 302 10 235CASH FLOWS FROM INVESTING ACTIVITIESPayments for capital assets 12 (21 063) (32 999)Net cash flows from investing activities (21 063) (32 999)Net increase/(decrease) in cash and cash equivalents 9 239 (22 764)Cash and cash equivalents at beginning of period (12 561) 10 203Cash and cash equivalents at end of period 28 (3 322) (12 561)
ACCOUNTING POLICIES - VOTE 8for the year ended 31 March <strong>2012</strong>The Financial Statements have been prepared in accordance with the following policies, which have been appliedconsistently in all material aspects, unless otherwise indicated. However, where appropriate and meaningful, additionalinformation has been disclosed to enhance the usefulness of the Financial Statements and to comply with the statutoryrequirements of the Public Finance Management Act, Act 1 of 1999 (as amended by Act 29 of 1999), and the TreasuryRegulations issued in terms of the Act and the Division of Revenue Act, Act 1 of 2010.Presentation of the Financial Statements1.1 Basis of preparationThe Financial Statements have been prepared on a modified cash basis of accounting, except where stated otherwise. Themodified cash basis constitutes the cash basis of accounting supplemented with additional disclosure items. Under the cashbasis of accounting transactions and other events are recognised when cash is received or paid.1.2 Presentation currencyAll amounts have been presented in the currency of the South African Rand (R) which is also the functional currency of thedepartment.1.3 RoundingUnless otherwise stated all financial figures have been rounded to the nearest one thousand Rand (R’000).1.4 Comparative figuresPrior period comparative information has been presented in the current year’s financial statements. Where necessary figuresincluded in the prior period financial statements have been reclassified to ensure that the format in which the information ispresented is consistent with the format of the current year’s financial statements.1.5 Comparative figures - Appropriation StatementA comparison between actual amounts and final appropriation per major classification of expenditure is included in theAppropriation Statement.Revenue2.1 Appropriated fundsAppropriated funds comprises of departmental allocations as well as direct charges against revenue fund (i.e. statutoryappropriation).Appropriated funds are recognised in the financial records on the date the appropriation becomes effective. Adjustmentsmade in terms of the adjustments budget process are recognised in the financial records on the date the adjustments becomeeffective.Unexpended appropriated funds are surrendered to the Provincial Revenue Fund. Any amounts owing to the ProvincialRevenue Fund at the end of the financial year are recognised as payable in the statement of financial position.Any amount due from the Provincial Revenue Fund at the end of the financial year is recognised as a receivable in thestatement of financial position.2.2 Departmental revenueAll departmental revenue is recognised in the statement of financial performance when received and is subsequently paidinto the Provincial Revenue Fund, unless stated otherwise.Any amount owing to the Provincial Revenue Fund at the end if the financial year is recognised as a payable in the statementof financial position.118 | <strong>Annual</strong> <strong>Report</strong> <strong>2011</strong>/12 • Department of <strong>Community</strong> <strong>Safety</strong>
ACCOUNTING POLICIES - VOTE 8for the year ended 31 March <strong>2012</strong>No accrual is made for amounts receivable from the last receipt date to the end of the reporting period. These amounts arehowever disclosed in the disclosure notes to the annual financial statements.Expenditure3.1 Compensation of employees3.1.1 Salaries and wagesSalaries and wages are expensed in the statement of financial performance when the final authorisation for payment iseffected on the system (by no later than 31 March of each year).Other employee benefits that give rise to a present legal or constructive obligation are disclosed in the disclosure notes to thefinancial statements at its face value and are not recognised in the statement of financial performance or position.Employee costs are capitalised to the cost of a capital project when an employee spends more than 50% of his/her time onthe project. These payments form part of expenditure for capital assets in the statement of financial performance.3.1.2 Social contributionsEmployer contributions to post employment benefit plans in respect of current employees are expensed in the statement offinancial performance when the final authorisation for payment is effected on the system (by no later than 31 March of eachyear).No provision is made for retirement benefits in the financial statements of the department. Any potential liabilities aredisclosed in the financial statements of the National Revenue Fund and not in the financial statements of the employerdepartment.Employer contributions made by the department for certain of its ex-employees (such as medical benefits) are classified astransfers to households in the statement of financial performance.3.2 Goods and servicesPayments made during the year for goods and/or services are recognised as an expense in the statement of financialperformance when the final authorisation for payment is effected on the system (by no later than 31 March of each year).The expense is classified as capital if the goods and/or services were acquired for a capital project or if the total purchaseprice exceeds the capitalisation threshold (currently R5, 000). All other expenditures are classified as current.Rental paid for the use of buildings or other fixed structures is classified as goods and services and not as rent on land.3.3 InterestInterest is recognised as an expense in the statement of financial performance when the final authorisation for payment iseffected on the system (by no later than 31 March of each year). This item excludes rental for the use of buildings or otherfixed structures3.4 Payments for financial assetsDebts are written off when identified as irrecoverable. Debts written-off are limited to the amount of savings and/orunderspending of appropriated funds. The write off occurs at year-end or when funds are available. No provision is madefor irrecoverable amounts but an estimate is included in the disclosure notes to the financial statements amounts.All other losses are recognised when authorisation has been granted for the recognition thereof.3.5 Transfers and subsidiesTransfers and subsidies are recognised as an expense when the final authorisation for payment is effected on the system (byno later than 31 March of each year).
ACCOUNTING POLICIES - VOTE 8for the year ended 31 March <strong>2012</strong>3.6 Unauthorised expenditureWhen confirmed unauthorised expenditure is recognised as an asset in the statement of financial position until such timeas the expenditure is either approved by the relevant authority, recovered from the responsible person or written off asirrecoverable in the statement of financial performance.Unauthorised expenditure approved with funding is derecognised from the statement of financial position when theunauthorised expenditure is approved and the related funds are received.Where the amount is approved without funding it is recognised as expenditure in the statement of financial performance onthe date of approval.3.7 Fruitless and wasteful expenditureFruitless and wasteful expenditure is recognised as expenditure in the statement of financial performance according to thenature of the payment and not as a separate line item on the face of the statement. If the expenditure is recoverable it istreated as an asset until it is recovered from the responsible person or written off as irrecoverable in the statement of financialperformance.3.8 Irregular expenditureIrregular expenditure is recognised as expenditure in the statement of financial performance. If the expenditure is notcondoned by the relevant authority it is treated as an asset until it is recovered or written off as irrecoverable. The AccountingOffice of the department toojk the necessary steps to prevent the occurence of irregular expenditure, as required by section38 of the PFMA. Communication in terms of applying for condonment was effected accordingly.Assets4.1 Cash and cash equivalentsCash and cash equivalents are carried in the statement of financial position at cost.Bank overdrafts are shown separately on the face of the statement of financial position.For the purposes of the cash flow statement, cash and cash equivalents comprise cash on hand, deposits held, other shorttermhighly liquid investments and bank overdrafts.4.2 Prepayments and advancesAmounts prepaid or advanced are recognised in the statement of financial position when the payments are made and arederecognised as and when the goods/services are received or the funds are utilised.Prepayments and advances outstanding at the end of the year are carried in the statement of financial position at cost.4.3 ReceivablesReceivables included in the statement of financial position arise from cash payments made that are recoverable from anotherparty (including departmental employees) and are derecognised upon recovery or write-off.Receivables outstanding at year-end are carried in the statement of financial position at cost plus any accrued interest.Amounts that are potentially irrecoverable are included in the disclosure notes.4.4 InventoryInventories that qualify for recognition must be initially reflected at cost. Where inventories are acquired at no cost, or fornominal consideration, their cost shall be their fair value at the date of acquisition.All inventory items at year-end are reflected using the first in, first out (FIFO).120 | <strong>Annual</strong> <strong>Report</strong> <strong>2011</strong>/12 • Department of <strong>Community</strong> <strong>Safety</strong>
ACCOUNTING POLICIES - VOTE 8for the year ended 31 March <strong>2012</strong>4.5 Capital assets4.5.1 Movable assetsInitial recognitionA capital asset is recorded in the asset register on receipt of the item at cost. Cost of an asset is defined as the total cost ofacquisition. Where the cost cannot be determined accurately, the movable capital asset is stated at fair value. Where fairvalue cannot be determined, the capital asset is included in the asset register at R1.All assets acquired prior to 1 April 2002 are included in the register R1.4.5.2 Intengable assetsInitial recognitionAn intangible asset is recorded in the asset register on receipt of the item at cost. Cost of an intangible asset is defined asthe total cost of acquision. Where the cost cannot be determined accuratly, the intangible asset is stated at fair value. Wherethe fair value cannot be determined an intangible asset is included in the asset register ar R1.All intangible assets acquired prior 1 April 2002 can be included in the asset register at R1.Subsequent recognitionSubsequent expenditure of a capital nature is recorded in the statement of financial performance as “expenditure for capitalassets” and is capitalised in the asset register of the department on completion of the project.Repairs and maintenance is expensed as current “goods and services” in the statement of financial performance.Liabilities5.1 PayablesRecognised payables mainly comprise of amounts owing to other governmental entities. These payables are carried at costin the statement of financial position.5.2 Contingent liabilitiesContingent liabilities are included in the disclosure notes to the financial statements when it is possible that economic benefitswill flow from the department, or when an outflow of economic benefits or service potential is probable but cannot bemeasured reliably.5.3 Contingent assetsContingent assets are included in the disclosure notes to the financial statements when it is probable that an inflow ofeconomic benefits will flow to the entity.5.4 CommitmentsCommitments are not recognised in the statement of financial position as a liability or as expenditure in the statement offinancial performance but are included in the disclosure notes.5.5 AccrualsAccruals are not recognised in the statement of financial position as a liability or as expenditure in the statement of financialperformance but are included in the disclosure notes.5.6 Employee benefitsShort-term employee benefits that give rise to a present legal or constructive obligation are disclosed in the disclosure notesto the financial statements. These amounts are not recognised in the statement of financial performance or the statement offinancial position.
ACCOUNTING POLICIES - VOTE 8for the year ended 31 March <strong>2012</strong>5.7 Lease commitmentsFinance leaseFinance leases are not recognised as assets and liabilities in the statement of financial position. Finance lease payments arerecognised as an expense in the statement of financial performance and are apportioned between the capital and interestportions. The finance lease liability is disclosed in the disclosure notes to the financial statements.Operating leaseOperating lease payments are recognised as an expense in the statement of financial performance. The operating leasecommitments are disclosed in the discloser notes to the financial statement.Receivables for departmental revenueReceivables for departmental revenue are disclosed in the disclosure notes to the annual financial statements.Net Assets7.1 Recoverable revenueAmounts are recognised as recoverable revenue when a payment made in a previous financial year becomes recoverablefrom a debtor in the current financial year. Amounts are either transferred to the National/Provincial Revenue Fund whenrecovered or are transferred to the statement of financial performance when written-off.Related party transactionsSpecific information with regards to related party transactions is included in the disclosure notes.Key management personnelCompensation paid to key management personnel including their family members where relevant, is included in thedisclosure notes.122 | <strong>Annual</strong> <strong>Report</strong> <strong>2011</strong>/12 • Department of <strong>Community</strong> <strong>Safety</strong>
NOTES TO THE ANNUAL STATEMENTS - VOTE 8for the year ended 31 March <strong>2012</strong><strong>Annual</strong> Appropriation1.1 <strong>Annual</strong> AppropriationIncluded are funds appropriated in terms of the Appropriation Act (and the Adjustments Appropriation Act) for NationalDepartments (Voted funds) and Provincial Departments:<strong>2011</strong>/12 2010/11FinalAppropriationActual FundsReceivedFunds notrequested/not receivedAppropriationreceivedR’000 R’000 R’000 R’000Management 54 878 55 859 (981) 53 072Civilian 23 245 23 946 (701) 41 650Crime Prevention 85 358 86 236 (878) 47 799Traffic Management 260 266 257 706 2 560 231 876Total 423 747 423 747 - 374 397Departmental revenueNote <strong>2011</strong>/12 2010/11R’000 R’000Sales of goods and services other than capital assets 2.1 5 451 3 251Fines, penalties and forfeits 2.2 7 017 8 400Interest, dividends and rent on land 2.3 37 30Transactions in financial assets and liabilities 2.4 1 276 167Departmental revenue collected 13 781 11 8482.1 Sales of goods and services other than capital assetsNote <strong>2011</strong>/12 2010/112 R’000 R’000Sales of goods and services produced by the department 5 451 3 251Other sales 5 451 3 251Total 5 451 3 2512.2 Fines, penalties and forfeitsNote <strong>2011</strong>/12 2010/112 R’000 R’000Fines 7 017 8 400Total 7 017 8 400
NOTES TO THE ANNUAL STATEMENTS - VOTE 8for the year ended 31 March <strong>2012</strong>2.3 Interest, dividends and rent on landNote <strong>2011</strong>/12 2010/112 R’000 R’000Interest 37 30Total 37 30Transactions in financial assets and liabilitiesNote <strong>2011</strong>/12 2010/112 R’000 R’000Other Receipts including Recoverable Revenue 1 276 167Total 1 276 167Compensation of employees3.1 Salaries and WagesNote <strong>2011</strong>/12 2010/113 R’000 R’000Basic salary 151 545 143 685Performance award 2 899 397Service Based 13 262 11 919Compensative/circumstantial 14 757 13 800Periodic payments 104 131Other non-pensionable allowances 15 928 19 312Total 198 495 189 2443.2 Social contributions<strong>2011</strong>/12 2010/113 R’000 R’000Employer contributionsPension 21 120 16 864Medical 15 549 14 247Bargaining council 50 51Insurance 16 -Total 36 735 31 162Total compensation of employees 235 230 220 406Average number of employees 1 038 1 003124 | <strong>Annual</strong> <strong>Report</strong> <strong>2011</strong>/12 • Department of <strong>Community</strong> <strong>Safety</strong>
NOTES TO THE ANNUAL STATEMENTS - VOTE 8for the year ended 31 March <strong>2012</strong>Goods and servicesNote <strong>2011</strong>/12 2010/11R’000 R’000Administrative fees 2 467 5Advertising 6 498 5 783Assets less then R5,000 4.1 368 56Bursaries (employees) 807 758Catering 8 361 6 850Communication 4 448 10 536Computer services 4.2 5 742 3 209Consultants, contractors and agency/outsourced services 4.3 29 656 14 845Entertainment - 5Audit cost – external 4.4 2 239 2 015Fleet services 1 -Inventory 4.5 4 174 6 730Operating leases 14 150 13 935Property payments 4.6 5 249 7 707Travel and subsistence 4.7 28 640 37 251Venues and facilities 3 854 3 674Training and staff development 2 528 5 395Other operating expenditure 4.8 8 150 2Total 127 332 118 7564.1 Assets less than R5,0004 R’000 R’000Tangible assetsMachinery and equipment 368 56Total 368 564.2 Computer servicesNote <strong>2011</strong>/12 2010/114 R’000 R’000External computer service providers 5 742 3 209Total 5 742 3 2094.3 Consultants, contractors and agency/outsourced services<strong>2011</strong>/12 2010/114 R’000 R’000Business and advisory services 2 188 1 290Legal costs 1 224 734Contractors 24 155 5 613Agency and support/outsourced services 2 089 7 208Total 29 656 14 845
NOTES TO THE ANNUAL STATEMENTS - VOTE 8for the year ended 31 March <strong>2012</strong>4.4 Audit cost – ExternalNote <strong>2011</strong>/12 2010/114 R’000 R’000Regularity audits 2 239 2 015Total 2 239 2 0154.5 InventoryNote <strong>2011</strong>/12 2010/114 R’000 R’000Learning and teaching support material - 180Food and food supplies 24 33Fuel, oil and gas 8 8Other consumable materials 1 931 4 171Materials and supplies 378 284Stationery and printing 1 825 1 968Medical supplies - 8Military stores 8 78Total 4 174 6 7304.6 Property paymentsNote <strong>2011</strong>/12 2010/114 R’000 R’000Municipal services 2 618 672Other 2 631 7 035Total 5 249 7 7074.7 Travel and subsistenceNote <strong>2011</strong>/122010/11R’000R’000Domestic travel costs 27 995 37 251International travel costs 645 -Total 28 640 37 2514.8 Other operating expenditureNote <strong>2011</strong>/12 2010/114 R’000 R’000Professional bodies, membership and subscription fees 1 1Resettlement costs 48 -Other 8 101 1Total 8 150 2126 | <strong>Annual</strong> <strong>Report</strong> <strong>2011</strong>/12 • Department of <strong>Community</strong> <strong>Safety</strong>
NOTES TO THE ANNUAL STATEMENTS - VOTE 8for the year ended 31 March <strong>2012</strong>Interest and rent on landNote <strong>2011</strong>/12 2010/11R’000 R’000Interest paid 14 853 7 047Total 14 853 7 047Payments for financial assetsNote <strong>2011</strong>/12 2010/11R’000 R’000Debts written off 6.1 237 100Total 237 1006.1 Debts written offNote <strong>2011</strong>/12 2010/116 R’000 R’000Nature of debts written offEx-employees 75 100Suppliers 162 -Total debt written off 237 100Transfers and subsidiesNote <strong>2011</strong>/12 2010/11R’000 R’000Public corporations and private enterprises Annex 1E 761 562Households Annex 1H 1 146 1 668Total 1 907 2 230Expenditure for capital assetsNote <strong>2011</strong>/12 2010/11R’000 R’000Tangible assets 21 063 32 937Machinery and equipment 8.1 21 063 32 937Software and other intangible assets - 62Computer software 8.2 - 62Total 21 063 32 999
NOTES TO THE ANNUAL STATEMENTS - VOTE 8for the year ended 31 March <strong>2012</strong>8.1 Analysis of funds utilised to acquire capital assets – <strong>2011</strong>/12Voted funds Aid assistance TotalR’000 R’000 R’000Tangible assets 21 063 - 21 063Machinery and equipment 21 063 - 21 063Total 21 063 - 21 638.2 Analysis of funds utilised to acquire capital assets – 2010/11Voted funds Aid assistance TotalR’000 R’000 R’000Tangible assets 32 937 32 937Machinery and equipment 32 937 - 32 937Software and other intangible assets 62 62Computer software 62 - 62Total 32 999 - 32 999Unauthorised expenditure9.1 Reconciliation of unauthorised expenditureNote <strong>2011</strong>/12 2010/11R’000 R’000Opening balance 9.2 29 742 25 456Unauthorised expenditure – discovered in- 7 141current yearLess: Amounts approved by Parliament/Legislature with funding- (2 855)Unauthorised expenditure awaitingauthorisation / written off29 742 29 7429.2 Analysis of unauthorised expenditure awaiting authorisation per economic classification<strong>2011</strong>/12 2010/11R’000 R’000Current 28 905 28 905Capital 837 837Total 29 742 29 742128 | <strong>Annual</strong> <strong>Report</strong> <strong>2011</strong>/12 • Department of <strong>Community</strong> <strong>Safety</strong>
NOTES TO THE ANNUAL STATEMENTS - VOTE 8for the year ended 31 March <strong>2012</strong>9.3 Analysis of unauthorised expenditure awaiting authorisation per typeUnauthorised expenditure relating tooverspending of the vote or a main division<strong>2011</strong>/12 2010/11R’000 R’00029 742 29 742Total 29 742 29 742Fruitless and wasteful expenditure10.1 Reconciliation of fruitless and wasteful expenditure<strong>2011</strong>/12 2010/11R’000 R’000Opening balance 326 326Fruitless and wasteful expenditure awaiting condonement 326 326Analysis of awaiting condonement per economicCurrent 326 326Total 326 326Cash and cash equivalentsNote <strong>2011</strong>/12 2010/11R’000 R’000Disbursements - 13Cash on hand 25 29Total 25 42Prepayments and advancesNote <strong>2011</strong>/12 2010/11R’000 R’000Travel and subsistence - 14Total - 14
NOTES TO THE ANNUAL STATEMENTS - VOTE 8for the year ended 31 March <strong>2012</strong>ReceivablesNote<strong>2011</strong>/12 2010/11R’000 R’000 R’000 R’000 R’000Less than one One to three Older than Total Totalyear years three yearsClaims recoverable 13.1Annex 470 - - 70 -Staff debt 77 162 23 262 392Other debtors 1 - - 1 24Total 148 162 23 333 41613.1 Claims recoverableNote <strong>2011</strong>/12 2010/1113 R’000 R’000National departments 36 -Provincial departments 34 -Total 70 -13.2 Staff debtNote <strong>2011</strong>/12 2010/1113 R’000 R’000Employees 8 17Ex-employees 254 180Suppliers - 195Total 262 39213.3 Other debtorsNote <strong>2011</strong>/12 2010/1113 R’000 R’000Sal: Reversal Control: CA - 21Sal: Tax Debt 1 1Sal: Medical Aid - 2Total 1 24130 | <strong>Annual</strong> <strong>Report</strong> <strong>2011</strong>/12 • Department of <strong>Community</strong> <strong>Safety</strong>
NOTES TO THE ANNUAL STATEMENTS - VOTE 8for the year ended 31 March <strong>2012</strong>Voted funds to be surrendered to the Revenue Fund<strong>2011</strong>/12 2010/11R’000 R’000Opening balance 326 326Transfer from statement of financial performance 23 125 (7 141)Closing balance 23 451 326Departmental revenue and to be surrendered to the Revenue Fund<strong>2011</strong>/12 2010/11R’000 R’000Opening balance 3 024 374Transfer from Statement of Financial Performance 13 781 11 848Paid during the year (13 592) (9 198)Closing balance 3 213 3 024Bank OverdraftNote <strong>2011</strong>/12 2010/11R’000 R’000Consolidated Paymaster General Account 3 347 12 603Total 3 347 12 603Payables – currentNote <strong>2011</strong>/12 2010/11TotalTotalAmounts owing to other entities Annex 5 - 10 643Other payables 17.1 415 3 944Total 415 14 587
NOTES TO THE ANNUAL STATEMENTS - VOTE 8for the year ended 31 March <strong>2012</strong>17.1 Other payablesNote <strong>2011</strong>/12 2010/1117 R’000 R’000Description(Identify major categories, but list material amounts)Cheques Payable: Dom - 127Sal: ACB Recalls: CA 5 5Debt Receivable Income: CA 9 56Debt Receivable Interest: CA 14 55Sal: Persal EBT Control Acc: Dom 23 -Sal: Income Tax: CL - 2 678Sal: Finance Other Institutions - 3Sal: Pension Fund: CL - 1 020Outstanding Payments 334 -Disallowance Miscellaneous : CA 29 -Sal: Garnishee Order : CL 1 -Total 415 3 944Net cash flow available from operating activitiesNote <strong>2011</strong>/12 2010/11R’000 R’000Net surplus/(deficit) as per Statement of Financial Performance 36 906 4 707Add back non cash/cash movements not deemed operating activities (6 604) 5 528(Increase)/decrease in receivables – current 83 177(Increase)/decrease in prepayments and advances 14 (14)(Increase)/decrease in other current assets - 2 855Increase/(decrease) in payables – current (14 172) (21 291)Expenditure on capital assets 21 063 32 999Surrenders to Revenue Fund (13 592) (9 198)Net cash flow generated by operating activities 30 302 10 235132 | <strong>Annual</strong> <strong>Report</strong> <strong>2011</strong>/12 • Department of <strong>Community</strong> <strong>Safety</strong>
NOTES TO THE ANNUAL STATEMENTS - VOTE 8for the year ended 31 March <strong>2012</strong>Reconciliation of cash and cash equivalents for cash flow purposesNote <strong>2011</strong>/12 2010/11R’000 R’000Consolidated Paymaster General account (3 347) (12 603)Disbursements - 13Cash on hand 25 29Total (3 322) (12 561)
DISCLOSURE NOTES TO THE ANNUAL STATEMENTS - VOTE 8for the year ended 31 March <strong>2012</strong>These amounts are not recognised in the <strong>Annual</strong> Financial Statements and are disclosed to enhance the usefulness of the<strong>Annual</strong> Financial Statements.Contingent liabilities and contingent assets20.1 Contingent liabilitiesNote <strong>2011</strong>/12 2010/11R’000 R’000Liable to NatureHousing loan guarantees Employees Annex 3A 72 57Claims against the department Annex 3B 13 668 9 766Other departments (interdepartmental unconfirmed balances) Annex 5 - 1 715Total 13 740 11 538CommitmentsNote <strong>2011</strong>/12 2010/11R’000 R’000Current expenditureApproved and contracted 10 654 19 144Approved but not yet contracted 7 599 -18 253 19 144Capital expenditureApproved and contracted 408 4 632408 4 632Total Commitments 18 661 23 776Accruals<strong>2011</strong>/12 2010/11R’000 R’000Listed by economic classification30 Days 30+ Days Total TotalGoods and services 9 393 661 10 054 6 749Capital assets - 150 150 -Total 9 393 811 10 204 6 749134 | <strong>Annual</strong> <strong>Report</strong> <strong>2011</strong>/12 • Department of <strong>Community</strong> <strong>Safety</strong>
Note <strong>2011</strong>/12 2010/11R’000 R’000Listed by programme levelAdministration 1 376 1 068Civilian Oversight 108 107Crime Prevention and <strong>Community</strong> Police Relations 615 1 396Traffic Management 8 105 4 178Total 10 204 6 749Note <strong>2011</strong>/12 2010/11R’000 R’000Confirmed balances with other departments Annex 5 8 112 12 564Total 8 112 12 564Employee benefitsNote <strong>2011</strong>/12 2010/11R’000 R’000Leave entitlement 13 031 8 780Service bonus (Thirteenth cheque) 6 788 5 837Performance awards 3 629 1 544Capped leave commitments 13 113 12 700Total 36 561 28 861Lease commitments24.1 Operating leases expenditure<strong>2011</strong>/12 SpecialisedLand Buildings and other Machinery andTotalmilitary equipmentfixed structures equipmentNot later than 1 year - - 8 820 33 177 41 997Later than 1 year and not- - 31 664 2 277 33 941later than 5 yearsTotal leasecommitments- - 40 484 35 454 75 9382010/11 Specialisedmilitary equipment- -Land Buildings and otherfixed structuresMachinery andequipmentTotalNot later than 1 year11 845 737 12 582Later than 1 year and not- - 25 291 97 25 388later than 5 yearsTotal lease - - 37 136 834 37 970
DISCLOSURE NOTES TO THE ANNUAL STATEMENTS - VOTE 8for the year ended 31 March <strong>2012</strong>24.2 Finance leases expenditure<strong>2011</strong>/12 Specialised militaryequipmentLand Buildings and otherfixed structuresMachinery andequipmentNot later than 1 year - - - 11 153 11 153Later than 1 year and not- - - 33 507 33 507later than 5 yearsTotal present valueof lease liabilities- - - 44 660 44 6602010/11 Specialised militaryequipmentLand Buildings and otherfixed structuresMachinery andequipmentNot later than 1 year - - - 24 409 24 409Later than 1 year and not- - - 18 491 18 491later than 5 yearsTotal present valueof lease liabilities- - - 42 900 42 900Receivables for departmental revenueNote <strong>2011</strong>/12 2010/11R’000 R’000Fines, penalties and forfeits 54 372 33 142Total 54 372 33 142TotalTotal25.1 Analysis of receivables for departmental revenueNote <strong>2011</strong>/12 2010/1125 R’000 R’000Opening balance 33 142 21 316Less: amounts received 2 909 3 648Add: amounts recognised 24 895 17 170Less: amounts written-off/reversed as irrecoverable 756 1 696Closing balance 54 372 33 14225.2 Receivables for department revenue written offNote <strong>2011</strong>/12 2010/11R’000 R’000Nature of lossesAARTO Traffic Fines 756 1 696Total 756 1 696136 | <strong>Annual</strong> <strong>Report</strong> <strong>2011</strong>/12 • Department of <strong>Community</strong> <strong>Safety</strong>
DISCLOSURE NOTES TO THE ANNUAL STATEMENTS - VOTE 8for the year ended 31 March <strong>2012</strong>Irregular expenditure26.1 Reconciliation of irregular expenditureNote <strong>2011</strong>/12 2010/11R’000 R’000Opening balance 513 513Add: Irregular expenditure - relating to current year 6 398 -Irregular expenditure awaiting condonation 6 911 513Analysis of awaiting condonation per age classificationCurrent year -Prior years 513 513Total 513 513Details of irregular expenditure condonedIndident Condoned by accounting officer Note <strong>2011</strong>/12 2010/11R’000 R’000Payment of patrollers deployed at various schools in <strong>Gauteng</strong> 2 345 -Payment of catering seervices at Ikhaya Lethemba 3 482 -Payment of catering services at theTraffic Training College 517 -Total 6 398 -Fruitless and wasteful expenditure27.1 Reconciliation of fruitless and wasteful expenditureNote <strong>2011</strong>/12 2010/11R’000 R’000Opening balance - 191Less: Amounts condoned - (191)Fruitless and wasteful expenditure awaiting condonement - -Related party transactionsPayments made Note <strong>2011</strong>/12 2010/11R’000 R’000Goods and services 56 392 -Interest 14 853 -Purchase of capital assets 10 206 -Total 81 451 -The department has a related party transaction with Department of Infrastructure and Development (DID) relating to paymentof rental, rates and taxes, security and cleaning services for the building occupied by the department at 78 Fox Street. Thisbuilding is on the asset register of DID because they are the custodian of the building. The department is not in a position todisclose an amount that DID pays on our behalf because the building is occupied by various departments and DID makes asingle payment to the landlord for the entire building.
DISCLOSURE NOTES TO THE ANNUAL STATEMENTS - VOTE 8for the year ended 31 March <strong>2012</strong>The department has a related party transaction with <strong>Gauteng</strong> Department of Education (GDE) relating to the School <strong>Safety</strong>Programme, whereby patrollers from the department are deployed to problematic schools that were identified by GDE torender security services as part of the contribution to the Job Creation programme as pronounced by the President. Thetransaction is at arm’s length.The department has a related party transaction with G-fleet for vehicles that were leased by the department. The Departmenthas vehicles on lease on the Full maintenance model, which is on Finance Lease and vehicles on the normal lease which ison operating leases. These vehicles are used as a tool of trade, by the Department in dispensing its mandate.Key management personnelNo. ofIndividuals<strong>2011</strong>/12R’0002010/11R’000Political office bearers (provide detail below)Officials: 1 1 521 1 540Level 15 to 161 911 1 3822Level 14 (incl. CFO if at a lower level) 22 16 181 15 003Total 19 613 17 925Movable Tangible Capital AssetsMOVEMENT IN MOVABLE TANGIBLE CAPITAL ASSETS PER ASSET REGISTER FOR THE YEAR ENDED 31 MARCH <strong>2012</strong>Opening balance Curr YearAdjust-mentsAdditions Disposals ClosingBalanceto prior yearbalancesR’000 R’000 R’000 R’000 R’000MACHINERY AND EQUIPMENT 84 544 (31 467) 10 346 8 406 55 017Transport assets 40 052 (31 202) 7 527 6 186 10 191Computer equipment 19 866 (374) 1 564 1 868 19 188Furniture and office equipment 6 649 300 453 289 7 113Other machinery and equipment 17 977 (191) 802 63 18 525TOTAL MOVABLE TANGIBLECAPITAL ASSETS 84 544 (31 467) 10 346 8 406 55 017138 | <strong>Annual</strong> <strong>Report</strong> <strong>2011</strong>/12 • Department of <strong>Community</strong> <strong>Safety</strong>
DISCLOSURE NOTES TO THE ANNUAL STATEMENTS - VOTE 8for the year ended 31 March <strong>2012</strong>30.1 AdditionsADDITIONS TO MOVABLE TANGIBLE CAPITAL ASSETS PER ASSET REGISTER FOR THE YEAR ENDED 31 MARCH <strong>2012</strong>Cash Non-cash (Capital Work in Received current,TotalProgress current not paidcosts and financelease payments) (Paid currentyear, receivedprior year)R’000 R’000 R’000 R’000 R’000MACHINERY AND20 386 16 (10 206) 150 10 346EQUIPMENTTransport assets 17 733 - (10 206) - 7 527Computer equipment 1 414 - - 150 1 564Furniture and office equipment 437 16 - - 453Other machinery and equipment 802 - - - 802TOTAL ADDITIONS TOMOVABLE TANGIBLECAPITAL ASSETS 20 386 16 (10 206) 150 10 34630.2 DisposalsDISPOSALS OF MOVABLE TANGIBLE CAPITAL ASSETS PER ASSET REGISTER FOR THE YEAR ENDED 31 MARCH <strong>2012</strong>Sold for cash Transfer out ordestroyed orTotal disposalsCash ReceivedActualscrappedR’000 R’000 R’000 R’000- 8 406 8 406 -Transport assets - 6 186 6 186 -Computer equipment - 1 868 1 868 -Furniture and office equipment - 289 289 -Other machinery and equipment - 63 63 -TOTAL DISPOSAL OF MOVABLETANGIBLE CAPITAL ASSETS - 8 406 8 406 -30.3 Movement for 2010/11MOVEMENT IN MOVABLE TANGIBLE CAPITAL ASSETS PER ASSET REGISTER FOR THE YEAR ENDED 31 MARCH <strong>2011</strong>Opening balance Additions Disposals Closing balanceR’000 R’000 R’000 R’000MACHINERY AND EQUIPMENT 51 643 33 838 937 84 544Transport assets 7 341 32 711 - 40 052Computer equipment 20 117 648 899 19 866Furniture and office equipment 6 597 52 - 6 649Other machinery and equipment 17 588 427 38 17 977TOTAL MOVABLE TANGIBLE ASSETS 51 643 33 838 937 84 544
DISCLOSURE NOTES TO THE ANNUAL STATEMENTS - VOTE 8for the year ended 31 March <strong>2012</strong>30.4 Minor assetsMOVEMENT IN MINOR ASSETS PER THE ASSET REGISTER FOR THE YEAR ENDED AS AT 31 MARCH <strong>2012</strong>Specialisedmilitary assetsIntangibleassetsHeritageassetsMachinery andequipmentBiologicalassetsTotalR’000 R’000 R’000 R’000 R’000 R’000Opening balance - - - 19 916 - 19 916Additions - - - 449 - 449Disposals 1 483 - 1 483TOTAL MINORASSETS - - - 18 882 - 18 882Number of minorassets at costSpecialised Intangible Heritage assets Machinery and Biological Totalmilitary assets assetsequipment assets- - - 15 511 - 15 511TOTAL NUMBEROF MINOR ASSETS - - - 15 511 - 15 511MOVEMENT IN MINOR ASSETS PER THE ASSET REGISTER FOR THE YEAR ENDED AS AT 31 MARCH <strong>2011</strong>Specialised Intangible Heritage assets Machinery and Biological Totalmilitary assets assetsequipment assetsR’000 R’000 R’000 R’000 R’000 R’000Opening balance - - - 20 257 - 20 257Curr Year Adjustments- - - 208 - 208to PrioAdditions - - - 46 - 46Disposals - - - 595 - 595TOTAL MINORASSETS - - - 19 916 19 916Number of minorassets at costTOTAL NUMBEROF MINOR ASSETSSpecialisedmilitary assetsIntangibleassetsHeritage assetsMachinery andequipmentBiologicalassetsTotal- - - 15 442 - 15 442- - - 15 442 - 15 442140 | <strong>Annual</strong> <strong>Report</strong> <strong>2011</strong>/12 • Department of <strong>Community</strong> <strong>Safety</strong>
DISCLOSURE NOTES TO THE ANNUAL STATEMENTS - VOTE 8for the year ended 31 March <strong>2012</strong>Intangible Capital AssetsMOVEMENT IN INTANGIBLE CAPITAL ASSETS PER ASSET REGISTER FOR THE YEAR ENDED 31 MARCH <strong>2012</strong>Opening Current Year Additions Disposals Closing Balancebalance Adjust-mentsto prior yearbalancesR’000 R’000 R’000 R’000 R’000COMPUTER SOFTWARE 15 569 - - - 15 569TOTAL INTANGIBLE CAPITAL ASSETS 15 569 - - - 15 56931.1. Movement for 2010/11MOVEMENT IN INTANGIBLE CAPITAL ASSETS PER ASSET REGISTER FOR THE YEAR ENDED 31 MARCH <strong>2011</strong>Opening balance Additions Disposals Closing balanceR’000 R’000 R’000 R’000COMPUTER SOFTWARE 19 222 62 3 715 15 569TOTAL INTANGIBLE CAPITAL ASSETS 19 222 62 3 715 15 569
ANNEXURES TO THE FINANCIAL STATEMENTS - VOTE 8for the year ended 31 March <strong>2012</strong>UNAUDITED: ANNEXURE 1ESTATEMENT OF TRANSFERS/SUBSIDIES TO PUBLIC CORPORATIONS AND PRIVATE ENTERPRISESNAME OF PUBLICCORPORATION/PRIVATE ENTERPRISEPublic CorporationsAdjustedAppropriationActTRANSFER ALLOCATION EXPENDITURE 2010/11RollOversAdjustments TotalAvailableActualTransfer% ofAvailablefundsTransferredCapital Current AppropriationActR’000 R’000 R’000 R’000 R’000 % R’000 R’000 R’000TransfersAmalgamated Bank of South Africa800 (39) 761 761 100% - 761 562Total 800 - (39) 761 761 100% - 761 562UNAUDITED : ANNEXURE 1HSTATEMENT OF TRANSFERS TO HOUSEHOLDSTransfersHOUSEHOLDSAdjustedAppropriationActTRANSFER ALLOCATION EXPENDITURE 2010/11RollOversAdjust-ments TotalAvailable ActualTransfer% ofAvailable fundsTransferred Appro-priationActR’000 R’000 R’000 R’000 R’000 % R’000Injury on duty 562 - 584 1 146 1 146 100% 1 666Total 562 - 584 1 146 1 146 100% 1 666142 | <strong>Annual</strong> <strong>Report</strong> <strong>2011</strong>/12 • Department of <strong>Community</strong> <strong>Safety</strong>
UNAUDITED : ANNEXURE 3ASTATEMENT OF FINANCIAL GUARANTEES ISSUED AS AT 31 MARCH <strong>2012</strong> – LOCALGuarantorinstitutionGuarantee inrespect ofOriginalguaranteedcapitalamountOpeningbalance1 April <strong>2011</strong>Guaranteesdraw downsduring theyearGuaranteesrepayments/cancelled/reduced/releasedduring theyearRevaluations Closingbalance31 March<strong>2012</strong>Guaranteedinterest foryear ended 31March <strong>2012</strong>Realisedlosses notrecoverablei.e. claimspaid outR’000 R’000 R’000 R’000 R’000 R’000 R’000 R’000Standard Bank - 13 7 - - 20 - -ABSA - 30 - 30 - - - -Peoples Bank - 14 - - - 14 - -Nedbank - - 38 - - 38 - -TOTAL - 57 45 30 - 72 - -UNAUDITED: ANNEXURE 3BSTATEMENT OF CONTINGENT LIABILITIES AS AT 31 MARCH <strong>2012</strong>Nature of Liability Opening BalanceClaims against the department1 April <strong>2011</strong>R’000Liabilities incurred duringthe yearLiabilities paid/cancelled/reduced during the yearLiabilities recoverable(Provide details hereunder)R’000 R’000 R’000Closing Balance31 March <strong>2012</strong>Claims for breach of contract 1 503 - - - 1 503Claims for damages as a result of motor722 229 - - 951vehicle accidentClaims for unlawful arrest and detention7 5413 9351 010- 10 466R’000Claims for impoundment of motor vehicle748748Subtotal 9 766 4 912 1 010 - 13 668--ANNEXURES TO THE FINANCIAL STATEMENTS - VOTE 8for the year ended 31 March <strong>2012</strong>
ANNEXURES TO THE FINANCIAL STATEMENTS - VOTE 8for the year ended 31 March <strong>2012</strong>UNAUDITED: ANNEXURE 4CLAIMES RECOVERABLEGOVERNMENT ENTITYDepartmentConfirmed balance outstanding Unconfirmed balance outstanding Total31/03/<strong>2012</strong> 31/03/<strong>2011</strong> 31/03/<strong>2012</strong> 31/03/<strong>2011</strong> 31/03/<strong>2012</strong> 31/03/<strong>2011</strong>R’000 R’000 R’000 R’000 R’000 R’000Amounts not in the Statement of Financial PositionDepartment of Transport and Roads (<strong>Gauteng</strong>) 2 325 1 287 - - 2 325 1 287Road Traffic Management Corporation (National) 1 566 378 - 221 1 566 599Department of Defence ( National) 8 - - - 8 -Office of the Chief Justice 36 - - - 36 -Department HEALTH AND SOCIAL Development (<strong>Gauteng</strong>) 34 - - - 34 -Total 3 969 1 665 - 221 3 969 1 886144 | <strong>Annual</strong> <strong>Report</strong> <strong>2011</strong>/12 • Department of <strong>Community</strong> <strong>Safety</strong>
ANNEXURES TO THE FINANCIAL STATEMENTS - VOTE 8for the year ended 31 March <strong>2012</strong>UNAUDITED: ANNEXURE 5INTER-GOVERNMENT PAYABLESGOVERNMENT ENTITYDEPARTMENTSCurrentAmounts included in the Statement of Financial PositionConfirmed balance outstanding Unconfirmed balance outstanding TOTAL31/03/<strong>2012</strong> 31/03/<strong>2011</strong> 31/03/<strong>2012</strong> 31/03/<strong>2011</strong> 31/03/<strong>2012</strong> 31/03/<strong>2011</strong>R’000 R’000 R’000 R’000 R’000 R’000Government Garage Transport (<strong>Gauteng</strong>) 7 819 10 643 - 1 561 7 819 12 204Department of Finance (<strong>Gauteng</strong> 21 1 612 - - 21 1 612Department of Justice and Constitutional Development 74 36 - - 74 36Palama Trading Entity (National) - 53 - - - 53Department of Infrastructure Development (<strong>Gauteng</strong>) - 220 - 140 - 360South African Police Services (National) 2 - - - 2 -Department of Performance monitoring and Evaluations 3 - - - 3 -Government Printing Works 193 - - 14 193 14Total 8 112 12 564 - 1 715 8 112 14 279UNAUDITED: ANNEXURE 6INVENTORYInventory Note Quantity <strong>2011</strong>/12 Quantity 2010/11R’000 R’000Opening balance 340 2 196 379 2 737Add/(Less): Adjustments to prior year balance - - - -Add: Additions/Purchases – Cash 66 886 27 1 231Add: Additions - Non-cash - - - -(Less): Disposals - - - -(Less): Issues (89) (1 794) (92) (1 776)Add/(Less): Adjustments - - 26 4Closing balance 317 1 288 340 2 196
HUMAN RESOURCE MANAGEMENT04Service deliveryExpenditureEmployment and VacanciesJob EvaluationEmployment changesEmployment equityPerformance rewardsForeign workersLeave utilisation for the period 1 January <strong>2011</strong> to 31 December <strong>2011</strong>HIV and AIDS & health promotion programmesLabour relationsSkills developmentInjury on dutyUtilisation of consultants146 | <strong>Annual</strong> <strong>Report</strong> <strong>2011</strong>/12 • Department of <strong>Community</strong> <strong>Safety</strong>
4. HUMAN RESOURCE MANAGEMENTService deliveryTable 1.1 - Main services provided and standardsMain services Actual customers Potential customers Standard of service Actual achievement againststandardsComplaints managementAll complainants alleging policeinefficiencyAll persons who areaware of the servicesrendered by theDepartmentAll complaints lodged withthe Department will beresolved within a monthReceived, investigated and finalized390 complaints against LawEnforcement Agencies in the province167 fraud and corruption cases werereceived and investigated. Of the167 cases, 60 cases were finalized,107 cases were carried over to thefinancial year <strong>2012</strong>/2013.<strong>Community</strong> patrollerprogrammeTraffic law enforcementand road safety educationMembers of the public inall areas where communitypatrollers are being deployedAll road users in <strong>Gauteng</strong>province e.g motorists,pedestrians and cyclistsAll persons who areaware of the servicesrendered by theDepartmentAll persons who areaware of the servicesrendered by theDepartmentThe Department hasmanaged to curb theincidence of vandalism andtheft of computers in theidentified schoolsReduce the number ofroad accidents fatalitiesby 10%4188 patrollers were deployed in398 schools.375 road safety awarenesscampaigns were conducted by theDepartment in the previous yearfocusing primarily on the safe usageof the road and distribution of roadsafety hints to different road usercategories, ie. Pedestrians, drivers,cyclists and passengers.Over and above this, there was a4.46% reduction in road fatalities.Victim empowermentservicesAll victims of crime, especiallypersons who have fallenvictims of crime againstwomen and childrenAll persons who areaware of the servicesrendered by theDepartmentStreamlining of VictimEmpowerment services toNational VEP Norms andStandards and Victim’sCharterAll services offered met standards ofNational VEP Norms and Standardsas well as Victim’s Charter.1215 adults and 482 minorsaccessed services.12600 victims serviced at 134Victim Empowerment Centers.1800 victims serviced at RegionalVictim Offices.A number of 259 volunteers andrelated service providers on setstandards of victim empowermentservices.Human Resource Management • <strong>Annual</strong> <strong>Report</strong> <strong>2011</strong>/12 |147
Table 1.2 - Consultation arrangements with customersType of arrangement Actual customer Potential customer Actual achievementsPublic meetingsizimbizoRoad safety educationalprogrammesAll Citizens within <strong>Gauteng</strong> All citizen in <strong>Gauteng</strong> 130 CPF public meetings conducted/supported20 izimbizo2 144 road safety educationalprogrammes conductedVEC marketing by volunteers at 134SAPSAll citizens in <strong>Gauteng</strong> that are director indirect victims of crimeAll citizens in <strong>Gauteng</strong> that are director indirect victims of crime1215 adults and 487 children atIkhaya Lethemba service site.Provincial Izimbizo’sDepartmental SMS lineMarketing by NGO’s linked to IkhayaLethemba VE –ProgrammeAn average of 1200 victimsreceived VE services per month at134 VEC and 3 RVO sites around<strong>Gauteng</strong>.Table 1.3 - Service delivery access strategyAccess strategyActual achievementsFaxes18 faxesEmail49 emailsMailed letter14 mailed lettersMedia3 mediaGPG website 1SMS service31 SMS’s were received on the Police and referred to Monitoring33 SMS’s were on Abuse and referred to Ikhaya LethembaPresidential , Premiers Hotline and MECsWalk in serviceTelephoneRegional officesName tags are worn by all traffic officials and road safetyofficersThe <strong>Gauteng</strong> Traffic police proactively conducts visits todifferent areas to educate different road user categories i.etaxi ranks, schools, churches and community centresThe use of marked vehiclesIkhaya Lethemba 24 hours open for clients and stakeholdersreferralsSMS line available 24 hrs, 7 days a weekVEC’s offers a minimum of 8 hours services per day6 SMS’s were received on Corruption and referred to Anti-corruption100 Presidential and Premiers Hotline149 walk in42 telephone callsClear signage at all traffic regional officesName tags are worn by all traffic and road safety officersOver 200 areas visitedTraffic vehicles are marked1215 Adults and 482 minors accessed services12600 victims serviced at 134 Victim Empowerment Centers1800 victims serviced at Regional Victim OfficesRVO’s functional during office hours148 | <strong>Annual</strong> <strong>Report</strong> <strong>2011</strong>/12 • Department of <strong>Community</strong> <strong>Safety</strong>
Table 1.4 - Service information toolType of information toolInformation with regards to services is provided through the following:••TV programme••Pamphlets••Walk in service••Fax or email••VECs••RVOs••Posters••Pamphlets on Victim Empowerment (VEP) services published &distributedWith regards to road safety, pamphlets, leaflets and workbooks for schools<strong>Annual</strong> reportBudget speechVEP manuals, pamphlets, leafletsActual achievementsThe actual achievement is explained in detail under item 2.2 ProgrammePerformance with special reference to programme 2, 3 and 4.Over 10000 copies distributed.2000 copies corporate version.4000 copies community version in 4 languages.100 copies in Braille.2000 copies corporate version.4000 copies community version in 4 languages.259 VEP manuals.500 pamphlets’ and leaflets distributed.Table 1.5 - Complaint mechanismComplaint mechanismAnti Corruption hotlineActual achievementsReceived, investigated and finalized 390 complaints against LawEnforcement Agencies in the province.Street pole advertising with a sms number 32026 and the keywords attachedto the sms number are: Bribe, Police and Abuse to encourage communityfeedback and participation167 fraud and corruption cases were received and investigated. Of the 167The department has received 70 sms’s:••31 SMS’s were received on the Police and referred to Monitoring;••33 SMS’s were on Abuse and referred to Ikhaya Lethemba; and,••6 SMS’s were received on Corruption and referred to Anti corruptionHuman Resource Management • <strong>Annual</strong> <strong>Report</strong> <strong>2011</strong>/12 |149
ExpenditureTable 2.1 - Personnel costs by programme, <strong>2011</strong>/12ProgrammeTotal votedexpenditure(R’000)Personnelexpenditure(R’000)Trainingexpenditure(R’000)Professional andspecial services(R’000)Personnel cost aspercent of totalexpenditureAveragepersonnel costper employee(R’000)Grl: Administration 52 963 31 874 0 0 60.2 34Grl:Civilian Oversight 13 060 11 276 0 0 86.3Grl:Crime Prevention & <strong>Community</strong>Police Relations 83 118 22 414 0 0 27 24Grl:Traffic Management 251 481 169 666 0 0 67.5 181Z=Total as on FinancialSystems (BAS) 400 622 235 230 0 0 58.7 25112Table 2.2 - Personnel costs by salary band, <strong>2011</strong>/12Salary bands Personnel expenditure (R’000) % of total personnel cost Average personnel cost peremployee (R)Lower skilled (Levels 1-2) 3 246 1.3 101 438Skilled (Levels 3-5) 16 148 6.6 133 361Highly skilled production (Levels 6-8) 140 523 57.2 223 763Highly skilled supervision (Levels 9-12) 44 011 17.9 407 509Senior management (Levels 13-16) 15260 6.2 693 636Contract (Levels 3-5) 497 0.2 71 000Contract (Levels 6-8) 2 142 0.9 267 750Contract (Levels 9-12) 2 244 0.9 374 000Contract (Levels 13-16) 3 005 1.2 1 001 667Periodical Remuneration 8 0 4 000Abnormal Appointment 8 146 3.3 69 203Total 235230 98.1 222 756150 | <strong>Annual</strong> <strong>Report</strong> <strong>2011</strong>/12 • Department of <strong>Community</strong> <strong>Safety</strong>
Table 2.3 - Salaries, Overtime, Home Owners Allowance and Medical Aid by programme, <strong>2011</strong>/12Programme Salaries Overtime Home owners allowance Medical assistanceAmount (R’000) Salaries as % ofpersonnel costAmount (R’000) Overtime as % ofpersonnel costAmount (R’000) HOA as % ofpersonnel costAmount. (R’000) Medical Ass. as %of personnel costPr1: management &administration 21557 63.3 17 0.1 653 2 1234 3.7Pr2: civilian & oversight 7835 41.3 0 0 217 1.1 449 2.4Pr3: Crm prvntn and comty polcrlts 14983 55.6 93 0.3 446 1.7 1297 4.8Pr4: traffic management 107570 66.4 11064 6.8 5797 3.6 12569 7.8Total 151545 62.8 11174 4.6 7113 2.9 15549 6.4** The alignment according to budget structure happened during the course of <strong>2011</strong>/12 for some directorates within theformer Promotion of <strong>Safety</strong>Table 2.4 - Salaries, Overtime, Home Owners Allowance and Medical Aid by salary bands, <strong>2011</strong>/12Salary bands Salaries Overtime Home owners allowance Medical assistanceAmount (R’000) Salaries as % ofpersonnel costAmount (R’000) Overtime as % ofpersonnel costAmount(R’000) HOA as % ofpersonnel costAmount (R’000) Medical ass. as %of personnel costLower skilled (Levels 1-2) 2088 62.1 2 0.1 279 8.3 489 14.5Skilled (Levels 3-5) 10223 62.7 244 1.5 1072 6.6 1889 11.6Highly skilled production (Levels 6-8) 89508 61.4 10136 7 5099 3.5 11131 7.6Highly skilled supervision (Levels 9-12) 29450 62 790 1.7 533 1.1 1676 3.5Senior management (Levels 13-16) 13255 80.5 0 0 95 0.6 301 1.8Contract (Levels 3-5) 410 82.5 0 0 10 2 27 5.2Contract (Levels 6-8) 2059 95.9 0 0 12 0.6 6 0.1Contract (Levels 9-12) 1961 86 2 0.1 1 0 30 1.3Contract (Levels 13-16) 2591 86.2 0 0 12 0.4 0 0Total 15145 62.8 11174 4.6 7113 2.9 15549 6.4Human Resource Management • <strong>Annual</strong> <strong>Report</strong> <strong>2011</strong>/12 |151
Employment and vacanciesTable 3.1 - Employment and vacancies by programme, 31 March <strong>2012</strong>Programme Number of posts Number of posts filled Vacancy rate Number of posts filled additional to theestablishmentGrl: promotion of safety, Permanent 10 9 10 0Grl:crm prvntn & comty polc rlts, Permanent 2 2 0 0Pr1: managememt & administration, Permanent 163 99 39.3 1Pr2: safety promotion, Permanent 123 87 29.3 8Pr3: civilian & oversight, Permanent 62 52 16.1 0Pr4: traffic management, Permanent 830 687 17.2 1Total 1190 936 21.3 10Table 3.2 - Employment and vacancies by salary bands, 31 March <strong>2012</strong>Salary band Number of posts Number of posts filled Vacancy rate Number of posts filled additional to theestablishmentLower skilled (Levels 1-2), Permanent 58 32 44.8 0Skilled (Levels 3-5), Permanent 150 122 18.7 0Highly skilled production (Levels 6-8), Permanent 779 628 19.4 0Highly skilled supervision (Levels 9-12), Permanent 154 108 29.9 1Senior management (Levels 13-16), Permanent 25 22 12 0Contract (Levels 3-5), Permanent 7 7 0 4Contract (Levels 6-8), Permanent 8 8 0 2Contract (Levels 9-12), Permanent 6 6 0 2Contract (Levels 13-16), Permanent 3 3 0 1Total 1190 936 21.3 10152 | <strong>Annual</strong> <strong>Report</strong> <strong>2011</strong>/12 • Department of <strong>Community</strong> <strong>Safety</strong>
Table 3.3 - Employment and vacancies by critical occupation, 31 March <strong>2012</strong>Critical occupations Number of posts Number of postsfilledVacancy rate Number of posts filled additional to theestablishmentAdministrative related, Permanent 92 59 35.9 1Building and other property caretakers, Permanent 16 12 25 0Cleaners in offices workshops hospitals etc., Permanent 38 26 31.6 0Client inform clerks(switchb recept inform clerks), Permanent 15 11 26.7 0Communication and information related, Permanent 9 8 11.1 0Computer system designers and analysts., Permanent 2 0 100 0Finance and economics related, Permanent 9 8 11.1 0Financial and related professionals, Permanent 5 4 20 0Financial clerks and credit controllers, Permanent 14 13 7.1 0Food services aids and waiters, Permanent 2 1 50 0Head of department/chief executive officer, Permanent 1 1 0 0Health sciences related, Permanent 1 1 0 1Housekeepers laundry and related workers, Permanent 13 13 0 0Human resources & organisat developm & relate prof, Permanent 38 36 5.3 0Human resources clerks, Permanent 1 1 0 0Human resources related, Permanent 5 3 40 0Information technology related, Permanent 1 0 100 0Language practitioners interpreters & other commun, Permanent 6 5 16.7 0Legal related, Permanent 5 2 60 0Library mail and related clerks, Permanent 4 4 0 0Light vehicle drivers, Permanent 1 1 0 0Logistical support personnel, Permanent 8 5 37.5 0Material-recording and transport clerks, Permanent 7 7 0 0Medical specialists, Permanent 1 1 0 1Messengers porters and deliverers, Permanent 9 6 33.3 0Human Resource Management • <strong>Annual</strong> <strong>Report</strong> <strong>2011</strong>/12 |153
Critical occupations Number of posts Number of postsfilledVacancy rate Number of posts filled additional to theestablishmentNursing assistants, Permanent 4 4 0 4Other administrat & related clerks and organisers, Permanent 112 76 32.1 0Other administrative policy and related officers, Permanent 56 39 30.4 0Other information technology personnel., Permanent 5 3 40 0Other occupations, Permanent 22 22 0 0Professional nurse, Permanent 4 2 50 2Regulatory inspectors, Permanent 590 507 14.1 0Risk management and security services, Permanent 35 10 71.4 0Secretaries & other keyboard operating clerks, Permanent 38 28 26.3 0Security guards, Permanent 3 3 0 0Senior managers, Permanent 17 13 23.5 1Social sciences related, Permanent 1 1 0 0Total 1190 936 21.3 10Job evaluationTable 4.1 - Job Evaluation, 1 April <strong>2011</strong> to 31 March <strong>2012</strong>Salary band Number ofpostsNumber of jobsevaluated% of postsevaluated bysalary bandsNumber of postsupgradedPosts upgraded Posts downgraded% of upgradedposts evaluatedNumber of postsdowngraded% of downgradedposts evaluatedLower skilled (Levels 1-2) 58 0 0 0 0 0 0Contract (Levels 3-5) 7 0 0 0 0 0 0Contract (Levels 6-8) 8 0 0 0 0 0 0Contract (Levels 9-12) 6 0 0 0 0 0 0Contract (Band A) 1 0 0 0 0 0 0Contract (Band B) 1 0 0 0 0 0 0Contract (Band D) 1 0 0 0 0 0 0Skilled (Levels 3-5) 150 29 19.3 27 93.1 0 0154 | <strong>Annual</strong> <strong>Report</strong> <strong>2011</strong>/12 • Department of <strong>Community</strong> <strong>Safety</strong>
Salary band Number ofpostsNumber of jobsevaluated% of postsevaluated bysalary bandsNumber of postsupgradedPosts upgraded Posts downgraded% of upgradedposts evaluatedNumber of postsdowngraded% of downgradedposts evaluatedHighly skilled production (Levels 6-8) 779 1 0.1 1 100 0 0Highly skilled supervision (Levels 9-12) 154 0 0 0 0 0 0Senior Management Service Band A 17 0 0 0 0 0 0Senior Management Service Band B 6 0 0 0 0 0 0Senior Management Service Band C 1 0 0 0 0 0 0Senior Management Service Band D 1 0 0 0 0 0 0Total 1190 30 2.5 28 93.3 0 0Table 4.2 - Profile of employees whose positions were upgraded due to their posts being upgraded, 1 April <strong>2011</strong> to 31 March <strong>2012</strong>Beneficiaries African Asian Coloured White TotalFemale 0 0 0 0 0Male 0 0 0 0 0Total 0 0 0 0 0Employees with a Disability 0 0 0 0 0Table 4.3 - Employees whose salary level exceed the grade determined by job evaluation, 1 April <strong>2011</strong> to 31 March <strong>2012</strong> (in terms of PSR 1.V.C.3)Total number of employees whose salaries exceeded the grades determined by job evaluation in None<strong>2011</strong>/12Table 4.4 - Profile of employees whose salary level exceed the grade determined by job evaluation, 1 April <strong>2011</strong> to 31 March <strong>2012</strong> (in terms of PSR 1.V.C.3)Beneficiaries African Asian Coloured White TotalFemale 0 0 0 0 0Male 0 0 0 0 0Total 0 0 0 0 0Employees with a disability 0 0 0 0 0Human Resource Management • <strong>Annual</strong> <strong>Report</strong> <strong>2011</strong>/12 |155
Employment changesTable 5.1 – <strong>Annual</strong> turnover rates by salary band for the period 1 April <strong>2011</strong> to 31 March <strong>2012</strong>Salary band Number of employees per band ason 1 April <strong>2011</strong>Appointments and transfers intothe departmentTerminations and transfers out ofthe departmentTurnover rateLower skilled (Levels 1-2), Permanent 34 0 2 5.9Skilled (Levels 3-5), Permanent 127 4 2 1.6Highly skilled production (Levels 6-8), Permanent 628 9 19 3Highly skilled supervision (Levels 9-12), Permanent 109 1 6 5.5Senior Management Service Band A, Permanent 16 0 1 6.3Senior Management Service Band B, Permanent 4 1 0 0Senior Management Service Band C, Permanent 0 1 0 0Senior Management Service Band D, Permanent 1 0 0 0Contract (Levels 3-5), Permanent 2 5 0 0Contract (Levels 6-8), Permanent 8 5 5 62.5Contract (Levels 9-12), Permanent 4 3 0 0Contract (Band A), Permanent 1 0 0 0Contract (Band B), Permanent 1 0 0 0Contract (Band D), Permanent 1 0 0 0Total 936 29 35 3.7Table 5.2 - <strong>Annual</strong> turnover rates by critical occupation for the period 1 April <strong>2011</strong> to 31 March <strong>2012</strong>Occupation Number of employees peroccupation as on 1 April <strong>2011</strong>Appointments and transfers intothe departmentTerminations and transfers out ofthe departmentTurnover rateAdministrative related, Permanent 62 1 4 6.5Building and other property caretakers, Permanent 12 0 0 0Cleaners in offices workshops hospitals etc., Permanent 27 0 0 0Client inform clerks(switchb recept inform clerks),Permanent 11 1 4 36.4Communication and information related, Permanent 6 1 0 0Finance and economics related, Permanent 8 0 0 0Financial and related professionals, Permanent 5 0 0 0Financial clerks and credit controllers, Permanent 13 0 0 0156 | <strong>Annual</strong> <strong>Report</strong> <strong>2011</strong>/12 • Department of <strong>Community</strong> <strong>Safety</strong>
Occupation Number of employees peroccupation as on 1 April <strong>2011</strong>Appointments and transfers intothe departmentTerminations and transfers out ofthe departmentTurnover rateFood services aids and waiters, Permanent 1 0 0 0Head of department/chief executive officer, Permanent 1 0 0 0Health sciences related, Permanent 0 1 0 0Housekeepers laundry and related workers, Permanent 14 0 1 7.1Human resources & organisat developm & relate prof,Permanent 36 0 0 0Human resources clerks, Permanent 1 0 0 0Human resources related, Permanent 4 0 1 25Language practitioners interpreters & other commun,Permanent 6 0 0 0Legal related, Permanent 2 0 0 0Library mail and related clerks, Permanent 4 0 0 0Light vehicle drivers, Permanent 1 0 0 0Logistical support personnel, Permanent 3 1 0 0Material-recording and transport clerks, Permanent 5 2 0 0Medical specialists, Permanent 0 1 0 0Messengers porters and deliverers, Permanent 7 0 1 14.3Nursing assistants, Permanent 0 4 0 0Other administrat & related clerks and organisers,Permanent 82 2 0 0Other administrative policy and related officers, Permanent 37 3 2 5.4Other information technology personnel., Permanent 4 0 1 25Other occupations, Permanent 20 1 1 5Professional nurse, Permanent 0 2 0 0Regulatory inspectors, Permanent 521 0 17 3.3Risk management and security services, Permanent 2 5 1 50Secretaries & other keyboard operating clerks, Permanent 26 2 2 7.7Security guards, Permanent 3 0 0 0Senior managers, Permanent 11 2 0 0Social sciences related, Permanent 1 0 0 0Total 936 29 35 3.7Human Resource Management • <strong>Annual</strong> <strong>Report</strong> <strong>2011</strong>/12 |157
Table 5.3 - Reasons why staff are leaving the departmentTermination type Number % of totalDeath 4 11.4Resignation 22 62.9Expiry of contract 5 14.3Dismissal – operational changes 0 0Dismissal - misconduct 0 0Dismissal - inefficiency 0 0Discharged due to ill-health 2 5.7Retirement 2 5.7Transfers to other Public Service Departments 0 0Other 0 0Total 35 100Total number of employees who left as a % of the total employment 3.37%Table 5.4 - Promotions by critical occupationOccupation Employees as at 1 April <strong>2011</strong> Promotions to another salarylevelSalary level promotions as a %of employees by occupationProgressions to another notchwithin a salary levelNotch progressions as a % ofemployees by salary bandAdministrative related 62 2 3.2 39 62.9Building and other propertycaretakers 12 0 0 11 91.7Cleaners in offices workshopshospitals etc. 27 0 0 23 85.2Client inform clerks (switchb receptinform clerks) 11 0 0 7 63.6Communication and informationrelated 6 1 16.7 2 33.3Finance and economics related 8 1 12.5 6 75Financial and related professionals 5 0 0 4 80Financial clerks and credit controllers 13 0 0 13 100Food services aids and waiters 1 0 0 1 100158 | <strong>Annual</strong> <strong>Report</strong> <strong>2011</strong>/12 • Department of <strong>Community</strong> <strong>Safety</strong>
Occupation Employees as at 1 April <strong>2011</strong> Promotions to another salarylevelSalary level promotions as a %of employees by occupationProgressions to another notchwithin a salary levelNotch progressions as a % ofemployees by salary bandHead of department/chief executiveofficer 1 0 0 0 0Housekeepers laundry and relatedworkers 14 0 0 11 78.6Human resources & organisatdevelopm & relate prof36 2 5.6 32 88.9Human resources clerks 1 0 0 1 100Human resources related 4 0 0 1 25Language practitioners interpreters &other commun 6 0 0 4 66.7Legal related 2 0 0 0 0Library mail and related clerks 4 0 0 2 50Light vehicle drivers 1 0 0 1 100Logistical support personnel 3 0 0 3 100Material-recording and transportclerks 5 0 0 5 100Messengers porters and deliverers 7 0 0 4 57.1Other administrat & related clerksand organisers 82 1 1.2 56 68.3Other administrative policy andrelated officers 37 0 0 31 83.8Other information technologypersonnel. 4 0 0 2 50Other occupations 20 0 0 18 90Regulatory inspectors 521 1 0.2 461 88.3Risk management and securityservices 2 0 0 0 0Secretaries & other keyboardoperating clerks 26 0 0 21 80.8Security guards 3 0 0 2 66.7Human Resource Management • <strong>Annual</strong> <strong>Report</strong> <strong>2011</strong>/12 |159
Occupation Employees as at 1 April <strong>2011</strong> Promotions to another salarylevelSalary level promotions as a %of employees by occupationProgressions to another notchwithin a salary levelNotch progressions as a % ofemployees by salary bandSenior managers 11 0 0 0 0Social sciences related 1 0 0 0 0TOTAL 936 8 0.9 761 81.2Table 5.5 - Promotions by salary bandSalary band Employees as at 1 April <strong>2011</strong> Promotions to another salarylevelSalary bands promotions as a% of employees by salary levelProgressions to another notchwithin a salary levelNotch progressions as a % ofemployees by salary bandLower skilled (Levels 1-2) 34 0 0 24 70.6Skilled (Levels 3-5) 127 0 0 108 85Highly skilled production (Levels6-8) 628 2 0.3 548 87.1Highly skilled supervision (Levels9-12) 109 6 5.5 81 74.3Senior management (Levels 13- 21 0 0 0 0Contract (Levels 3-5) 2 0 0 0 0Contract (Levels 6-8) 8 0 0 0 0Contract (Levels 9-12) 4 0 0 0 0Contract (Levels 13-16) 3 0 0 0 0Total 936 8 0.9 761 81.2Employment equityTable 6.1 - Total number of employees (including employees with disabilities) in each of the occupational categories ason 31 March <strong>2012</strong>Occupational categories (SASCO) Male Female TotalAfrican Coloured Indian White African Coloured Indian WhiteLegislators, senior officials and managers 7 1 1 1 9 0 1 2 22Professionals 31 1 0 0 32 2 1 1 68Technicians and associate professionals 49 0 3 7 38 4 1 2 104Clerks 25 1 0 1 95 3 0 13 138160 | <strong>Annual</strong> <strong>Report</strong> <strong>2011</strong>/12 • Department of <strong>Community</strong> <strong>Safety</strong>
Occupational categories (SASCO) Male Female TotalAfrican Coloured Indian White African Coloured Indian WhiteService and sales workers 287 10 4 41 190 2 0 3 537Plant and machine operators and assemblers 1 0 0 0 0 0 0 0 1Elementary occupations 36 0 0 1 29 0 0 0 66Total 436 13 8 51 393 11 3 21 936Employees with disabilities 6 0 0 1 8 0 0 0 15Table 6.2 - Total number of employees (including employees with disabilities) in each of the following occupational bands as on 31 March <strong>2012</strong>Occupational bands Male Female TotalAfrican Coloured Indian White African Coloured Indian WhiteTop Management 1 0 0 0 1 0 0 0 2Senior Management 5 1 1 1 9 0 1 2 20Professionally qualified and experiencedspecialists and mid-management 52 1 2 12 37 2 1 1 108Skilled technical and academicallyqualified workers, junior management,supervisors, foremen 317 10 4 37 234 7 1 18 628Semi-skilled and discretionary decisionmaking 39 0 0 1 80 2 0 0 122Unskilled and defined decision making 12 0 0 0 20 0 0 0 32Contract (Top Management) 1 0 0 0 0 0 0 0 1Contract (Senior Management) 0 0 0 0 2 0 0 0 2Contract (Professionally qualified) 3 0 1 0 2 0 0 0 6Contract (Skilled technical) 6 1 0 0 1 0 0 0 8Contract (Semi-skilled) 0 0 0 0 7 0 0 0 7Total 436 13 8 51 393 11 3 21 936Human Resource Management • <strong>Annual</strong> <strong>Report</strong> <strong>2011</strong>/12 |161
Table 6.3 – Recruitment for the period 1 April <strong>2011</strong> to 31 March <strong>2012</strong>Occupational Bands Male Female TotalAfrican Coloured Indian White African Coloured Indian WhiteTop Management 1 0 0 0 0 0 0 0 1Senior Management 0 1 0 0 0 0 0 0 1Professionally qualified and experiencedspecialists and mid-management 0 0 0 0 1 0 0 0 1Skilled technical and academically qualifiedworkers, junior management, supervisors,foremen 5 0 1 0 3 0 0 0 9Semi-skilled and discretionary decision making 2 0 0 0 2 0 0 0 4Contract (Professionally qualified) 1 0 1 0 1 0 0 0 3Contract (Skilled technical) 3 0 0 0 2 0 0 0 5Contract (Semi-skilled) 0 0 0 0 5 0 0 0 5Total 12 1 2 0 14 0 0 0 29Table 6.4 – Promotions for the period 1 April <strong>2011</strong> to 31 March <strong>2012</strong>Occupational bands Male Female TotalAfrican Coloured Indian White African Coloured Indian WhiteProfessionally qualified and experiencedspecialists and mid-management 42 1 2 10 29 2 0 1 87Skilled technical and academically qualifiedworkers, junior management, supervisors,foremen 283 10 3 34 204 8 1 7 550Semi-skilled and discretionary decision making 32 0 0 0 75 1 0 0 108Unskilled and defined decision making 9 0 0 0 15 0 0 0 24Total 366 11 5 44 323 11 1 8 769Employees with disabilities 6 0 0 1 7 0 0 0 14162 | <strong>Annual</strong> <strong>Report</strong> <strong>2011</strong>/12 • Department of <strong>Community</strong> <strong>Safety</strong>
Table 6.5 - Terminations for the period 1 April <strong>2011</strong> to 31 March <strong>2012</strong>Occupational bands Male FemaleAfrican Coloured Indian White African Coloured Indian White TotalSenior Management 0 0 0 1 0 0 0 0 1Professionally qualified and experiencedspecialists and mid-management 4 0 0 1 1 0 0 0 6Skilled technical and academically qualifiedworkers, junior management, supervisors,foremen 9 0 0 2 8 0 0 0 19Semi-skilled and discretionary decision making 1 0 0 0 1 0 0 0 2Unskilled and defined decision making 0 0 0 0 2 0 0 0 2Contract (Skilled technical) 4 1 0 0 0 0 0 0 5Total 18 1 0 4 12 0 0 0 35Employees with disabilities 1 0 0 0 0 0 0 0 1Table 6.6 - Disciplinary Action for the period 1 April <strong>2011</strong> to 31 March <strong>2012</strong>Male Female TotalAfrican Coloured Indian White African Coloured Indian WhiteDisciplinary action 14 2 0 0 5 0 0 0 21Employees with disabilities 0 0 0 0 0 0 0 0 0Human Resource Management • <strong>Annual</strong> <strong>Report</strong> <strong>2011</strong>/12 |163
Table 6.7 - Skills Development for the period 1 April <strong>2011</strong> to 31 March <strong>2012</strong>Occupational categories Male Female TotalAfrican Coloured Indian White African Coloured Indian WhiteLegislators, Senior Officials and Managers 5 0 2 1 17 0 1 4 30Professionals 26 2 0 3 28 4 3 2 68Technicians and Associate Professionals 42 0 0 0 15 0 0 0 57Clerks 38 0 0 0 82 2 0 7 129Service and Sales Workers 88 0 7 6 76 2 3 0 182Skilled Agriculture and Fishery Workers 0 0 0 0 0 0 0 0 0Craft and related Trades Workers 0 0 0 0 0 0 0 0 0Plant and Machine Operators and Assemblers 0 0 0 0 0 0 0 0 0Elementary Occupations 10 0 0 0 15 0 0 0 25Total 209 2 9 10 233 8 7 13 491Employees with disabilities 1 0 0 0 1 0 0 0 0Performance RewardsTable 7.1 - Performance rewards by race, gender and disability, 1 April <strong>2011</strong> to 31 March <strong>2012</strong>Gender & Race Beneficiary profile CostNumber of beneficiaries Total number of employeesin group% of total within group Cost (R’000) Average Cost per employeeAfrican, Female 146 385 37.9 1 186 8 125African, Male 126 430 29.3 1 152 8 743Asian, Female 1 3 33.3 11 10 763Asian, Male 3 8 37.5 31 10 343Coloured, Female 6 11 54.5 76 11 822Coloured, Male 5 13 38.5 67 9 340White, Female 9 21 42.9 84 9 300White, Male 24 50 48 265 10 968Employees with a disability 3 15 20 27 8 887Total 323 936 34.5 2 899 8 734164 | <strong>Annual</strong> <strong>Report</strong> <strong>2011</strong>/12 • Department of <strong>Community</strong> <strong>Safety</strong>
Table 7.2 - Performance Rewards by salary band for personnel below senior management service, 1 April <strong>2011</strong> to 31 March <strong>2012</strong>Salary Band Beneficiary profile CostNumber of beneficiaries Number of employees % of total within salary bandsTotal cost (R’000) Average cost peremployeeTotal cost as a % ofthe total personnelexpenditureLower skilled (Levels 1-2) 22 32 68.8 121 5 500 0.05Skilled (Levels 3-5) 72 122 59 401 5 569 0.17Highly skilled production (Levels 6-8) 175 628 27.9 1 666 9 520 0.7Highly skilled supervision (Levels 9-12) 54 108 50 711 13 167 0.3Contract (Levels 3-5) 0 7 0 0 0 0Contract (Levels 6-8) 0 8 0 0 0 0Contract (Levels 9-12) 0 6 0 0 0 0Periodical Remuneration 0 2 0 0 0 0Abnormal Appointment 0 118 0 0 0 0Total 323 1 031 31.3 2 899 8 975 1.23The table above includes all employees (contract and permanent) on salary level 1-12Table 7.3 - Performance rewards by critical occupation, 1 April <strong>2011</strong> to 31 March <strong>2012</strong>Critical occupations Beneficiary profile CostNumber of beneficiaries Number of employees % of total withinoccupationCost (R’000) Average cost peremployeeAdministrative related 26 59 44.1 346 13 308Building and other property caretakers 9 12 75 43 4 778Cleaners in offices workshops hospitals etc. 17 26 65.4 88 5 176Client inform clerks(switchb recept inform clerks) 4 11 36.4 40 10 000Communication and information related 1 8 12.5 11 11 000Finance and economics related 4 8 50 43 10 750Financial and related professionals 1 4 25 8 8 000Financial clerks and credit controllers 3 13 23.1 47 15 667Food services aids and waiters 1 1 100 7 7 000Head of department/chief executive officer 0 1 0 0 0Health sciences related 0 1 0 0 0Housekeepers laundry and related workers 11 13 84.6 53 4 818Human Resource Management • <strong>Annual</strong> <strong>Report</strong> <strong>2011</strong>/12 |165
Critical occupations Beneficiary profile CostNumber of beneficiaries Number of employees % of total withinoccupationCost (R’000) Average cost peremployeeHuman resources & organisat developm & relate prof 13 36 36.1 156 12 000Human resources clerks 1 1 100 7 7 000Human resources related 1 3 33.3 15 15 000Language practitioners interpreters & other commun 0 5 0 0 0Legal related 0 2 0 0 0Library mail and related clerks 2 4 50 11 5 500Light vehicle drivers 1 1 100 5 5 000Logistical support personnel 3 5 60 51 17000Material-recording and transport clerks 1 7 14.3 5 5 000Medical specialists 0 1 0 0 0Messengers porters and deliverers 5 6 83.3 40 8 000Nursing assistants 0 4 0 0 0Other administrat & related clerks and organisers 43 76 56.6 289 6 721Other administrative policy and related officers 9 39 23.1 91 10 111Other information technology personnel. 1 3 33.3 20 20 000Other occupations 9 22 40.9 64 7 111Professional nurse 0 2 0 0 0Regulatory inspectors 141 507 27.8 1 341 9 511Risk management and security services 4 10 40 31 7 750Secretaries & other keyboard operating clerks 8 28 28.6 60 7 500Security guards 3 3 100 15 5 000Senior managers 0 13 0 0 0Social sciences related 1 1 100 12 12 000Total 323 936 34.5 2899 8975166 | <strong>Annual</strong> <strong>Report</strong> <strong>2011</strong>/12 • Department of <strong>Community</strong> <strong>Safety</strong>
Table 7.4 - Performance related rewards (cash bonus), by salary band for Senior Management ServiceSalary bands Beneficiary Profile CostNumber of beneficiaries Number of employees % of total within band Total Cost (R’000) Average cost per employee(R)Total cost as a % of thetotal personnel expenditureBand A 0 16 0 0 0 0Band B 0 6 0 0 0 0Band C 0 1 0 0 0 0Band D 0 2 0 0 0 0Total 0 25 0 0 0 0Foreign workersTable 8.1 - Foreign Workers, 1 April <strong>2011</strong> to 31 March <strong>2012</strong>, by salary bandSalary band 1 April <strong>2011</strong> 31 March <strong>2012</strong> ChangeNumber % of total Number % of total Number % of totalContract (Levels 9-12) 0 0 1 50 1 50Abnormal Appointment 0 0 1 50 1 50Total 0 0 2 100 2 100Table 8.2 - Foreign Worker, 1 April <strong>2011</strong> to 31 March <strong>2012</strong>, by major occupationMajor occupation 1 April <strong>2011</strong> 31 March <strong>2012</strong> ChangeNumber % of total Number % of total Number % of totalContract (Levels 9-12) 0 0 1 50 1 50Abnormal Appointment 0 0 1 50 1 50Total 0 0 2 100 2 100Human Resource Management • <strong>Annual</strong> <strong>Report</strong> <strong>2011</strong>/12 |167
Leave utilisation for the period 1 January <strong>2011</strong> to 31 December <strong>2011</strong>Table 9.1 - Sick Leave, 1 January <strong>2011</strong> to December <strong>2011</strong>Salary band Total days % Days with medicalcertificationNumber of employeesusing sick leave% of Total employeesusing sick leaveAverage days peremployeeEstimated cost (R’000)Lower skilled (Levels 1-2) 244 61.5 31 4.2 8 56Skilled (Levels 3-5) 844 64.3 101 13.5 8 261Highly skilled production (Levels 6-8) 4077 57.6 518 69.4 8 2 060Highly skilled supervision (Levels9-12) 507 66.5 77 10.3 7 565Senior management (Levels 13-16) 72 76.4 12 1.6 6 202Contract (Levels 3-5) 12 83.3 2 0.3 6 3Contract (Levels 6-8) 4 25 2 0.3 2 7Contract (Levels 9-12) 10 100 2 0.3 5 13Contract (Levels 13-16) 3 66.7 1 0.1 3 8Total 5773 59.9 746 100 8 3175The table above includes all employees (contract and permanent)Table 9.2 - Disability Leave (temporary and permanent), 1 January <strong>2011</strong> to 31 December <strong>2011</strong>Salary band Total days taken % days with medicalcertificationNumber of employeesusing disability leave% of Total employeesusing disability leaveAverage days peremployeeEstimated cost (R’000)Highly skilled production (Levels 6-8) 31 100 3 100 10 12Total 31 100 3 100 10 12Table 9.3 - <strong>Annual</strong> leave, 1 January <strong>2011</strong> to 31 December <strong>2011</strong>Salary band Total days taken Average days per employeeLower skilled (Levels 1-2) 683 21Skilled (Levels 3-5) 2602 21Highly skilled production (Levels 6-8) 11854.8 20Highly skilled supervision (Levels 9-12) 1834 18Senior management (Levels 13-16) 452 22168 | <strong>Annual</strong> <strong>Report</strong> <strong>2011</strong>/12 • Department of <strong>Community</strong> <strong>Safety</strong>
Salary band Total days taken Average days per employeeContract (Levels 3-5) 23 12Contract (Levels 6-8) 11 4Contract (Levels 9-12) 39 13Contract (Levels 13-16) 35 12Total 17533.8 20The table above includes all employees (contract and permanent)Table 9.4 - Capped leave, 1 January <strong>2011</strong> to 31 December <strong>2011</strong>Salary band Total days of capped leave taken Average number of days taken per employee Average capped leave per employee as at 31December <strong>2011</strong>Skilled (Levels 3-5) 1 1 33Highly skilled production (Levels 6-8) 79 10 52Highly skilled supervision (Levels 9-12) 4 4 59Senior management (Levels 13-16) 4 4 34Total 88 8 50Table 9.5 - Leave payouts for the period 1 April <strong>2011</strong> to 31 March <strong>2012</strong>Reason Total Amount (R’000) Number of Employees Average payment per employee (R)Capped leave payouts on termination of service for <strong>2011</strong>/12 261 28 9321Current leave payout on termination of service for <strong>2011</strong>/12 87 14 6214Total 348 42 8286Human Resource Management • <strong>Annual</strong> <strong>Report</strong> <strong>2011</strong>/12 |169
HIV and AIDS & health promotion programmesTable 10.1 - Steps taken to reduce the risk of occupational exposureUnits/categories of employees identified to be at high risk of contracting HIV & related diseases (if any) Key steps taken to reduce the riskNot applicable Not applicableTable 10.2 - Details of health promotion and HIV/AIDS ProgrammesQuestion Yes No Details, if yes1. Has the department designated a member of the SMS to implement theprovisions contained in Part VI E of Chapter 1 of the Public Service Regulations,2001? If so, provide her/his name and positionx Ms Nontembeko Tsiane, Director HR2. Does the department have a dedicated unit or have you designated specificstaff members to promote health and well being of your employees? If so,indicate the number of employees who are involved in this task and the annualbudget that is available for this purposex 1 Employee Health & Wellness Practitioner• 26 Peer Educators based at Regional Offices• Budget was spent as follows:• Employee wellness clinics R218 800.00• Psycho social services R320 000.00• Women’s forum R110 000.00• HIV/AIDS training R342 000.003. Has the department introduced an Employee Assistance or Health PromotionProgramme for your employees? If so, indicate the key elements/services of theprogrammex • • Psycho-social support and counseling,• Lifestyle and health management promotion• Awareness and Training4. Has the department established (a) committee(s) as contemplated in PartVI E.5 (e) of Chapter 1 of the Public Service Regulations, 2001? If so, pleaseprovide the names of the members of the committee and the stakeholder(s) thatthey representx • • Ms Boitumelo Medupe (Employer)• Mr Venash Murugan (People Living With HIV and AIDS)• Ms Charlotte Thapedi• Ms Pearl Madiba• Ms Trudy Mabena5. Has the department reviewed the employment policies and practices of yourdepartment to ensure that these do not unfairly discriminate against employeeson the basis of their HIV status? If so, list the employment policies/practices sox • • HIV/AIDS/TB Policy• EWP Policy• Recruitment and Selection•••••••••••••170 | <strong>Annual</strong> <strong>Report</strong> <strong>2011</strong>/12 • Department of <strong>Community</strong> <strong>Safety</strong>
Question Yes No Details, if yes6. Has the department introduced measures to protect HIV-positive employees orthose perceived to be HIV-positive from discrimination? If so, list the key elementsof these measures7. Does the department encourage its employees to undergo VoluntaryCounselling and Testing? If so, list the results that you have achievedx Disciplinary Code and Procedure Policyx 2 HIV Counselling and Testing sessions, where 202 employees were tested. Ofthe 202 employees, 69 tested for HIV/AIDs4 training interventions for Peer Educators8. Has the department developed measures/indicators to monitor & evaluate theimpact of your health promotion programme? If so, list these measures/indicatorsx Monthly and quarterly reports, attendance and condom distribution registerLabour relationsTable 11.1 - Collective agreements, 1 April <strong>2011</strong> to 31 March <strong>2012</strong>Total collective agreements NoneTable 11.2 – Misconduct and disciplinary hearings finalised, 1 April <strong>2011</strong> to 31 March <strong>2012</strong>Outcomes of disciplinary hearings Number % of totalCorrectional counseling 0 0Verbal warning 0 0Written Warning 0 0Final written warning 3 18Suspended without pay 0 0Fine 0 0Demotion 0 0Dismissal 0 0Not guilty 1 6Case withdrawn 13 76Total 17 100Human Resource Management • <strong>Annual</strong> <strong>Report</strong> <strong>2011</strong>/12 |171
Table 11.3 - Types of misconduct addressed at disciplinary hearingsType of misconduct Number % of totalAbsenteeism 2 9.5Attempted bribery 1 4.8Bribery 5 24Failure to disclose business interest 3 14Fraud and threatened to shoot supervisor 1 4.8Interference with SAPS duties 1 4.8Intimidation and insubordination 3 14Misuse of petrol cards 2 9.5Misuse of state vehicle 1 4.8Negligence and reckless driving 2 9.5Total 21 100Table 11.4 - Grievances lodged for the period 1 April <strong>2011</strong> to 31 March <strong>2012</strong>Number % of totalNumber of grievances not resolved 4 19Number of grievances resolved 17 81Total number of grievances lodged 21 100Table 11.5 - Disputes lodged with councils for the period 1 April <strong>2011</strong> to 31 March <strong>2012</strong>Number of disputes addressed Number % of totalNumber of disputes upheld 0 0Number of disputes dismissed 3 100Total number of disputes lodged 3 100172 | <strong>Annual</strong> <strong>Report</strong> <strong>2011</strong>/12 • Department of <strong>Community</strong> <strong>Safety</strong>
Table 11.6 - Strike actions for the period 1 April <strong>2011</strong> to 31 March <strong>2012</strong>Total number of person working days lost 0Total cost(R’000) of working days lost 0Amount (R’000) recovered as a result of no work no pay 0Table 11.7 - Precautionary suspensions for the period 1 April <strong>2011</strong> to 31 March <strong>2012</strong>Number of people suspended 0Number of people whose suspension exceeded 30 days 0Average number of days suspended 0Cost (R’000) of suspensions 0Skills developmentTable 12.1 - Training needs identified, 1 April <strong>2011</strong> to 31 March <strong>2012</strong>Occupational categories Gender Number of employees asat 1 April <strong>2011</strong>Training needs identified at the start of the reporting periodLearnerships Skills programmes &other short coursesOther forms of training TotalLegislators, senior officials andFemale 8 0 13 0 13managersMale 7 0 8 0 8Professionals Female 38 0 49 0 49Male 34 0 48 0 48Female 46 0 137 0 137Technicians and associate professionals Male 59 0 185 0 185Female 113 0 27 0 27ClerksMale 27 0 6 0 6Service and sales workers Female 195 0 23 0 23Male 342 0 24 0 24Human Resource Management • <strong>Annual</strong> <strong>Report</strong> <strong>2011</strong>/12 |173
Occupational categories Gender Number of employees asat 1 April <strong>2011</strong>Training needs identified at the start of the reporting periodLearnerships Skills programmes &other short coursesOther forms of training TotalSkilled agriculture and fishery workers Female 0 0 0 0 0Male 0 0 0 0 0Craft and related trades workers Female 0 0 0 0 0Plant and machine operators andassemblersMale 0 0 0 0 0Female 0 0 0 0 0Male 1 0 0 0 0Elementary occupations Female 29 0 0 0 0Male 37 0 0 0 0Sub totals Female 428 0 249 0 249Male 508 0 271 0 271Total 936 0 520 0 520Table 12.2 - Training provided 1 April <strong>2011</strong> to 31 March <strong>2012</strong>Occupational Categories Gender Training provided within the reporting periodEmployment Learnerships Skills programmes & othershort coursesOther forms of training TotalFemale 8 0 23 0 23Legislators, senior officials andmanagersMale 7 0 7 0 7Professionals Female 38 0 46 0 46Male 34 0 79 0 79Technicians and associate professionals Female 46 0 81 0 81Male 59 0 101 0 101Clerks Female 113 0 91 0 91Male 27 0 38 0 38174 | <strong>Annual</strong> <strong>Report</strong> <strong>2011</strong>/12 • Department of <strong>Community</strong> <strong>Safety</strong>
Occupational Categories Gender Training provided within the reporting periodEmployment Learnerships Skills programmes & othershort coursesOther forms of training TotalService and sales workers Female 195 0 0 0 0Male 342 0 0 0 0Skilled agriculture and fishery workers Female 0 0 0 0 0Male 0 0 0 0 0Craft and related trades workers Female 0 0 0 0 0Plant and machine operators andassemblersMale 0 0 0 0 0Female 0 0 0 0 0Male 1 0 0 0 0Elementary occupations Female 29 0 24 0 24Male 37 0 1 0 1Sub totals Female 428 0 265 0 265Male 508 0 226 0 226Total 936 0 491 0 491Injury on dutyTable 13.1 - Injury on duty, 1 April <strong>2011</strong> to 31 March <strong>2012</strong>Nature of injury on duty Number % of totalRequired basic medical attention only 21 95Temporary total disablement 1 5Permanent disablement 0 0Fatal 0 0Total 22 0Human Resource Management • <strong>Annual</strong> <strong>Report</strong> <strong>2011</strong>/12 |175
Utilisation of consultantsTable 14.1 - <strong>Report</strong> on consultant appointments using appropriated fundsProject title Total number of consultants that worked on theprojectDuration: Work days Contract value in randEWP/EAP 0 9 months 393 187.86Research project 1 8 months 197 410.00Scholar Patrol survey 3 6 months 100 000.00Turnaround Strategy for Traffic College 3 4 months 900 978.49Health Risk Manager 3-4 12 months 160 624.00EWP/EAP 2 3 months 46 757.07Developed accredited social crime prevention trainingprogramme 7 4 months 827 411.50Conduct SMS assessments 0 As and when required 48 292.98Total number of projects Total individual consultants Total duration: Work days Total contract value in Rand8 0 46 months 2 674 461.04Table 14.2 - Analysis of consultant appointments using appropriated funds, in terms of Historically DisadvantagedIndividuals (HDIs)Project title Percentage ownership by HDI groups Percentage management by HDI groups Number of consultants from HDI groups thatwork on the projectEWP/EAP 0 0 0Research project 100 100 1Scholar Patrol survey 100 100 3Turnaround Strategy for Traffic College 100 100 3Health Risk Manager 100 100 2EWP/EAP 51 51 2Developed accredited social crime prevention trainingprogramme 0 50 3Conduct SMS assessments 0 0 0176 | <strong>Annual</strong> <strong>Report</strong> <strong>2011</strong>/12 • Department of <strong>Community</strong> <strong>Safety</strong>
Table 14.3 - <strong>Report</strong> on consultant appointments using donor fundsProject title Total number of consultants thatworked on the projectDuration: Work days Donor and contract value in randNot applicable Not applicable Not applicable Not applicableTable 14.4 - Analysis of consultant appointments using donor funds, in terms of Historically Disadvantaged Individuals(HDIs)Project title Percentage ownership by HDIgroupsPercentage management by HDI groups Number of consultants from HDI groups that work on theprojectNot applicable Not applicable Not applicable Not applicableGeneral Information • <strong>Annual</strong> <strong>Report</strong> <strong>2011</strong>/12 |177
OTHER INFORMATION05178 | <strong>Annual</strong> <strong>Report</strong> <strong>2011</strong>/12 • Department of <strong>Community</strong> <strong>Safety</strong>
5. OTHER INFORMATIONList of abbreviations and acronyms for the <strong>Annual</strong> <strong>Report</strong> <strong>2011</strong>/<strong>2012</strong>ABET : Adult Basic Education and TrainingAFS : <strong>Annual</strong> Financial StatementsAPP : <strong>Annual</strong> Performance PlanATM : Automated MachineBAS : Budget Administration SystemBBBEE : Broad Based Black Economic EmpowermentBEC : Bid Evaluation CommitteeCCTV : Close Circuit TelevisionCFO : Chief Financial OfficerCJCP : Centre for Justice and Crime PreventionCJS : Criminal Justice SystemCPF : <strong>Community</strong> Police ForumCSF : <strong>Community</strong> <strong>Safety</strong> ForumDAC : Departmental Acquisition CouncilDID : Department of Infrastructure and DevelopmentDLTC : Driver’s Licence Testing CentreDPSA : Department of Public Service and AdministrationECD : Early Childhood DevelopmentEE : Employment EquityEXCO : Executive CouncilFBO : Faith Based OrganisationFCS : Child Protection and Sexual OffencesFIFO : First in, first outGBVPF : Gender Based Violence Prevention ForumGCRA : Global City Region AcademyGDF : <strong>Gauteng</strong> Department of FinanceGEYODI : Gender, Youth and People with DisabilitiesGIPPS : <strong>Gauteng</strong> Information on Police Performance SystemGISCC : <strong>Gauteng</strong> Intergovernmental <strong>Safety</strong> Coordinating CommitteeGPG : <strong>Gauteng</strong> Provincial GovernmentHCT : HIV Counselling and TestingHOD : Head of DepartmentHR : Human ResourceICD : Independent Complaints DirectorateICT : Information, Communication and TechnologyIFS : Interim Financial StatementsIKM : Information Knowledge ManagementIPID : Independent Police Investigative DirectorateIYM : In-Year MonitoringLEA : Law Enforcement AgencyMASP : Men As <strong>Safety</strong> PromotersMEC : Member of the Executive CouncilGeneral Information • <strong>Annual</strong> <strong>Report</strong> <strong>2011</strong>/12 |179
MMS : Middle Management ServiceMOU : Memorandum of UnderstandingMPD : Metropolitan Police DepartmentMSAU : Multi Sectoral AIDS UnitMTEF : Medium Term Expenditure FrameworkNGO : Non Governmental OrganisationNPA : National Prosecuting AuthorityNYS : National Youth ServiceOHS : Occupational Health and <strong>Safety</strong>OSS : Open Source StrategyPAIA : Promotion of Access to Information ActPAJA : Promotion of Administrative Justice ActPCCF : Provincial Crime Combating ForumPFMA : Public Finance Management ActPILIR : Policy and Procedure on Incapacity Leave and Ill-HeathPMDS : Performance Management and DevelopmentPOA : Programme of ActionPPCP : Parliamentary Portfolio Committee on PolicePSC : Public Service CommissionRAG : Resource Allocation GuideRTMC : Road Traffic Management CorporationRVO : Regional Victim OfficesSACC : South African Council of ChurchesSAHRC : South African Human Rights CommissionSAP : System Application ProgrammeSAPS : South African Police ServiceSCOPA : Standing Committee for Public AccountsSLA : Service Level AgreementSMS : Senior Management ServiceSOP : Standard Operating ProcedureSPACE : Sports Arts, Culture and EdutainmentSTI : Sexually Transmitted DiseasesTMG : Traffic Management <strong>Gauteng</strong>TMG : Traffic Management <strong>Gauteng</strong>VAWAC : Violence against women and childrenVEC : Victim Empowerment CentreVOCS : Victims of Crime SurveyVTS : Vehicle Testing Station180 | <strong>Annual</strong> <strong>Report</strong> <strong>2011</strong>/12 • Department of <strong>Community</strong> <strong>Safety</strong>
contact detailsFacebook<strong>Gauteng</strong> Department of <strong>Community</strong> <strong>Safety</strong>Twitter@Comm_<strong>Safety</strong>_GPSMS‘ABUSE’ ‘POLICE’ ‘BRIBE’Postal AddressDepartment of <strong>Community</strong> <strong>Safety</strong>P.O Box 62440MarshalltownPhysical Address78 Fox StreetJohannesburg2001Telephone011 689 3600Fax011 689 3650Websitewww.gautsafety.gpg.gov.za or www.gautengonline.gov.zaGeneral Information • <strong>Annual</strong> <strong>Report</strong> <strong>2011</strong>/12 |181
182 | <strong>Annual</strong> <strong>Report</strong> <strong>2011</strong>/12 • Department of <strong>Community</strong> <strong>Safety</strong>NOTES
General Information • <strong>Annual</strong> <strong>Report</strong> <strong>2011</strong>/12 |183
PR NUMBER: 132/<strong>2012</strong>ISBN NUMBER: 978-0-621-40901-7