NCAT Pavement Test Track - pavetrack
NCAT Pavement Test Track - pavetrack
NCAT Pavement Test Track - pavetrack

Create successful ePaper yourself
Turn your PDF publications into a flip-book with our unique Google optimized e-Paper software.
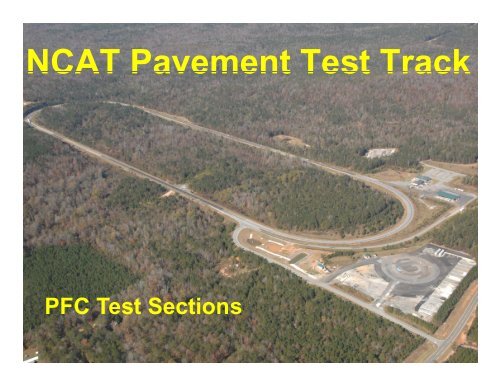
<strong>NCAT</strong> <strong>Pavement</strong> <strong>Test</strong> <strong>Track</strong>PFC <strong>Test</strong> Sections
March 10, 2010
N1 (Spray Paved PFC @ ¾”)
N2 (Tack Paved PFC @ ¾”)
N12 (12.5 Granite SMA)
N13 (9.5 / 12.5 Granite Twin PFC)
W1 (12.5 Granite SMA)
S2 (9.5 mm Gravel Superpave)
S3 (9.5 mm Gravel PFC @ 1”)
S4 (12.5 mm Limestone PFC @ 1”)
S8 (12.5 mm Granite PFC @ 1.25”)
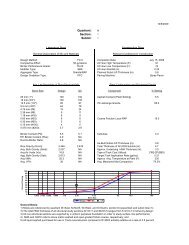
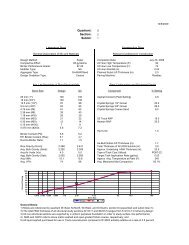
Spray Paver vs Conventional Tack
Conventional Tack
Spray Paver (Top) vs Conventional
Spray Paver vs Conventional Tack18000160001400010 ‐5 cm/ s120001000080006000400020000N1 N2 S8 S3 S4
<strong>NCAT</strong> <strong>Pavement</strong> <strong>Test</strong> <strong>Track</strong>Alternative Binders andBinder Modifiers
Alternative Binders & Modifiers• Sulfur (Thiopave)• Kraton High Polymer• Trinidad Lake Asphalt• Ground Tire Rubber
Sulfur (Shell Thiopave)• Replace up to 40% of Binder• Pelletized (no molten sulfur)• WMA to reduce emissions• No plant modifications required• Attention to detail (e.g., screed)
Kraton High Polymer• Potential for thickness reduction• Higher mix stiffness• Increased fatigue resistance• Consider strength of other layers
Trinidad Lake Asphalt• Replaces 25% of liquid asphalt• Material hasn’t changed• No plant modifications required• Shipping and handling
Ground Tire Rubber• Alternative to SBS• Wet process with Vestenamer• No plant modifications required• Separation considerations
Group Experiment (+) “Rutting”1211109Average Rut Depth (m mm)876543212.94.62.04.0 3.9 3.8 3.73.0 3.0 2.80ControlSectionPFCSurfaceRAPHMARAPWMAFoamWMAAddWMAThioThickThioStdKratonThinTLAStd
SBS vs GTR Modified PG76Cycle of Construction ti by Color (Blue=2003, Red=2006, Yellow=2009); High RAP with Texture;WMA with Green Outline; Thinner Structural Sections in Brown Boxes(Others on Perpetual Foundations); Trucking Percent Complete via Height of Gray <strong>Test</strong> Date BoxAvg Wh heelpath Deforma ation via ARAN Van (mm)121110987654/26/10 432104.64.0 41 4.13.63.8 3.73.26.96.95.74.84.63.03.0 3.1 3.5 3.7 4.0 3.92.72.9 2.82.42.01.8E5 E6 N1 N2 N3 N4 N5 N6 N7 N8 N9 N10 N11 N12 N13 W5 S2 S3 S6 S7 S8 S9 S10 S11 S12Sponsored <strong>Test</strong> SectionsGE Cont trolGE FoamGE Addi tive
Questions ?