Differential treatment in the youth justice system - Equality and ...
Differential treatment in the youth justice system - Equality and ...
Differential treatment in the youth justice system - Equality and ...
Create successful ePaper yourself
Turn your PDF publications into a flip-book with our unique Google optimized e-Paper software.
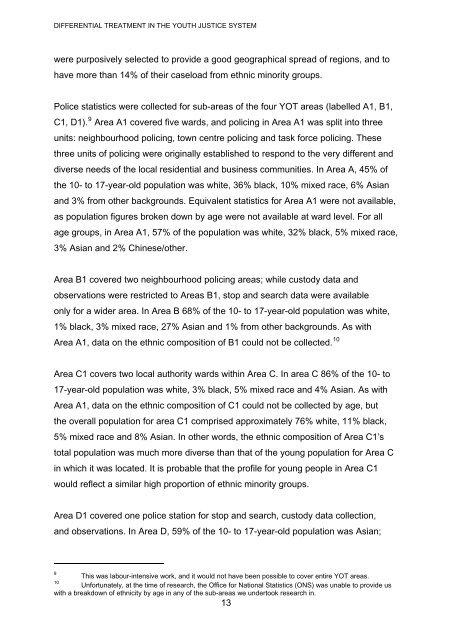
DIFFERENTIAL TREATMENT IN THE YOUTH JUSTICE SYSTEMwere purposively selected to provide a good geographical spread of regions, <strong>and</strong> tohave more than 14% of <strong>the</strong>ir caseload from ethnic m<strong>in</strong>ority groups.Police statistics were collected for sub-areas of <strong>the</strong> four YOT areas (labelled A1, B1,C1, D1). 9 Area A1 covered five wards, <strong>and</strong> polic<strong>in</strong>g <strong>in</strong> Area A1 was split <strong>in</strong>to threeunits: neighbourhood polic<strong>in</strong>g, town centre polic<strong>in</strong>g <strong>and</strong> task force polic<strong>in</strong>g. Thesethree units of polic<strong>in</strong>g were orig<strong>in</strong>ally established to respond to <strong>the</strong> very different <strong>and</strong>diverse needs of <strong>the</strong> local residential <strong>and</strong> bus<strong>in</strong>ess communities. In Area A, 45% of<strong>the</strong> 10- to 17-year-old population was white, 36% black, 10% mixed race, 6% Asian<strong>and</strong> 3% from o<strong>the</strong>r backgrounds. Equivalent statistics for Area A1 were not available,as population figures broken down by age were not available at ward level. For allage groups, <strong>in</strong> Area A1, 57% of <strong>the</strong> population was white, 32% black, 5% mixed race,3% Asian <strong>and</strong> 2% Ch<strong>in</strong>ese/o<strong>the</strong>r.Area B1 covered two neighbourhood polic<strong>in</strong>g areas; while custody data <strong>and</strong>observations were restricted to Areas B1, stop <strong>and</strong> search data were availableonly for a wider area. In Area B 68% of <strong>the</strong> 10- to 17-year-old population was white,1% black, 3% mixed race, 27% Asian <strong>and</strong> 1% from o<strong>the</strong>r backgrounds. As withArea A1, data on <strong>the</strong> ethnic composition of B1 could not be collected. 10Area C1 covers two local authority wards with<strong>in</strong> Area C. In area C 86% of <strong>the</strong> 10- to17-year-old population was white, 3% black, 5% mixed race <strong>and</strong> 4% Asian. As withArea A1, data on <strong>the</strong> ethnic composition of C1 could not be collected by age, but<strong>the</strong> overall population for area C1 comprised approximately 76% white, 11% black,5% mixed race <strong>and</strong> 8% Asian. In o<strong>the</strong>r words, <strong>the</strong> ethnic composition of Area C1’stotal population was much more diverse than that of <strong>the</strong> young population for Area C<strong>in</strong> which it was located. It is probable that <strong>the</strong> profile for young people <strong>in</strong> Area C1would reflect a similar high proportion of ethnic m<strong>in</strong>ority groups.Area D1 covered one police station for stop <strong>and</strong> search, custody data collection,<strong>and</strong> observations. In Area D, 59% of <strong>the</strong> 10- to 17-year-old population was Asian;910This was labour-<strong>in</strong>tensive work, <strong>and</strong> it would not have been possible to cover entire YOT areas.Unfortunately, at <strong>the</strong> time of research, <strong>the</strong> Office for National Statistics (ONS) was unable to provide uswith a breakdown of ethnicity by age <strong>in</strong> any of <strong>the</strong> sub-areas we undertook research <strong>in</strong>.13


