The Polar Area Diagrams of Florence Nightingale - debbiebaker
The Polar Area Diagrams of Florence Nightingale - debbiebaker
The Polar Area Diagrams of Florence Nightingale - debbiebaker

You also want an ePaper? Increase the reach of your titles
YUMPU automatically turns print PDFs into web optimized ePapers that Google loves.
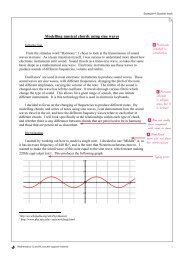
Example 6: Student workFigure 1<strong>The</strong> basic ideas are very simple. <strong>The</strong> blue area represents deaths due to disease, the redarea represents death due to wounds in battle and the black area represents death due toother causes.I tried to find a copy <strong>of</strong> the data which this diagram represented, but I had no luck, so Idecided to make sure I understood exactly how the diagram was made and to make myown version <strong>of</strong> some data which I did have to hand. Once I tried to understand thediagram in detail I found there were some problems.<strong>The</strong> First ProblemC Studentdemonstratespersonal interestin topic.I wasn’t sure whether the black area in a shape such as this:was supposed to bethis areaor this areaD Good criticalreflection onproblems relatedto objectiveMathematics SL and HL teacher support material 2