GETTING STARTED USER GUIDE - ChartNexus
GETTING STARTED USER GUIDE - ChartNexus
GETTING STARTED USER GUIDE - ChartNexus

Create successful ePaper yourself
Turn your PDF publications into a flip-book with our unique Google optimized e-Paper software.
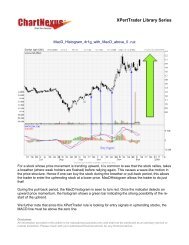
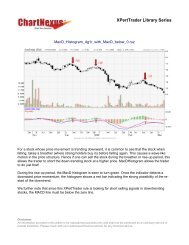
<strong>GETTING</strong> <strong>STARTED</strong><strong>USER</strong> <strong>GUIDE</strong>In the highly competitive stock market, it is crucial that you have the righttool to help you make sound trading decisions.<strong>ChartNexus</strong> is just this tool for you.<strong>ChartNexus</strong> is a financial charting software that allows you to view andanalyse the charts of the stocks of the world’s leading stock markets withTechnical Analysis studies.Chart Your Successwww.<strong>ChartNexus</strong>.com| Getting Started User Guide
HOW TO01. LOGIN INTO YOUR ACCOUNTIf you have not downloaded the free <strong>ChartNexus</strong> software, you can do so athttp://www.chartnexus.com/software/cnx.phpDoubleclick on the CNX iconon your desktop or in your saved folder.Upon starting up your <strong>ChartNexus</strong> software, you will be greeted with a User LoginWindow.CNXFig 1.2: User Login WindowKey in your Username/Email and Password, then click on OK to log in.Chart Your Successwww.<strong>ChartNexus</strong>.com | Getting Started User Guide 1
HOW TO Select Market and02. Update Latest Data2.1 Updating Latest Market DataIf the <strong>ChartNexus</strong> software detects an internet connection, it will automatically updatethe latest data for the selected markets.You may hide the window for the EndOfDay updates by clicking on the button shownin the picture below:Fig 2.1: Hiding EndOfDay Updates WindowYou can also manually initialize the market data updating process. To do so, click onthe “Start” button on the top left side of the window, followed by the “DownloadMarket Data” button.Fig 2.2: Manual Update of Market DataChart Your Successwww.<strong>ChartNexus</strong>.com | Getting Started User Guide 2
2.2 Selecting or Adding MarketsTo select or add desired markets, click on “System Settings” button.Fig 2.3: Locating the “System Settings” buttonSelect “Data” at the top of the window to view the markets available for download.You may select more than one market by clicking on the checkboxes on the right.Fig 2.4: Selecting desired marketsDo remember to apply the settings before closing the window by clicking on the“Apply” button at the bottom of the window.Chart Your Successwww.<strong>ChartNexus</strong>.com | Getting Started User Guide 3
STEP BClick on the small arrow on the topleft to select which market you wouldbe interested to look at. Using ourabove example of F&N (Fraser &Neave), we will select “SGX”.Fig 3.2: Selecting the Market (Country)Chart Your Successwww.<strong>ChartNexus</strong>.com | Getting Started User Guide 5
STEP CSelect the first letter of the stockcounter you are searching for, forexample, F for F&N.Fig 3.3: Alphabetical Search of Stock CounterChart Your Successwww.<strong>ChartNexus</strong>.com | Getting Started User Guide 6
STEP DFrom the list below, find anddoubleclick on the desired stockcounter.Fig 3.4: Selecting the Desired Stock CounterChart Your Successwww.<strong>ChartNexus</strong>.com | Getting Started User Guide 7
STEP EHurray!You will see the chart appear on the right window, resembling this:Fig 3.5: Chart of Stock Counter F&NChart Your Successwww.<strong>ChartNexus</strong>.com | Getting Started User Guide 8
You should see the “Volume” table bar graphs at the bottom of your stock chart, like inthe example below:Fig 4.1: Selecting “Volume” on the Indicators Window4.2 Moving AverageIn the same “Indicators” window found on the bottom left of the user interface, scrolldown and tick the checkbox next to the “Moving Average” option.Fig 4.3: Selecting “Moving Average” on the Indicators WindowChart Your Successwww.<strong>ChartNexus</strong>.com | Getting Started User Guide 10
After the “Moving Average” option is selected, you should see a red line running acrossthe candlesticks.Fig 4.1: Selecting “Volume” on the Indicators WindowHere you are, how to add Volume and the Moving Average indicator into youreasytonavigate stock charts in just a few simple steps!Congratulation!You are GOOD TO GO!Congrats on getting started in trading analysis and more importantly, discovering<strong>ChartNexus</strong>, which will provide you the leading edge in predicting stock price action!Now that you have started on your <strong>ChartNexus</strong> software, here’s wishing you afruitful and fulfilling trading education with us.The <strong>ChartNexus</strong> software comes with 3 years of historical data free, however, if youwant more data or you need a stock screener that screens the market for stockssatisfying certain technical criteria, feel free to visit the link below.!""#$%%&&&'(!)*"+,-./'(01%/02"&)*,%3+4,-'#!#Remember, the more knowledge you are equipped with, the easier you can make aninformed choice and ride the waves of the turbulent financial markets.Chart Your Successwww.<strong>ChartNexus</strong>.com | Getting Started User Guide 11
Still Unsure of how toInterpret the charts?Do join us at our Handholding workshops, where our experienced trainers will explainhow to fully utilize the Technical Indicators on <strong>ChartNexus</strong> software and share theBasics of Technical Analysis with you.SIMPLY CONTACT US AND COME ON DOWN FOR OURFREE EDUCATIONAL SEMINARS TODAY!Start developing your ownwinning trading strategy & Chart Your Successtoday!For assistance,do feel free to drop us a mail at support@chartnexus.comWE WOULD LOVETO HEAR FROM YOU & PROVIDE YOU OUR BEST GUIDANCE!Chart Your Successwww.<strong>ChartNexus</strong>.com | Getting Started User Guide 12