- Page 1 and 2: EconomicReportof thePresidentTransm
- Page 4 and 5: C O N T E N T SPageECONOMIC REPORT
- Page 7 and 8: ECONOMIC REPORT OF THE PRESIDENTTo
- Page 9: $2 billion to a new international c
- Page 13: LETTER OF TRANSMITTALCouncil of Eco
- Page 16 and 17: chapter 3. the causes and consequen
- Page 18 and 19: appendixesA. Report to the Presiden
- Page 20 and 21: 2-5. Mortgage Lending Today........
- Page 22 and 23: Chapter 1: The Year in Reviewand th
- Page 24 and 25: Chapter 3: The Causes and Consequen
- Page 26 and 27: • Tax reductions in 2001 and 2003
- Page 28 and 29: • More effective statistical use
- Page 30 and 31: • Real GDP posted solid 2.5 perce
- Page 32 and 33: elative to non-energy prices, while
- Page 34 and 35: nonconforming mortgages in 2007. In
- Page 36 and 37: In addition to incomes and mortgage
- Page 38 and 39: Business InventoriesInventory inves
- Page 40 and 41: Indeed, the growth in foreign econo
- Page 42 and 43: During the 12 months of 2007, the u
- Page 44 and 45: output measures announced in the an
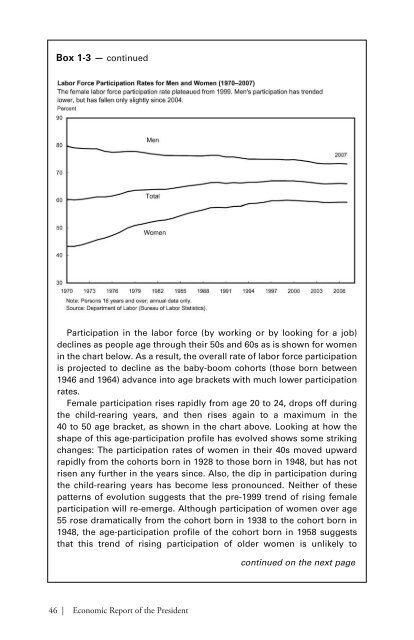
- Page 46 and 47: and government purchases. In contra
- Page 48 and 49: Table 1-1.—Administration Economi
- Page 52 and 53: finalized), below its 1963-2006 ave
- Page 55 and 56: C H A P T E R 2Credit and Housing M
- Page 57 and 58: lends a debtor money today, which t
- Page 59 and 60: Box 2-1 — continuedPrime loan: Lo
- Page 61 and 62: Box 2-2 — continuedNRSROs. Critic
- Page 63 and 64: Box 2-3 — continuedMortgage defau
- Page 65 and 66: Box 2-3 — continuedmortgage defau
- Page 67 and 68: Corporate bond yields also rose rel
- Page 69 and 70: conduits in that SIVs have less acc
- Page 71 and 72: International ImplicationsA notable
- Page 73 and 74: come together to create a coordinat
- Page 75 and 76: home is forgiven, that portion is t
- Page 77 and 78: alternatives offered in the convent
- Page 79 and 80: to such a change in wealth, which a
- Page 81: lending. FHA Modernization will enc
- Page 84 and 85: Economists often call attention to
- Page 86 and 87: Box 3-1: Trade in ServicesDiscussio
- Page 88 and 89: Box 3-2: The Current Account Defici
- Page 90 and 91: Growth in Domestic ProductionA seco
- Page 92 and 93: Exports and Foreign Direct Investme
- Page 94 and 95: in CFIUS’s role in protecting nat
- Page 96 and 97: these goods than if they were produ
- Page 98 and 99: y import competition are electrical
- Page 101 and 102:
C H A P T E R 4The Importance of He
- Page 103 and 104:
Box 4-1: Health Effects on Job Prod
- Page 105 and 106:
health care spending growth. Rising
- Page 107 and 108:
While the study focused on spending
- Page 109 and 110:
Box 4-2 — continuedand without pr
- Page 111 and 112:
effective price of zero. Even if a
- Page 113 and 114:
deduction for health insurance to a
- Page 115 and 116:
To reduce the extent to which high-
- Page 117 and 118:
Administration supports broad adopt
- Page 119 and 120:
C H A P T E R 5Tax PolicySocieties
- Page 121 and 122:
in 2000. Tax revenues increased str
- Page 123 and 124:
Alternative Minimum TaxPrior to 196
- Page 125 and 126:
The Impact of Recent Tax Reductions
- Page 127 and 128:
35 percent marginal tax rate on the
- Page 129 and 130:
C corporations fall under the corpo
- Page 131 and 132:
Significance of Tax Cuts to Individ
- Page 133 and 134:
Box 5-1: Marriage Penalty BasicsIt
- Page 135 and 136:
The Structure of Business TaxesDesp
- Page 137 and 138:
investments are made. A more modest
- Page 139 and 140:
able to defer $35 of tax liability
- Page 141 and 142:
C H A P T E R 6The Nation’s Infra
- Page 143 and 144:
A monopolistic bridge owner may cho
- Page 145 and 146:
etween places to accommodating grow
- Page 147 and 148:
the same time. At hours when many d
- Page 149 and 150:
BridgesOn August 1, 2007, the I-35W
- Page 151 and 152:
where shippers have an alternative
- Page 153 and 154:
Freight shipments into and out of t
- Page 155 and 156:
Box 6-2: Delays at New York City Ai
- Page 157 and 158:
uilt, the marginal cost of transmis
- Page 159 and 160:
access was in mobile wireless conne
- Page 161 and 162:
Infrastructure PolicyThough the U.S
- Page 163 and 164:
could shorten the wait by adding an
- Page 165 and 166:
In 2005, the Federal Aviation Admin
- Page 167 and 168:
C H A P T E R 7Searching for Altern
- Page 169 and 170:
The first U.S. oil well was drilled
- Page 171 and 172:
Most of the oil consumed in the Uni
- Page 173 and 174:
Also, depending on the fuel and tec
- Page 175 and 176:
Table 7-1. —Estimated Average Lev
- Page 177 and 178:
Nevada. The facility is expected to
- Page 179 and 180:
Wind PowerWind power supplies about
- Page 181 and 182:
amounts of electricity, it could be
- Page 183 and 184:
years, as corn-based ethanol produc
- Page 185 and 186:
the power, range, and convenient fu
- Page 187 and 188:
other petroleum products is project
- Page 189 and 190:
To help meet the growing demand for
- Page 191 and 192:
C H A P T E R 8Improving Economic S
- Page 193 and 194:
The second largest Federal statisti
- Page 195 and 196:
As shown in Chart 8-3, spending on
- Page 197 and 198:
Monetary and fiscal policymakers al
- Page 199 and 200:
service-sector output much more fre
- Page 201 and 202:
Box 8-1: How to Reverse a Decline i
- Page 203 and 204:
Information Protection and Statisti
- Page 205 and 206:
forward instead of the growth rate
- Page 207:
Appendix AREPORT TO THE PRESIDENT O
- Page 210 and 211:
Council Members and Their Dates of
- Page 213 and 214:
Report to the President on theActiv
- Page 215 and 216:
The Council also prepared in-depth
- Page 217 and 218:
The Staff of the Council of Economi
- Page 219:
Jane Tufts, Bruce Kaplan, and Anna
- Page 223 and 224:
C O N T E N T SNational Income or E
- Page 225 and 226:
Prices—ContinuedPageB-63. Changes
- Page 227 and 228:
General NotesDetail in these tables
- Page 229 and 230:
Table B-1.—Gross domestic product
- Page 231 and 232:
Table B-2.—Real gross domestic pr
- Page 233 and 234:
Table B-4.—Percent changes in rea
- Page 235 and 236:
Table B-5.—Contributions to perce
- Page 237 and 238:
Table B-6.—Chain-type quantity in
- Page 239 and 240:
Table B-7.—Chain-type price index
- Page 241 and 242:
Table B-9.—Real gross domestic pr
- Page 243 and 244:
Table B-11.—Real gross value adde
- Page 245 and 246:
Table B-12.—Gross domestic produc
- Page 247 and 248:
Table B-13.—Real gross domestic p
- Page 249 and 250:
Table B-15.—Gross value added and
- Page 251 and 252:
Table B-17.—Real personal consump
- Page 253 and 254:
Table B-19.—Real private fixed in
- Page 255 and 256:
Table B-21.—Real government consu
- Page 257 and 258:
QuarterTable B-23.—Real private i
- Page 259 and 260:
Table B-25.—Real exports and impo
- Page 261 and 262:
Table B-27.—Relation of national
- Page 263 and 264:
Table B-28.—National income by ty
- Page 265 and 266:
Table B-29.—Sources of personal i
- Page 267 and 268:
Table B-31.—Total and per capita
- Page 269 and 270:
Table B-32.—Gross saving and inve
- Page 271 and 272:
Population, Employment, Wages, and
- Page 273 and 274:
Table B-35.—Civilian population a
- Page 275 and 276:
Table B-37.—Civilian employment b
- Page 277 and 278:
Table B-39.—Civilian labor force
- Page 279 and 280:
Table B-41.—Civilian employment/p
- Page 281 and 282:
Table B-43.—Civilian unemployment
- Page 283 and 284:
Table B-45.—Unemployment insuranc
- Page 285 and 286:
Table B-46.—Employees on nonagric
- Page 287 and 288:
Table B-48.—Employment cost index
- Page 289 and 290:
Table B-50.—Changes in productivi
- Page 291 and 292:
Table B-52.—Industrial production
- Page 293 and 294:
Table B-54.—Capacity utilization
- Page 295 and 296:
Table B-56.—New private housing u
- Page 297 and 298:
Table B-58.—Manufacturers’ ship
- Page 299 and 300:
PricesTable B-60.—Consumer price
- Page 301 and 302:
Table B-61.—Consumer price indexe
- Page 303 and 304:
Table B-63.—Changes in special co
- Page 305 and 306:
Year or monthTable B-65.—Producer
- Page 307 and 308:
Table B-66.—Producer price indexe
- Page 309 and 310:
Table B-67.—Producer price indexe
- Page 311 and 312:
Year and monthMoney Stock, Credit,
- Page 313 and 314:
Table B-70.—Components of money s
- Page 315 and 316:
Table B-72.—Bank credit at all co
- Page 317 and 318:
Table B-73.—Bond yields and inter
- Page 319 and 320:
Table B-74.—Credit market borrowi
- Page 321 and 322:
Table B-76.—Mortgage debt outstan
- Page 323 and 324:
Government FinanceTable B-78.—Fed
- Page 325 and 326:
Table B-80.—Federal receipts and
- Page 327 and 328:
Table B-82.—Federal and State and
- Page 329 and 330:
Table B-84.—Federal Government cu
- Page 331 and 332:
Table B-86.—State and local gover
- Page 333 and 334:
Table B-88.—Maturity distribution
- Page 335 and 336:
Corporate Profits and FinanceTable
- Page 337 and 338:
Table B-92.—Corporate profits of
- Page 339 and 340:
Table B-94.—Relation of profits a
- Page 341 and 342:
Year or monthTable B-96.—Common s
- Page 343 and 344:
Table B-98.—Farm business balance
- Page 345 and 346:
YearTotalTable B-100.—Farm input
- Page 347 and 348:
Table B-102.—U.S. exports and imp
- Page 349 and 350:
Table B-103.—U.S. international t
- Page 351 and 352:
Table B-105.—U.S. international t
- Page 353 and 354:
Table B-107.—International invest
- Page 355 and 356:
Table B-109.—Civilian unemploymen
- Page 357 and 358:
Table B-111.—International reserv