Guinness Peat Group plc
Notes to Financial Statements - Guinness Peat Group plc
Notes to Financial Statements - Guinness Peat Group plc

You also want an ePaper? Increase the reach of your titles
YUMPU automatically turns print PDFs into web optimized ePapers that Google loves.
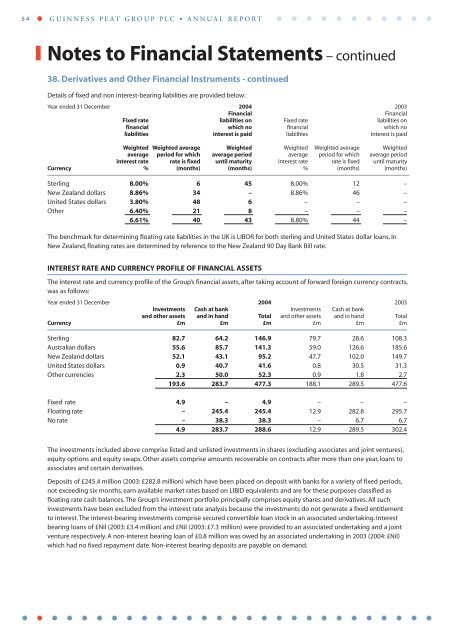
54 GUINNESS PEAT GROUP PLC • ANNUAL REPORTNotes to Financial Statements – continued38. Derivatives and Other Financial Instruments - continuedDetails of fixed and non interest-bearing liabilities are provided below:Year ended 31 December 2004 2003FinancialFinancialFixed rate liabilities on Fixed rate liabilities onfinancial which no financial which noliabilities interest is paid liabilities interest is paidWeighted Weighted average Weighted Weighted Weighted average Weightedaverage period for which average period average period for which average periodinterest rate rate is fixed until maturity interest rate rate is fixed until maturityCurrency % (months) (months) % (months) (months)Sterling 8.00% 6 45 8.00% 12 –New Zealand dollars 8.86% 34 – 8.86% 46 –United States dollars 3.80% 48 6 – – –Other 6.40% 21 8 – – –6.61% 40 43 8.80% 44 –The benchmark for determining floating rate liabilities in the UK is LIBOR for both sterling and United States dollar loans. InNew Zealand, floating rates are determined by reference to the New Zealand 90 Day Bank Bill rate.INTEREST RATE AND CURRENCY PROFILE OF FINANCIAL ASSETSThe interest rate and currency profile of the <strong>Group</strong>’s financial assets, after taking account of forward foreign currency contracts,was as follows:Year ended 31 December 2004 2003Investments Cash at bank Investments Cash at bankand other assets and in hand Total and other assets and in hand TotalCurrency £m £m £m £m £m £mSterling 82.7 64.2 146.9 79.7 28.6 108.3Australian dollars 55.6 85.7 141.3 59.0 126.6 185.6New Zealand dollars 52.1 43.1 95.2 47.7 102.0 149.7United States dollars 0.9 40.7 41.6 0.8 30.5 31.3Other currencies 2.3 50.0 52.3 0.9 1.8 2.7193.6 283.7 477.3 188.1 289.5 477.6Fixed rate 4.9 – 4.9 – – –Floating rate – 245.4 245.4 12.9 282.8 295.7No rate – 38.3 38.3 – 6.7 6.74.9 283.7 288.6 12.9 289.5 302.4The investments included above comprise listed and unlisted investments in shares (excluding associates and joint ventures),equity options and equity swaps. Other assets comprise amounts recoverable on contracts after more than one year, loans toassociates and certain derivatives.Deposits of £245.4 million (2003: £282.8 million) which have been placed on deposit with banks for a variety of fixed periods,not exceeding six months, earn available market rates based on LIBID equivalents and are for these purposes classified asfloating rate cash balances. The <strong>Group</strong>’s investment portfolio principally comprises equity shares and derivatives. All suchinvestments have been excluded from the interest rate analysis because the investments do not generate a fixed entitlementto interest. The interest-bearing investments comprise secured convertible loan stock in an associated undertaking. Interestbearing loans of £Nil (2003: £3.4 million) and £Nil (2003: £7.3 million) were provided to an associated undertaking and a jointventure respectively. A non-interest bearing loan of £0.8 million was owed by an associated undertaking in 2003 (2004: £Nil)which had no fixed repayment date. Non-interest bearing deposits are payable on demand.