analyses
Студије и анализе - Републички завод за статистику
Студије и анализе - Републички завод за статистику

You also want an ePaper? Increase the reach of your titles
YUMPU automatically turns print PDFs into web optimized ePapers that Google loves.
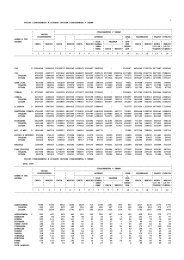
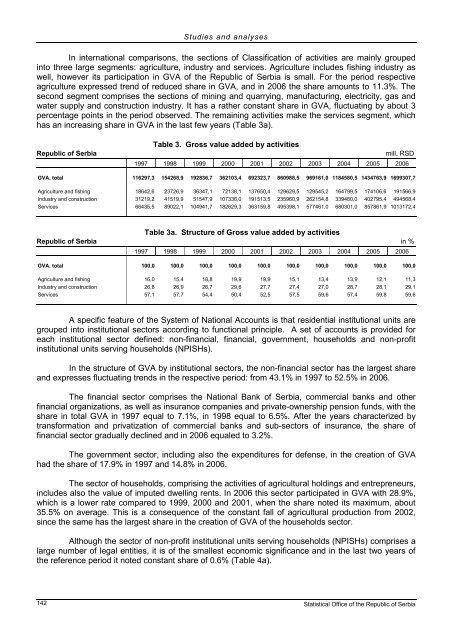
Studies and <strong>analyses</strong>In international comparisons, the sections of Classification of activities are mainly groupedinto three large segments: agriculture, industry and services. Agriculture includes fishing industry aswell, however its participation in GVA of the Republic of Serbia is small. For the period respectiveagriculture expressed trend of reduced share in GVA, and in 2006 the share amounts to 11.3%. Thesecond segment comprises the sections of mining and quarrying, manufacturing, electricity, gas andwater supply and construction industry. It has a rather constant share in GVA, fluctuating by about 3percentage points in the period observed. The remaining activities make the services segment, whichhas an increasing share in GVA in the last few years (Table 3a).Republic of SerbiaТable 3. Gross value added by activitiesmill. RSD1997 1998 1999 2000 2001 2002 2003 2004 2005 2006GVA, total 116297,3 154268,9 192836,7 362103,4 692323,7 860988,5 969161,0 1184580,5 1434763,9 1699307,7Agriculture and fishing 18642,6 23726,9 36347,1 72138,1 137650,4 129629,5 129545,2 164799,5 174106,6 191566,9Industry and construction 31219,2 41519,9 51547,9 107336,0 191513,5 235960,9 262154,8 339480,0 402795,4 494568,4Services 66435,5 89022,1 104941,7 182629,3 363159,8 495398,1 577461,0 680301,0 857861,9 1013172,4Тable 3a. Structure of Gross value added by activitiesRepublic of Serbia in %1997 1998 1999 2000 2001 2002 2003 2004 2005 2006GVA, total 100,0 100,0 100,0 100,0 100,0 100,0 100,0 100,0 100,0 100,0Agriculture and fishing 16,0 15,4 18,8 19,9 19,9 15,1 13,4 13,9 12,1 11,3Industry and construction 26,8 26,9 26,7 29,6 27,7 27,4 27,0 28,7 28,1 29,1Services 57,1 57,7 54,4 50,4 52,5 57,5 59,6 57,4 59,8 59,6A specific feature of the System of National Accounts is that residential institutional units aregrouped into institutional sectors according to functional principle. A set of accounts is provided foreach institutional sector defined: non-financial, financial, government, households and non-profitinstitutional units serving households (NPISHs).In the structure of GVA by institutional sectors, the non-financial sector has the largest shareand expresses fluctuating trends in the respective period: from 43.1% in 1997 to 52.5% in 2006.The financial sector comprises the National Bank of Serbia, commercial banks and otherfinancial organizations, as well as insurance companies and private-ownership pension funds, with theshare in total GVA in 1997 equal to 7.1%, in 1998 equal to 6.5%. After the years characterized bytransformation and privatization of commercial banks and sub-sectоrs of insurance, the share offinancial sector gradually declined and in 2006 equaled to 3.2%.The government sector, including also the expenditures for defense, in the creation of GVAhad the share of 17.9% in 1997 and 14.8% in 2006.The sector of households, comprising the activities of agricultural holdings and entrepreneurs,includes also the value of imputed dwelling rents. In 2006 this sector participated in GVA with 28.9%,which is a lower rate compared to 1999, 2000 and 2001, when the share noted its maximum, about35.5% on average. This is a consequence of the constant fall of agricultural production from 2002,since the same has the largest share in the creation of GVA of the households sector.Although the sector of non-profit institutional units serving households (NPISHs) comprises alarge number of legal entities, it is of the smallest economic significance and in the last two years ofthe reference period it noted constant share of 0.6% (Table 4a).142Statistical Office of the Republic of Serbia