Draft
Strategy for a Sustainable Region Priority ... - One Bay Area
Strategy for a Sustainable Region Priority ... - One Bay Area
- No tags were found...

You also want an ePaper? Increase the reach of your titles
YUMPU automatically turns print PDFs into web optimized ePapers that Google loves.
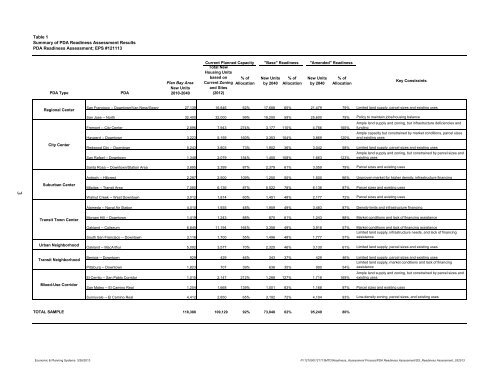
Table 1<br />
Summary of PDA Readiness Assessment Results<br />
PDA Readiness Assessment; EPS #121113<br />
PDA Type<br />
PDA<br />
Plan Bay Area<br />
New Units<br />
2010-2040<br />
Current Planned Capacity<br />
Total New<br />
Housing Units<br />
based on % of<br />
Current Zoning Allocation<br />
and Sites<br />
(2012)<br />
"Base" Readiness<br />
New Units<br />
by 2040<br />
% of<br />
Allocation<br />
"Amended" Readiness<br />
New Units<br />
by 2040<br />
% of<br />
Allocation<br />
Key Constraints<br />
Regional Center<br />
City Center<br />
San Francisco -- Downtown/Van Ness/Geary 27,139 16,846 62% 17,688 65% 21,479 79% Limited land supply, parcel sizes and existing uses<br />
San Jose -- North 32,400 32,000 99% 19,200 59% 25,600 79% Policy to maintain jobs/housing balance<br />
Fremont -- City Center 2,896 7,943 274% 3,177 110% 4,766 165%<br />
Hayward -- Downtown 3,223 5,159 160% 3,353 104% 3,869 120%<br />
Ample land supply and zoning, but infrastructure deficiencies and<br />
funding<br />
Ample capacity but constrained by market conditions, parcel sizes<br />
and existing uses<br />
Redwood City -- Downtown 5,243 3,803 73% 1,902 36% 3,042 58% Limited land supply, parcel sizes and existing uses<br />
San Rafael -- Downtown 1,348 2,079 154% 1,455 108% 1,663 123%<br />
Ample land supply and zoning, but constrained by parcel sizes and<br />
existing uses<br />
Santa Rosa -- Downtown/Station Area 3,895 3,399 87% 2,379 61% 3,059 79% Parcel sizes and existing uses<br />
3<br />
Suburban Center<br />
Antioch -- Hillcrest 2,287 2,500 109% 1,250 55% 1,500 66% Unproven market for higher density, infrastructure financing<br />
Milpitas -- Transit Area 7,080 6,136 87% 5,522 78% 6,136 87% Parcel sizes and existing uses<br />
Walnut Creek -- West Downtown 3,012 1,814 60% 1,451 48% 2,177 72% Parcel sizes and existing uses<br />
Transit Town Center<br />
Urban Neighborhood<br />
Transit Neighborhood<br />
Mixed-Use Corridor<br />
Alameda -- Naval Air Station 4,010 1,935 48% 1,959 49% 3,483 87% Density limits and infrastructure financing<br />
Morgan Hill -- Downtown 1,419 1,243 88% 870 61% 1,243 88% Market conditions and lack of financing assistance<br />
Oakland -- Coliseum 6,845 11,194 164% 3,358 49% 3,918 57% Market conditions and lack of financing assistance<br />
Limited land supply, infrastructure needs, and lack of financing<br />
South San Francisco -- Downtown 3,116 1,700 55% 1,496 48% 1,777 57% assistance<br />
Oakland -- MacArthur 5,092 3,577 70% 2,325 46% 3,130 61% Limited land supply, parcel sizes and existing uses<br />
Benicia -- Downtown 929 429 46% 343 37% 429 46% Limited land supply, parcel sizes and existing uses<br />
Limited land supply, market conditions and lack of financing<br />
Pittsburg -- Downtown 1,823 707 39% 636 35% 990 54% assistance<br />
El Cerrito -- San Pablo Corridor 1,015 2,147 212% 1,288 127% 1,718 169%<br />
San Mateo -- El Camino Real 1,204 1,668 139% 1,001 83% 1,168 97% Parcel sizes and existing uses<br />
Ample land supply and zoning, but constrained by parcel sizes and<br />
existing uses<br />
Sunnyvale -- El Camino Real 4,412 2,850 65% 3,192 72% 4,104 93% Low-density zoning, parcel sizes, and existing uses<br />
TOTAL SAMPLE 118,388 109,129 92% 73,848 62% 95,249 80%<br />
Economic & Planning Systems 3/26/2013<br />
P:\121000\121113MTC\Readiness_Assessment Process\PDA Readiness Assessment\DS_Readiness Assessment_032513