News letter Dam edition
News letter Dam edition
News letter Dam edition
- No tags were found...

Create successful ePaper yourself
Turn your PDF publications into a flip-book with our unique Google optimized e-Paper software.
<strong>News</strong><br />
<strong>letter</strong><br />
Double Issue 2007/2008<br />
<strong>Dam</strong> <strong>edition</strong><br />
Guest-editor Michiel Maurenbrecher: Analysing the analysis of the Malpasset arch dam failure of 1959 - Estimating ‘efficiencypermeability’<br />
of upstream cut-off membranes for dams<br />
Water at the desert fringe: The Marib dams and irrigation schemes in the Republic of Yemen - <strong>Dam</strong> and canal design on soluble rock,<br />
Ethiopia - <strong>Dam</strong>s in the Western USA - Verification of two-dimensional numerical earthquake site effects on a dam site, Costa Rica - Moraine<br />
dams and glacier lake outburst floods (GLOF), Nepal - Thesis abstracts - 10th IAEG Congress, Nottingham - The activities of the<br />
Netherlands’ National Committee on Large <strong>Dam</strong>s (NETHCOLD) - GeoGolf - Book review - Piping phenomenon in earth dams, Cuba - Professor’s<br />
Column: Ode to Ground - Engineering geologist abroad - Excursion to Hubertustunnel - In the spotlights: De Ondergrondse -<br />
Excursion to GeoCentrifuge - 11th ISRM Congress, Lisbon
Colophon<br />
Ingeokring, founded in 1974, is the Dutch association of engineering geologists. It is the largest section of KNGMG (Royal Geological<br />
and Mining Society of the Netherlands). Ingeokring also forms the Netherlands National Group of the International Association for<br />
Engineering Geology and the environment (IAEG).<br />
With over 200 members working in different organizations, ranging from universities and research institutes to contractors, from consultancy<br />
firms to various governmental organizations, Ingeokring plays a vital role in the communication between engineering geologists<br />
in the Netherlands.<br />
The objective of the <strong>News</strong><strong>letter</strong> is to inform the members of the Ingeokring, and other interested parties, on topics related to engineering<br />
geology, varying from detailed articles, book reviews and student affairs to announcements of the Ingeokring and current<br />
developments in the field of engineering geology. The <strong>News</strong><strong>letter</strong> wants to make engineering geology better known by improving<br />
the understanding of the different aspects of engineering geology.<br />
Board of the Ingeokring<br />
President<br />
Secretary<br />
Treasurer<br />
Member & representative ISRM<br />
Member<br />
Member<br />
Representative “De Ondergrondse”<br />
Editorial board of the <strong>News</strong><strong>letter</strong><br />
Ir. P.M. Maurenbrecher (guest editor)<br />
Ir. H.G.P. Wibbens<br />
Ir. W. Tegtmeier<br />
Ir. E.J. Schoute<br />
Ir. J.K. Haasnoot<br />
Ms. P.E.D.M. Kouwenberg<br />
Ir. J. van der Schrier<br />
Ir. M. Remijn<br />
Ir. L.A. van Paassen<br />
Ing. W. Verwaal<br />
Dr. P.N.W. Verhoef<br />
Ir. J. Mollé<br />
Ms. P.E.D.M. Kouwenberg<br />
Correspondence concerning the <strong>News</strong><strong>letter</strong> (articles, advertising,<br />
etc.) to:<br />
Ir. E.J. Schoute<br />
Meent 38-D<br />
3011 JL Rotterdam<br />
E-mail: erikschoute@hotmail.com<br />
Subscription to the <strong>News</strong><strong>letter</strong><br />
Each member of the Ingeokring receives at least once a year a<br />
new <strong>edition</strong> of the <strong>News</strong><strong>letter</strong>. Membership fee for the Ingeokring<br />
is € 16,-, student membership fee is € 8,-.<br />
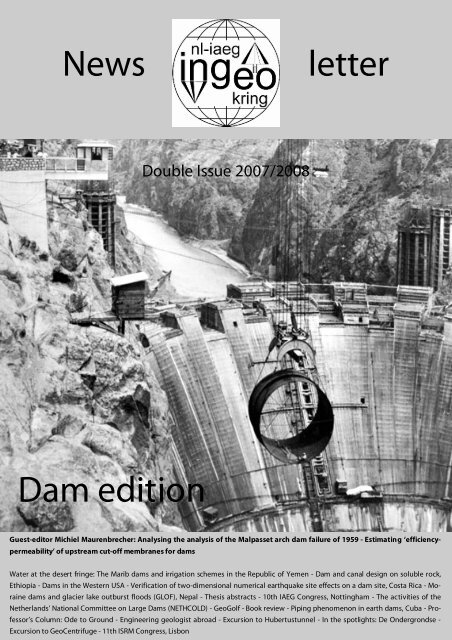
Cover photo:<br />
Hoover <strong>Dam</strong> under construction (1931-1936)<br />
(source: www.eng.auburn.edu/users/zechwes/pictures.html).<br />
Correspondence concerning the Ingeokring (address<br />
changes, membership, etc.) to:<br />
Ir. M. Remijn<br />
Van Heemstrastraat 17<br />
2613 CD Delft<br />
Guidelines for authors of articles for the <strong>News</strong><strong>letter</strong> and<br />
information about advertising in the <strong>News</strong><strong>letter</strong> can be<br />
found at the inside of the back cover.<br />
ISSN 1384-1351<br />
E-mail: secretaris@ingeokring.nl
Ingeokring <strong>News</strong><strong>letter</strong><br />
Table of contents<br />
Advertisers index.......................................................................................................................................................................................................... 2<br />
From the Chairman ...................................................................................................................................................................................................... 3<br />
Editorial............................................................................................................................................................................................................................ 4<br />
Ingeokring Jaarverslag 2006..................................................................................................................................................................................... 6<br />
Analysing the analysis of the Malpasset arch dam failure of 1959 .............................................................................................................. 8<br />
Professor’s Column: Ode to ground.....................................................................................................................................................................16<br />
Moraine dams and glacier lake outburst floods (GLOF) ................................................................................................................................18<br />
In the spotlights: De Ondergrondse.....................................................................................................................................................................22<br />
<strong>Dam</strong> and canal design on soluble rock (West Gode Irrigation Project, Ethiopia) .................................................................................23<br />
Engineering geologist abroad ...............................................................................................................................................................................40<br />
Estimating ‘efficiency-permeability’ of upstream cut-off membranes for dams ..................................................................................42<br />
Review of the 10th IAEG Congress, September 2006, Nottingham (UK) .................................................................................................45<br />
Piping phenomenon in earth dams: case histories.........................................................................................................................................47<br />
The activities of the Netherlands’ National Committee on Large <strong>Dam</strong>s (NETHCOLD) .......................................................................51<br />
<strong>Dam</strong>s in the Western USA........................................................................................................................................................................................53<br />
Review of the 11th ISRM Congress, July 2007, Lisbon (Portugal)...............................................................................................................60<br />
Verification of two-dimensional numerical earthquake site effects on a dam site, Costa Rica........................................................62<br />
Excursie Hubertustunnel, Den Haag ....................................................................................................................................................................68<br />
Water at the desert fringe - The Marib dams and irrigation schemes in the Republic of Yemen....................................................69<br />
Excursie GeoCentrifuge (GeoDelft), Delft...........................................................................................................................................................75<br />
Book review: Carbonate Sediments and Rocks. A Manual for Earth Scientists and Engineers...............................................................77<br />
GeoGolf ..........................................................................................................................................................................................................................79<br />
Thesis abstracts ...........................................................................................................................................................................................................80<br />
Weblinks ........................................................................................................................................................................................................................84<br />
<strong>Dam</strong> <strong>edition</strong> | Double Issue 2007/2008 | 1
Ingeokring <strong>News</strong><strong>letter</strong><br />
Advertisers index<br />
Royal Boskalis Westminster nv...............................................................................................................................................................................15<br />
CRUX Engineering BV................................................................................................................................................................................................23<br />
Fugro Engineers B.V...................................................................................................................................................................................................39<br />
Arthe Civil & Structure bv.........................................................................................................................................................................................46<br />
GeoConsult ...................................................................................................................................................................................................................52<br />
Inpijn-Blokpoel ingenieursbureau........................................................................................................................................................................67<br />
Witteveen+Bos ............................................................................................................................................................................................................74<br />
Royal Haskoning ........................................................................................................................................................................................ back cover<br />
<strong>Dam</strong> <strong>edition</strong> | Double Issue 2007/2008 | 2
Ingeokring <strong>News</strong><strong>letter</strong><br />
From the Chairman<br />
Joost van der Schrier, Chairman Ingeokring<br />
Dear Ingeokring member,<br />
It is my pleasure to introduce to you the 2007/2008 double issue of the <strong>News</strong><strong>letter</strong>.<br />
Receiving a <strong>News</strong><strong>letter</strong> is a little bit like the changing of the seasons: you can feel it in the air, you know it comes, and suddenly<br />
it is there. Laying on your doormat or in your mailbox and challenging you to pick it up and read it. And I promise: you will not<br />
regret it.<br />
The editorial staff and authors succeeded in filling this issue with a selection of articles relating to a ‘hot, alive and astonishing’<br />
topic entitled ‘dams’. The design, construction and operation of dams touch the core of engineering geology. All dams, either<br />
huge or small, are founded on rock and/or soil, and almost always under challenging conditions considered from either a technical,<br />
geographical or geological point of view.<br />
Evidently, the integral knowledge of the properties of the geo-materials involved, being rock and/or soil, their (in-situ) mass<br />
behaviour and their genesis with all its facets, are required as well as is the ‘affiliation with the (structural) behaviour’ of the<br />
dam. All of this is anchored within engineering geology. But, the field of expertise which is engineering geology covers more<br />
than only this: it is a typical multidisciplinary science.<br />
In view of the above, I am very happy to note that the Ingeokring, the Dutch section of the IAEG (International Association for<br />
Engineering Geology and the environment), is a ‘vibrant and healthy’ society that includes members of different backgrounds<br />
and is active in different fields of expertise. As such, the Ingeokring proofs to be a powerful platform for interacting and sharining<br />
of expertise and knowledge in the fields of engineering geology and its overlapping or adjacent disciplines. So, if you are<br />
not a member yet, we kindly invite you to consider the membership and join us.<br />
I would like to thank all the <strong>News</strong><strong>letter</strong> authors, sponsors and editorial staff for making this issue of the <strong>News</strong><strong>letter</strong> possible and<br />
I trust you will enjoy reading it as much as I did.<br />
Hope to meet you soon at one of the coming Ingeokring activities.<br />
<strong>Dam</strong> <strong>edition</strong> | Double Issue 2007/2008 | 3
Ingeokring <strong>News</strong><strong>letter</strong><br />
Editorial<br />
Michiel Maurenbrecher, guest editor<br />
“Holland....lies so low its people are only saved by being damned!”<br />
Up the Rhine , Thomas Hood (1799-1845)<br />
This must be the first issue of the Ingeokring <strong>News</strong><strong>letter</strong> that deals with dams. Well, almost: I wrote an article on a presentation<br />
given by Charles Dufour on invitation of the Mijnbouwkundige Vereeniging on irrigation schemes in Yemen mentioning the<br />
old and new Marib <strong>Dam</strong>s (Water resources assessment in the Republic of Yemen, F.C. Dufour (reporter P.M. Maurenbrecher),<br />
Ingeokring Nieuwsbrief, lente-zomer editie, 1991, pp. 41-43). For this <strong>News</strong><strong>letter</strong> issue, Charles has written a more specific paper<br />
on the old and new dams. Perusing further through my complete collection of <strong>News</strong><strong>letter</strong>s dating from 1977, there seem<br />
to be two more articles on dams. One is about the Ribarroja <strong>Dam</strong>, written by ITC student Carlos Caranza Torres (Ribarroja <strong>Dam</strong><br />
excursion, C.M. Caranza Torres, Ingeokring Nieuwsbrief, herfst editie, 1993, pp. 19-22). The problems associated with this dam,<br />
situated close to the ITC and TU Delft engineering geology students’ common fieldwork area in Spain, can also be read in Peter<br />
Verhoef’s dam experience and case history in the Afar District, Ethiopia which makes riveting reading: damnation lurks for<br />
those dam engineers lacking knowledge of geological materials. The other article is about the Canelles <strong>Dam</strong> and can be found<br />
in the summer 2001 issue of this <strong>News</strong><strong>letter</strong> (Excursion to the Canalles <strong>Dam</strong>, R.M. Schmitz & S. Gyaltsen, Ingeokring <strong>News</strong><strong>letter</strong><br />
No. 9, summer 2001, pp. 13-16).<br />
Because there are insufficient steep valleys to flood in the Netherlands, it seemed for a time that engineers and engineering<br />
geologists are not much involved with dams except the type Thomas Hood refers to. The theme ‘dams’ came up when Dr.<br />
Mario Alvarez Grima sent a paper on piping in dams to the Ingeokring <strong>News</strong><strong>letter</strong>. That was the one theme not mentioned by<br />
the editors in their ‘invitation’ to me at my TU Delft farewell symposium of June 2006 to be guest editor of one of the <strong>News</strong><strong>letter</strong><br />
issues. Increasingly, dams seem to be damned, especially by environmentalists. Our new Ingeokring <strong>News</strong><strong>letter</strong> editor Erik<br />
Schoute, whilst working for Boskalis in the USA, went on two road trips in the Western USA and writes about the dams he visited.<br />
Two dams, Hoover <strong>Dam</strong> and Glen Canyon <strong>Dam</strong>, were also visited on the DIG Colorado study tour with Prof. Keith Turner in<br />
2000. I remember the engineer from the USBR complaining about the increasingly stronger lobby from the Sierra Club wanting<br />
to demolish these dams so as to give the Colorado river its old confluence back. <strong>Dam</strong>s are damned structures but possibly the<br />
necessary evil to save humanity from thirst, hunger, decease and wasteful use of fossil fuels. The Sierra Club is not alone: look<br />
at the advertisement by the WWF depicting the Hoover <strong>Dam</strong> as ‘Hoover <strong>Dam</strong>ned’ gravestone in their recent advertisements.<br />
Despite this negative publicity, dams are ‘Megastructures’ as Discovery Channel viewers know by now. There are surprisingly<br />
plenty of Dutch engineers and engineering geologists who have been and are involved with dams, of which one is featured on<br />
Discovery Channel: ‘The Enclosure <strong>Dam</strong>’ in the Netherlands, still the longest in the world. Another equally grand dam crosses<br />
the Suriname River: the Afobaka <strong>Dam</strong>, a 54 m high and 2 km long rock fill dam with a concrete gravity spillway-sluice gate and<br />
power station complex. The dam was designed by W.J. van Blommestein, after which the huge reservoir behind the dam is<br />
named (size of Province of Utrecht). Trying to obtain technical information on its design through the TU Delft library yielded<br />
nothing, while Google searches painted a picture of the Afobaka dam as another ‘Thomas Hood damned’ dam: the reservoir<br />
being choked with water hyacinth, piranha fish and the power generated by the dam solely provided for the benefit of the<br />
aluminium industry (the main money earner) of Suriname.<br />
This <strong>News</strong><strong>letter</strong> has become fairly sizeable, its size could have been bigger as I discovered more and more Dutch engineers<br />
involved in this industry. There has been a visit of the new student chapter of Geo-Engineering to Madrid. During this visit,<br />
Gerard Arends (Ondergronds Bouwen) owned up he had been involved in a dam project during his internship. Very recently<br />
the section head of Geo-Engineering, Frits van Tol, also mentioned he did his student internship on a concrete arch dam (170<br />
m) north of Madrid. Enquiring about Van Blommestein through Emeritus Prof. Arnold Verruijt led me to another emeritus professor,<br />
Jan Kop. He has actually worked under Van Blommestein in Bangladesh and had also visited the Afobaka <strong>Dam</strong> in Suriname<br />
(assuring me that one can see the design features on posters/drawings hanging on the wall, presumably at the power<br />
station).<br />
<strong>Dam</strong> <strong>edition</strong> | Double Issue 2007/2008 | 4
Ingeokring <strong>News</strong><strong>letter</strong><br />
Yet what I found a disappointment at TU Delft was the lack of literature on dams. Not only had the search on Afobaka <strong>Dam</strong> led<br />
to nothing, years ago I had a similar search for a paper on Scotland’s Monar <strong>Dam</strong>, an arch dam on jointed rock foundation. This<br />
paper (Stability of the Foundations of Monar <strong>Dam</strong>, D.J. Henkel, J.L. Knill, D.G. Lloyd & A.W. Skempton, pp. 425-441, ICOLD Congress<br />
Proceedings, 1963) was published as part of the series of ICOLD congress proceedings. I found it hard to accept that TU<br />
Delft library did not have the ICOLD proceedings. Well, they do! It seems since the Netherlands became a member of ICOLD in<br />
1966, TU Delft only has the proceedings in the library from that year onwards. For my personal introduction to ICOLD, you<br />
have to read my short paper in this <strong>News</strong><strong>letter</strong> on efficiency of upstream membrane dams, a study I did when working in London<br />
in 1973. Eventually, a copy of the Monar <strong>Dam</strong> article came from Haskoning in Nijmegen, from ir. J. van Duivendijk, who is<br />
closely associated with both TU Delft and Haskoning and writes about the role of the Netherlands in ICOLD (NETHCOLD).<br />
Monar <strong>Dam</strong> is interesting as it discusses foundations of a dam in connection with a jointed rock mass. The paper contains a<br />
stereographic plot of the poles of the discontinuities, but further analysis on the stability appears to be based on twodimensional<br />
models. Searching for literature on the use of stereographic methods in foundations led me to the Malpasset <strong>Dam</strong><br />
failure analyses. Back in the 1960’s the stability was analysed using stereographic plots preceded by analyses using 3D Cartesian<br />
coordinates. At the discovery of what I now call the ‘Londe papers’ I challenged students to tell me how the analysis was<br />
done, with little result. I will not state how long it took to decipher the papers. Some students (old students) will know. This<br />
<strong>News</strong><strong>letter</strong>’s theme was, I admit, especially in my newly retirement status an inducement (in Dutch: ‘een stok achter de deur’)<br />
to present the analysis from Londe who claims, quite rightly, Malpasset <strong>Dam</strong> was the start of modern rock mechanics.<br />
At the 11th ISRM Congress in Lisbon, a paper on earthquakes and dams, which is reproduced in this issue, was presented by<br />
Carolina Sigarán-Loria and Robert Hack. Robrecht Schmitz reports briefly on the conference as does Leon van Paassen on a<br />
conference a year earlier, of the IAEG in Nottingham. One paper that will be published in the next <strong>News</strong><strong>letter</strong> issue is about<br />
dams in Bhutan, to be written by Niek Rengers and Wim Verwaal. There is though a very interesting case history on a frozen<br />
moraine dam in the Himalayas by Senta Modder, who studied geology at the VU University Amsterdam and engineering geology<br />
at TU Delft. The Bhutan case histories would compliment Senta’s paper. Niek visited a natural dam caused by a landslide<br />
and Willem did investigations for man made dams.<br />
Once into dams one is hooked into these structures. If you travel up the Maas instead of the Rhine and then follow a tributary<br />
called la Gileppe to the watershed between the Maas and Rhine catchments in the Ardennes you come to the highest dam in<br />
the world, named after the tributary. Highest dam? In Belgium? Well, it was so in the 19th century when it was built (40 m) and<br />
heightened to 66 m more recently. Today dams almost ten times higher are on the planning boards, and dams of over 300 m<br />
(Nurek, Russia) already exist. ‘Werk aan de winkel’ for engineering geologists.<br />
My thanks to the editorial team, Gerhard Wibbens, Wiebke Tegtmeier, Erik Schoute, Paulien Kouwenberg and Jacco Haasnoot,<br />
for showing all that patience and my apologies to the members of Ingeokring for the delayed publication. The meetings were<br />
great and I got to know a few restaurants in Delft and Rotterdam. The layout and content increases in quality with each issue. A<br />
suggestion for the next issue is to celebrate 30 years of <strong>News</strong><strong>letter</strong>s!<br />
<strong>Dam</strong> <strong>edition</strong> | Double Issue 2007/2008 | 5
Ingeokring <strong>News</strong><strong>letter</strong><br />
Ingeokring Jaarverslag 2006<br />
Marcel Remijn, secretaris Ingeokring<br />
Missie van de Ingeokring<br />
De Ingeokring is onderdeel van het KNGMG en bestaat uit<br />
leden die zich professioneel en vanuit interesse bezig houden<br />
met het vakgebied Ingenieursgeologie. De Ingeokring<br />
fungeert tevens als Nederlandse afdeling van de International<br />
Association for Engineering Geology and the environment<br />
(IAEG).<br />
De Ingeokring heeft een bestuur wat naast de gewone bestuursleden<br />
bestaat uit een bestuurslid van het Dispuut Ingenieurs<br />
Geologie (DIG) van de Technische Universiteit Delft<br />
en een Nederlands lid van de International Society for Rock<br />
Mechanics (ISRM). Het bestuur organiseert lezingen, excursies<br />
en vergaderingen ten einde elkaar te informeren over<br />
vaktechnische en relevante nationale en internationale ontwikkelingen<br />
binnen het vakgebied van de Ingenieursgeologie.<br />
Tevens zet de Ingeokring zich in om ontwikkelingen van<br />
Ingenieursgeologie in Nederland te stimuleren op het gebied<br />
van onderwijs, onderzoek en samenwerking tussen<br />
verschillende instituten, universiteiten en bedrijven.<br />
Tot de Ingeokring kunnen toetreden:<br />
• Leden en buitengewoon leden van het KNGMG en alle<br />
leden van de met het KNGMG samenwerkende<br />
verenigingen<br />
• Personen met interesse in Ingenieursgeologie<br />
Bestuur en leden<br />
Op 1 januari 2006 had de Ingeokring 176 leden en op 31<br />
december 2006 171 leden. De aanmeldingen en opzeggingen<br />
over 2006 zijn in evenwicht, de daling komt vooral door<br />
het opschonen van het ledenbestand.<br />
De samenstelling van het bestuur bij aanvang van 2006 was:<br />
Chris Bremmer voorzitter<br />
In oktober 2006 heeft Elles Bader de taken van Roeland van<br />
Hof overgenomen als vertegenwoordiger van het DIG. Met<br />
ingang van het studiejaar 2006-2007 is het DIG opgegaan in<br />
studievereniging ‘De Ondergrondse’ waarin studenten van<br />
diverse gelieerde richtingen verenigd zijn. Een vertegenwoordiger<br />
van ‘De Ondergrondse’ zal deel uit blijven maken<br />
van het Ingeokring bestuur.<br />
Jaarvergadering<br />
De jaarvergadering van de Ingeokring werd gehouden op<br />
26 april 2006 bij de TU Delft. Tijdens de jaarvergadering<br />
werden de secretariële stukken door de leden goedgekeurd.<br />
De financiële stukken werden op 22 augustus aan de leden<br />
gepresenteerd en goedgekeurd. Tevens is de ‘Afstudeerprijs<br />
2004/2005’ aan Bart van Knapen uitgereikt voor zijn scriptie<br />
getiteld: ‘A method to automate the identification and characterisation<br />
of rock mass discontinuity sets using 3D terrestrial<br />
laser scanning data’.<br />
Activiteiten<br />
De Ingeokring heeft in 2006 verscheidene excursies en lezingen<br />
georganiseerd waarbij de opkomst gevarieerd was:<br />
26-04-2006: Jaarvergadering 2005 en uitreiking<br />
‘Afstudeerprijs 2004/2005’<br />
16-06-2006: Symposium ter ere van het afscheid van<br />
Michiel Maurenbrecher<br />
22-08-2006: Presentatie financieel jaarverslag<br />
voorafgegaan door een lezing van L. van<br />
Paassen en P. Verhoef over ‘Cementation’<br />
15-09-2006: Bezoek aan MTI met lezing en rondleiding<br />
over de werf van IHC Kinderdijk<br />
19-10-2006: Lezing over ‘Remote Sensing’ bij TNO<br />
Utrecht<br />
Marcel Remijn<br />
Leon van Paassen<br />
Peter Verhoef<br />
Marco Huisman<br />
Jacco Haasnoot<br />
Roeland van Hof<br />
secretaris<br />
penningmeester<br />
bestuurslid<br />
vertegenwoordiger ISRM<br />
voorzitter <strong>News</strong><strong>letter</strong> redactie<br />
vertegenwoordiger DIG<br />
14-12-2006: Kerstborrel gecombineerd met een lezing<br />
door Salle Kroonenberg in ‘Het Noorden’<br />
<strong>News</strong><strong>letter</strong><br />
In 2006 kwam de <strong>News</strong><strong>letter</strong> eenmaal uit. Het thema was<br />
‘Bodemdaling’. De <strong>News</strong><strong>letter</strong> verscheen in december 2006,<br />
maar werd pas in maart 2007 verstuurd door problemen bij<br />
de drukker.<br />
<strong>Dam</strong> <strong>edition</strong> | Double Issue 2007/2008 | 6
Ingeokring <strong>News</strong><strong>letter</strong><br />
Ingenieursgeologie opleidingen<br />
De master opleiding Ingenieursgeologie aan de TU Delft is<br />
samengevoegd met een aantal andere master opleidingen<br />
en maakt nu deel uit van de sectie Geo-Engineering. Mede<br />
door deze samenwerking is ook het DIG gaan samenwerken<br />
met andere disputen en is opgegaan in de studievereniging<br />
‘De Ondergrondse’. De samenwerking met ITC is beëindigd.<br />
Twee nieuwe universitair docenten zijn aangetrokken, Joep<br />
Storms en Bob Hoogendoorn, beide gepromoveerd bij Applied<br />
Earth Sciences.<br />
Bij ITC is eenzelfde tendens ingezet: de opleiding Engineering<br />
Geology is hernoemd in Geo-Engineering en naast Geohazards,<br />
Earth Resources Exploration en Earth Science Data<br />
Provision , een van de 4 specialisaties binnen de master Applied<br />
Earth Sciences (AES). De master AES heeft 30 studenten,<br />
waarvan 7 de specialisatie Geo-Engineering volgen.<br />
Daarnaast werkt ITC aan samenwerkingsverbanden met<br />
Universiteit Twente.<br />
Website Ingeokring<br />
De internetsite www.ingeokring.nl is in 2006 regelmatig<br />
voorzien van aankondigingen van de Ingeokring en internationale<br />
activiteiten. Tevens zijn de laatste <strong>News</strong><strong>letter</strong>s er<br />
digitaal te downloaden. De website wordt op dit moment<br />
beheerd door Leon van Paassen.<br />
Afsluiting<br />
De Ingeokring hoopt dat U door dit jaarverslag een goed<br />
beeld heeft gekregen van de door de Ingeokring georganiseerde<br />
activiteiten in 2006.<br />
Voor vragen of opmerkingen kunt U contact opnemen met<br />
de secretaris van de Ingeokring.<br />
<strong>Dam</strong> <strong>edition</strong> | Double Issue 2007/2008 | 7
Ingeokring <strong>News</strong><strong>letter</strong><br />
Analysing the analysis of the Malpasset arch dam failure of 1959<br />
Michiel Maurenbrecher, Delft University of Technology, Section Geo-Engineering<br />
Introduction<br />
At dusk on December 2 1959, engineers decided after heavy<br />
rains and an impending overflow of the reservoir to open<br />
the bottom valve outlet of the Malpasset concrete arch dam.<br />
Sixty metres of water pressure were then unleashed to try<br />
and lower the water levels in the reservoir. Three hours later<br />
the dam failed when the foundation of gneissic-schistose<br />
rock beneath the left abutment slid along a wedge. The<br />
reservoir water rushed towards the sea as almost sixty metres<br />
of flood water gushed through the completely obliterated<br />
left abutment portion of the dam. For eleven kilometres<br />
the water tore up farms, river banks and infrastructure<br />
as it headed towards the estuary of the Reyran River at<br />
Fréjus into the Mediterranean. 423 people died as a result of<br />
this disaster as well as flooding and destroying property and<br />
infrastructure along the path of the unleashed torrent.<br />
The design engineer, André Coyne of the well-established<br />
engineering partnership of Coyne et Bellier based in Paris,<br />
was nearing the end of his professional career and had over<br />
one hundred successful dams constructed. Despite the calamity<br />
and the first arch dam ever to fail, his immediate reaction<br />
was to try and establish the cause of the failure (Bellier,<br />
1977).<br />
By 1969, ten years later, publications on the method of<br />
analysis Coyne and Bellier had established started to appear<br />
in the international journals, starting with two papers in the<br />
Journal of Soil Mechanics and Foundation Engineering of the<br />
ASCE (American Society of Civil Engineers). These were by<br />
Pierre Londe, Gaston Vigier and Raymond Vormeringer<br />
(1969 and 1970). Subsequently, Pierre Londe published a<br />
number of papers in the Quarterly Journal of Engineering<br />
Geology (1973) and in Engineering Geology (1987). Both these<br />
publications were milestones: The QJEG providing an introduction<br />
to rock mechanics as is still practiced today, notably<br />
the paper in that issue on slope wedge analysis by Hoek,<br />
Bray and Boyd. The Elsevier Engineering Geology publication<br />
was based on a meeting held to discuss dam failures.<br />
The milestone QJEG publication re-appeared as part of Hoek<br />
and Bray’s Rock Slope Engineering almost the same year and<br />
re-appeared recently in a new 4th <strong>edition</strong> version by Wyllie<br />
& Mah (2004). The work by Londe, however, seems to have<br />
been put on the sidelines despite his international reputation,<br />
especially in the International Society of Rock Mechanics.<br />
The Malpasset dam failure could be recognised as the<br />
starting point of the discipline of rock mechanics in Civil<br />
Engineering (Londe, 1973). Londe analysed the dam failure<br />
in three dimensions using simple mechanics on a threedimensional<br />
wedge that was believed to exist beneath the<br />
left abutment (note: convention in dams is to always look<br />
downstream in describing which half of the dam one is dealing<br />
with). The method is not dissimilar to the ‘Block Theory’<br />
developed by Richard Goodman and Gen-Hua Shi (1985).<br />
Despite referring to Londe and Malpasset in their books (see<br />
also Goodman (1989)) they make no attempt at explaining<br />
the work done by Londe, Vigier and Vormeringer. Goodman<br />
and Shi offer one tantalizing clue, though, that their block<br />
theory should be used as the initial step in the process of<br />
analysing stability before continuing with the method of<br />
Londe, Vigier and Vormeringer: “It is beyond our present purpose<br />
to describe the solution of these parameters (shown in<br />
the plot) that determine the degree of safety of the wedge. We<br />
wish to point out, however, that such an analysis can only be<br />
run after a particular tetrahedral block has been singled out.<br />
Block theory is not a substitute for the limiting equilibrium<br />
analysis but, rather, a necessary prerequisite since it will allow<br />
you to determine which block to analyze”. Hence the purpose<br />
of this paper is to describe the solution.<br />
Starting, then, with Block Theory<br />
Block theory requires plotting stereographic equal angle<br />
projection circles of the wedge planes beneath the dam and<br />
the plane of the slope (excavation pyramid). Note: many<br />
terms exist for ‘wedge’ such as ‘tetrahedral block’ as mentioned<br />
above or, used subsequently in Goodman & Shi<br />
(1985) to explain their block theory: ‘joint pyramid’. With<br />
three planes there are a possible eight wedges and in combination<br />
with an open slope face a ‘removable’ wedge can<br />
be defined. Removability means the wedge can move from<br />
the rock mass by sliding on one plane, two planes or no<br />
planes, the latter situation either by ‘popping’ or falling out.<br />
The wedge, though, will only move if the resultant force on<br />
the wedge acts outside a boundary or envelope defined by<br />
the geometry of the wedge and slope (region known as a<br />
‘space pyramid’) and the angle of shear resistance of the<br />
wedge discontinuities. Londe did not carry out this first step<br />
as the field evidence after the failure defined the wedge<br />
surfaces and the wedge configuration from which the<br />
wedge slid or lifted. First though the geometry of the wedge<br />
<strong>Dam</strong> <strong>edition</strong> | Double Issue 2007/2008 | 8
Ingeokring <strong>News</strong><strong>letter</strong><br />
has to be obtained. Surprisingly, one has to resort to a number<br />
of techniques to discover what parameters were used to<br />
analyse the stability of the dam! The following parameters<br />
were determined (after substantial ‘forensic research’ of the<br />
suite of ‘Londe papers’):<br />
Plane 1: upstream face of wedge ‘P1’, dip 45°, dip direction<br />
270°<br />
Plane 2: downstream face of wedge ‘P2’, dip 40°, dip direction<br />
013°<br />
P3<br />
P1<br />
P2<br />
Plane 3: toe face of wedge ‘P3’, dip 0°, dip direction horizontal<br />
The wedge in relation to the dam is shown on contour maps<br />
before and after failure in Figures 1 and 2. P1 and P2 are<br />
faults. P3 was an induced ‘crack’ (Londe, 1973).<br />
20 m<br />
N<br />
20m<br />
P 3<br />
P1<br />
45<br />
45<br />
P 3 Q<br />
P1<br />
P 2<br />
140<br />
60<br />
80 100<br />
120<br />
Fig. 1 Contour map prior to failure showing the plan of the dam and<br />
the underlying wedge causing failure. Contour map based on Londe<br />
(1987), wedge based on Londe, Vigier and Vormeringer (1970).<br />
For the Block Theory to establish removability, a slope (EP) is<br />
introduced based on the contour map in Figure 1, this is dip<br />
33° with orientation 280°.<br />
In Figure 3 the great circles are plotted of planes 1, 2 and 3<br />
and the slope. These are plotted on an equal angle projection,<br />
in this instance using both the ‘upper focal point’ and<br />
the ‘lower focal point’. In the upper focal point projection<br />
the space within the reference circle (which coincides with<br />
the P3 great circle) is the ‘lower hemisphere’ and the ‘outer<br />
hemisphere’ is the space outside the reference circle. The<br />
three planes result in eight spherical triangles representing<br />
eight possible wedges or ‘Joint Pyramids’. Using Shi’s theo-<br />
P2<br />
140<br />
60<br />
80 100 120<br />
20m<br />
100<br />
80<br />
60<br />
60<br />
80<br />
100<br />
Fig. 2 Photograph and contour map of Malpasset <strong>Dam</strong> site after failure<br />
showing tie-in between wedge contours and ground contours; shaded<br />
portion is wedge. Wedge contours below survey contours (ground<br />
surface) indicating P3 either at a higher elevation or probably P3 consists<br />
of two or more planes (photo source: en.structurae.de/photos/<br />
index.cfm?JS=7596; photo used with permission of photographer Alain<br />
de la Forest (alaindelaforest@yahoo.fr)).<br />
rem (Goodman, 1989) the only wedge that does not intercept<br />
the slope great circle is JP 000. This is the wedge which<br />
is potentially removable and represents the wedge which<br />
was used to solve the stability of the dam foundations.<br />
There are two further wedges which are potentially removable<br />
should the orientation of the slope change and these<br />
are shown in Figure 3: JP 001 if the slope dips to 295° and JP<br />
010 for a slope facing towards 265°. JP 000 means that the<br />
wedge planes are ‘upper half spaces’ of the discontinuities<br />
forming the planes. JP 001 means planes 1 and 2 are still<br />
‘upper half spaces’ and plane 3 is a ‘lower half space’. In this<br />
instance plane 3 would be at higher elevation leaving an<br />
overhanging roof, the ‘upper half space’ in the rock mass. In<br />
the case of JP 010 planes 1 and 3 form ‘upper half spaces’<br />
and 2 a ‘lower half space’. All three cases should be analysed<br />
though JP 010 is unlikely as the forces exerted on this wedge<br />
would probably ensure it remains in place.<br />
The wedge would be stable if the resultant force on the<br />
<strong>Dam</strong> <strong>edition</strong> | Double Issue 2007/2008 | 9
Ingeokring <strong>News</strong><strong>letter</strong><br />
30<br />
Equal-Angle Plot upper focal point<br />
000<br />
15<br />
0<br />
15<br />
001<br />
30<br />
60<br />
30 15<br />
0<br />
1530 60<br />
90<br />
60<br />
30<br />
15<br />
0<br />
15 30 45<br />
60<br />
111<br />
30<br />
15<br />
0<br />
15<br />
010<br />
30<br />
000<br />
P1 45 270<br />
Shaded area JP000<br />
P2 40 013<br />
Removable, also<br />
45<br />
P3 0 0-360°<br />
001 at 295° and<br />
45<br />
slope 33 280<br />
010 at 265°<br />
Equal-Angle Plot lower focal point<br />
30<br />
15<br />
101<br />
001<br />
0<br />
15<br />
30<br />
000<br />
60<br />
45 30<br />
15<br />
0 1530 60<br />
90<br />
60<br />
30<br />
15<br />
0 15 30 45<br />
60<br />
111<br />
010<br />
30<br />
15<br />
100<br />
0<br />
15<br />
Fig. 3 Plot of great circles P1, P2, P3 and slope on extended equal angle<br />
net confirming that the Londe wedge is removable. Inner circle is lower<br />
hemisphere and outer area upper hemisphere.<br />
wedge occurs within a zone defined by a spherical triangle<br />
with its intersection points at the poles of P1, P2 and P3.<br />
These are plotted in Figure 4 for the upper focal point projection<br />
(continuing from Figure 3).<br />
The plot is further extended by connecting pole 1 with the<br />
intersection points of planes 1 & 2 and with planes 1 & 3.<br />
This is done for pole 2 with 1 & 2 and 2 & 3 and pole 3 with 2<br />
& 3 and 3 & 2. The plots were all formed by generating the<br />
arcs using spherical trigonometry equations on a spreadsheet.<br />
Normally these are plotted by hand using an appropriate<br />
stereo net. The techniques used on a spreadsheet<br />
require a separate publication making use of spherical trigonometry<br />
and, in this instance, projection equations for an<br />
equal angle net (the x–scale and y-scale provide the projection<br />
equations to indicate the spacing in terms of α). The Londe<br />
plots were all done by hand, probably using tracing paper<br />
placed over an extended equal angle stereo net of which an<br />
example is given in Goodman (1989). The advantage of a<br />
spreadsheet is that different values can be inserted to test<br />
Equal-Angle Plot upper focal point<br />
0<br />
Z 123 15<br />
Z 23<br />
30<br />
Z 12 Z 23 2-3<br />
60<br />
Z 2<br />
p 3<br />
15 0<br />
15<br />
30 Z 1 60<br />
90<br />
60<br />
30<br />
15<br />
0 15 30 45<br />
Z 0 p 1 x = t an 45-α/2, Ω=90- 270<br />
60<br />
p 2 Z Z 3<br />
13 30<br />
15<br />
Z 23<br />
0<br />
Z 13 15<br />
1-2<br />
Z 123<br />
P 1 α =45° Ω =270°<br />
30<br />
P 2 α =40° Ω =013°<br />
y = tan 45-α/2 Ω=0-180°<br />
15<br />
3-1<br />
45<br />
P 3 α =0° Ω =0-360°<br />
(horizontal plane).<br />
slope α =33° Ω =260°<br />
Reference Circle<br />
Fig. 4 Continuation of Figure 3, using a spreadsheet connecting poles<br />
of P1, P2 and P3 (p1, p2 & p3) with intersection points of P1-P2, P2-P3<br />
and P3-P1 (1-2, 2-3 & 3-1) Londe rupture modes Z 0 through Z 123 shown.<br />
A force in a direction within zone Z 0 is considered as safe.<br />
the sensitivity of slope angle and direction, as well as difference<br />
in dip and dip direction for the discontinuity planes.<br />
Forces on a wedge: influence of friction<br />
Stereographic projections are three-dimensional representations<br />
of angles. Forces have a direction but also a magnitude.<br />
One simplification making allowances for ‘magnitude’<br />
in stereographic methods is to represent magnitude by use<br />
of the internal friction angle from the Mohr-Coulomb equation.<br />
Simply, this states that shear resistance is the product<br />
of the normal force acting on a surface times the tangent of<br />
the friction angle. Hence, if the direction of a force acting on<br />
a plane is known there could be a component parallel to the<br />
plane and a component normal to the plane ‘mobilising’ the<br />
frictional shear strength. Consider a force F acting at an angle<br />
δ from the perpendicular to a plane. By resolving this<br />
force into a component along the plane, F sinδ, and a component<br />
normal to the plane F cosδ, and substituting this into<br />
the Mohr-Coulomb equation the mobilised shear resistance<br />
is F cosδ tanφ. If F cosδ tanφ is greater than F sinδ no sliding<br />
will occur. This relationship simplifies to tanφ>tanδ, and<br />
even further to φ>δ, leaving only angles to deal with.<br />
The safe zone defined by the spherical triangle p1, p2 and<br />
p3 is expanded by plotting the ‘friction cones’ at p1, p2 and<br />
p3. If the force direction falls within the cone (δ
Ingeokring <strong>News</strong><strong>letter</strong><br />
15<br />
0<br />
15<br />
30<br />
60<br />
90°<br />
75°<br />
60°<br />
30° 45°<br />
15 0 15 30 60 60 30 15<br />
30<br />
p 3 p 1 90<br />
0<br />
15<br />
45<br />
60<br />
p 2<br />
30<br />
15<br />
0<br />
15<br />
30<br />
45<br />
Fig. 5 Friction ‘cones’ added to show increased safe zone. Values correspond<br />
to Londe (1973) and are 25°, 15° and 30° for shaded zone. Friction<br />
angle iso-lines plotted for 30° through 90°.<br />
each other at the end between the poles as the force<br />
changes direction it acts less on one plane and may start to<br />
act on two. Londe et al. (1969) and Londe (1973) describe<br />
the various types of sliding on one plane, on two planes<br />
along the line of intersection and possible dislodgement<br />
without sliding (or if in the opposite direction, where the<br />
wedge would be pushed into the rock mass, compression<br />
only). This results in seven modes of movement. Much of<br />
these two papers are devoted to this aspect. Goodman<br />
(1989) projection lines show where these zones can be<br />
found as well, but he has not defined them as such. The<br />
essential is if the resultant force falls in a zone that can cause<br />
movement or remain stable: a ‘safe zone’ and an ‘unsafe<br />
zone’. The Goodman approach and that of Londe are as<br />
good as identical. Goodman does have a preference for using<br />
the ‘lower focal point’ whereas Londe has used the<br />
‘upper focal point’, hence in Figure 3 both projections are<br />
given. In Figure 4 the ‘upper focal point’ is used so that direct<br />
comparison can be made with the original Londe publications.<br />
Further friction angle isolines have been added as was done<br />
by Londe showing that the stable zone increases substantially<br />
with increase in friction up to the great circle of planes<br />
1, 2 and 3 for φ=90°.<br />
Plotting forces<br />
Two types of forces are dealt with: the forces exerted by the<br />
dam on the foundation (including the dead weight of the<br />
wedge) and water pressure (seepage) forces acting perpendicular<br />
to the wedge planes. The forces from the dam are<br />
the weight of the dam and the hydraulic forces of the reservoir<br />
acting on the dam. The magnitude and direction of<br />
these forces are provided in the 1970 paper but do not specifically<br />
refer to the Malpasset <strong>Dam</strong>.<br />
The total weight, including the weight of the portion of the<br />
dam resting on the rock volume, is W=111 000 ton. The<br />
thrust of the dam is horizontal: Q=84 000 ton. The water<br />
forces corresponding to full hydrostatic head are:<br />
(1) U 1T =85 000 ton; (2) U 2T =62 000 tons; and (3) U 3T =25 500<br />
ton.<br />
The above paragraph is taken verbatim from the paper. Q is<br />
shown in a direction 150° using the wedge diagram<br />
(replotted in Figure 1). The ‘dip’ of the resultant W with Q<br />
would be: tan -1 (111 000/84 000)=53°.<br />
When this is plotted in Figure 5 (150°/53°), the resultant is in<br />
the ‘safe zone’. If the friction is reduced to zero, sliding of the<br />
wedge would occur on plane 3 only (zone Z 3 ). As with the<br />
orientation of the planes, the Londe papers do not provide<br />
these values; the vector does correspond well with the projections<br />
(1970 and 1973 papers).<br />
The final step is to examine the influence of U 1T , U 2T and U 3T<br />
on the direction of F vector (point f ). At this stage the final<br />
scenario of the analysis has been reached and to give Londe<br />
and his co-authors credit, the approach then and even today<br />
30 years later has remained unique. A paper by Karaca &<br />
Goodman (1993) does indicate a similar approach showing<br />
the rotation of f under influence of the build-up of water<br />
pressures. Though they do not refer to any of the Londe<br />
papers, they could possibly have unwittingly presented the<br />
cause of the Malpasset <strong>Dam</strong> failure in their paper! A hint to<br />
this is given in the opening sentence of this paper.<br />
Plotting water forces<br />
To understand the Londe approach, the first paper (1969)<br />
presents a figure (reproduced here in Figure 6 for the water<br />
pressure force vectors on planes P1, P2 and P3). The amount<br />
of rotation of the force F when combined with forces U 1T , U 2T<br />
and U 3T individually is calculated for different percentages of<br />
U 1T , U 2T and U 3T . The resulting zone constructed on the stereograph<br />
will show that not the full percentage of the water<br />
force is necessary to cause the resultant to occur in the<br />
<strong>Dam</strong> <strong>edition</strong> | Double Issue 2007/2008 | 11
Ingeokring <strong>News</strong><strong>letter</strong><br />
60<br />
Vectors F with U1T<br />
36.2<br />
40<br />
26.4<br />
17.9<br />
20<br />
10.7<br />
4.9<br />
0<br />
-60 -40 -20 0 20 40 60 80 100 120 140<br />
-20<br />
Force ton x 1000<br />
vector F and U 1T<br />
-40<br />
protractor<br />
vectors R<br />
-60<br />
60<br />
Vectors F with U2T<br />
40<br />
18.5<br />
20<br />
13.3<br />
9<br />
5.5<br />
2.5<br />
0<br />
-60 -40 -20 0 20 40 60 80 100 120 140<br />
Force ton x 1000<br />
-20<br />
vector F and U 2T<br />
-40<br />
protractor<br />
vectors R<br />
-60<br />
60<br />
Vectors F with U3T<br />
40<br />
22.6<br />
16.6<br />
20<br />
11.5<br />
7.1<br />
3.3<br />
0<br />
-60 -40 -20 0 20 40 60 80 100 120 140<br />
Force ton x 1000<br />
-20<br />
vector F and U 3T<br />
-40<br />
protractor<br />
vectors R<br />
-60<br />
Force ton x 1000<br />
Force ton x 1000<br />
Force ton x 1000<br />
Fig. 6 Influence of water pressure forces on wedge planes P1, P2 and P3<br />
with force F from the dam’s weight, weight of the foundation wedge<br />
and the hydraulic force of the reservoir. Not surprisingly, plane P1 has<br />
the most influence on rotation of the resultant force R (note that rotations<br />
are from F in common great circle planes F & U 1T , F & U 2T and F &<br />
U 3T . The rotation angles are given in degrees (r values) at the ends of the<br />
R vectors.<br />
pressures. The total vector positions (100% build-up) are<br />
combined by rotating f-u 1T in a direction u 2 to produce f-u 12T<br />
and then rotating f-u 12T in a direction u 3 to produce the point<br />
position f-u 123T . In this way a zone is created, appropriately<br />
shaded indicating the range of positions where a resultant F<br />
with U(R) would cause the wedge to be unsafe and show<br />
which mode of movement would occur.<br />
p3U<br />
U1:T<br />
u13T<br />
p2L<br />
p3L<br />
u1:80%<br />
f<br />
p2L<br />
u3T<br />
u1:20%<br />
u1:40%<br />
u1:60%<br />
U1:T=u1:100%<br />
u2T<br />
p2U<br />
p3L<br />
p1L<br />
u23T<br />
p1L<br />
‘unsafe’ zone. These values are plotted in Figure 7 and plotted<br />
along the great circles common to f and the poles p 1U ,<br />
p 2U and p 3U . These poles are located on the upper hemisphere<br />
of the stereograph (the outer portion) as they represent<br />
the directions of the water forces u 1 , u 2 and u 3<br />
(perpendicular to the planes P1, P2 and P3 in an upward<br />
direction as if to lift the underside of the wedge or, strictly,<br />
acting on the upper half spaces of the wedge discontinuities).<br />
The water pressures do not, of course, build up individually<br />
on the wedge planes but build up gradually on one plane<br />
and possibly more rapidly on another depending on their<br />
permeability and drainage paths. In Figure 8, graphical<br />
methods were used to complete the unsafe zone for water<br />
To p 3U at<br />
8<br />
Fig. 7 Plotting influence of water pressures. First stage: f to u 1T , f to u 2T<br />
and f to u 3T towards poles p 1u , p 2u and p 3u (upper hemisphere, the directions<br />
of the water forces on P1, P2 and P3 respectively). Great circles are<br />
shown. The ‘distances’ f to u 1T , f to u 2T and f to u 3T are equal to the angles<br />
determined in Figure 6. Intermediate values of 20%, 40%, 60% and 80%<br />
are shown. Second stage is plotted for f & u 1T with u 3T (point u 13T ) and f &<br />
u 2T with u 3T (point u 23T ) showing graduations again for intermediate<br />
pressures 20 through 80%. Completion of second stage and final third<br />
stage to point u 123T is shown in Figure 8, this time solely by graphical<br />
techniques of intersecting great circles.<br />
<strong>Dam</strong> <strong>edition</strong> | Double Issue 2007/2008 | 12
Ingeokring <strong>News</strong><strong>letter</strong><br />
Z12<br />
Z2<br />
15°<br />
30°<br />
45°<br />
60°<br />
Z1<br />
f<br />
u 1T<br />
u 2T<br />
u 31T<br />
u 23T<br />
u 12T<br />
u 3T Z3<br />
u 123T<br />
75°<br />
Z23<br />
Z31<br />
Fig. 8 Completion of plot to define safe (light blue) and danger zone (light yellow) for water pressures superimposed on friction iso-lines kinematics of<br />
possible movement.<br />
Last word on the cause of the Malpasset <strong>Dam</strong> failure?<br />
This article hopefully explains the analysis and model used<br />
to examine the cause of failure of the Malpasset <strong>Dam</strong>. It not<br />
only condenses the original suite of papers by Londe but<br />
compiles pertinent aspects of the Londe suite essential to<br />
the analysis. The analysis is, however, not ‘the last word’ with<br />
regard to exploring the cause of failure. Londe et al. (1970)<br />
also looked at moment stability of the wedge as the forces<br />
developed on the wedge do not pass through a common<br />
point. This analysis showed that the wedge was not safe.<br />
Further analysis was carried out by Wittke & Leonards (1987)<br />
using finite elements resulting in another explanation as to<br />
the cause of failure though broadly it is still the discontinuities<br />
and water pressure build up that caused failure. What<br />
none of these analyses considered was what could have<br />
been the influence of the water spout under 60 m of water<br />
head when the bottom valve outlet was opened that fateful<br />
evening 48 years ago. Dubbed for the time being as the<br />
‘Karaca-Goodman effect’ is the rise in discontinuity water<br />
pressures as a result of an impinging water jet. It is not the<br />
momentum of the water splashing against rock blocks<br />
which causes them to dislodge but the rise in discontinuity<br />
water pressures the water splashing induces. Could this be the<br />
trigger that initiated instability of the left abutment wedge<br />
at 9 pm that night of December 2, 1959?<br />
References<br />
Bellier, J. (1977). The Malpasset <strong>Dam</strong>. Proceedings Engineering<br />
Foundation Conference ‘Evaluation of <strong>Dam</strong> Safety’, ASCE,<br />
New York, pp. 72-136 (originally published in French in<br />
TRAVAUX, Paris, July 1966).<br />
Goodman, R.E. (1989). Introduction to Rock Mechanics (2nd<br />
<strong>edition</strong>). John Wiley & Sons, Inc., New York.<br />
Goodman, R.E. & G.H. Shi (1985). Block Theory and Its Application<br />
to Rock Engineering. Prentice-Hall, Englewood Cliffs (NJ).<br />
Goodman, R.E. & C. Powell (2003). Investigations of Blocks in<br />
Foundations and Abutments of Concrete <strong>Dam</strong>s. J. Geotech.<br />
and Geoenvir. Engrg., 129, No. 2, pp. 105-116.<br />
<strong>Dam</strong> <strong>edition</strong> | Double Issue 2007/2008 | 13
Ingeokring <strong>News</strong><strong>letter</strong><br />
Hoek, E. & J.W. Bray (1981). Rock Slope Engineering (3rd <strong>edition</strong>).<br />
Institution of Mining and Metallurgy, London.<br />
John, K.W. (1968). Graphical Stability Analysis of Slopes in<br />
Jointed Rock. Proceedings ASCE, J. Soil Mech. & Found. Div.,<br />
94, No. 2, pp. 497-526.<br />
Karaca, M. & R.E. Goodman (1993). The influence of water on<br />
the behaviour of a key block. Int. J. Rock Mech. Min. Sci. Geomech.<br />
Abstr., 30, No. 7, pp. 1 575-1 578.<br />
Londe, P. (1965). Une méthode d’analyse à trios dimensions<br />
de la stabilité d’une rive rocheuse. Annales des pont et chaussées,<br />
1, p. 37.<br />
Londe, P. (1973). Analysis of stability of rock slopes. Quart. J.<br />
Eng. Geol., 6, No. 1, pp. 93-127.<br />
Londe, P. (1987). The Malpasset <strong>Dam</strong> failure. Engng. Geol., 24,<br />
pp. 295-329.<br />
Londe, P., G. Vigier & R. Vormeringer (1970). Stability of rock<br />
slopes, graphical methods. Proceedings ASCE, J. Soil Mech. &<br />
Found. Div., 96, No. 4, pp. 1 411-1 433.<br />
Londe, P., & B. Tardieu (1977). Practical rock foundation design<br />
for dams. Proceedings 16th U.S. Symposium on Rock Mechanics,<br />
ASCE, New York,. pp. 115-138.<br />
Wittke, W. & G.A. Leonards (1987). Retrospective Comments:<br />
Modified Hypothesis for Failure of The Malpasset <strong>Dam</strong>.<br />
Engng. Geol., 24, pp. 367-394.<br />
Wittke, W. & G.A. Leonards (1987). Retrospective Comments:<br />
Modified Hypothesis for Failure of The Malpasset <strong>Dam</strong>.<br />
Engng. Geol., 24, pp. 407-421.<br />
Wyllie, D.C. & C.W. Mah (2004). Rock Slope Engineering (4th<br />
<strong>edition</strong>). Spon Press, Abingdon, Oxfordshire.<br />
Londe, P., G. Vigier & R. Vormeringer (1969). Stability of rock<br />
slopes, a three dimensional study. Proceedings ASCE, J. Soil<br />
Mech. & Found. Div., 95, No. 1, pp. 235-261.<br />
<strong>Dam</strong> <strong>edition</strong> | Double Issue 2007/2008 | 14
Ingeokring <strong>News</strong><strong>letter</strong><br />
<strong>Dam</strong> <strong>edition</strong> | Double Issue 2007/2008 | 15
Ingeokring <strong>News</strong><strong>letter</strong><br />
Professor’s Column: Ode to ground<br />
Prof.dr.ir. Frans B.J. Barends, GeoDelft/TUDelft<br />
When speaking about water in the Netherlands, everyone is<br />
informed: the eternal battle against the sea, controlling<br />
large rivers under intensifying rain showers, sea level rise, as<br />
well as the importance of water for drinking quality, transport<br />
and recreation.<br />
When speaking about air, there are similar appealing subjects:<br />
sailing and surfing, Schiphol airport, daily weather<br />
forecasts, fine dust and wind energy.<br />
However, when speaking about ground the topics are less<br />
vivid: landscape, agriculture and spatial planning. Water we<br />
drink, air we breath, and from soil you become dirty. The<br />
unrealised fact is that almost all our comfort is based upon<br />
ground that we possess: water and air come from elsewhere.<br />
With ground, we control the sea and rivers by making dams,<br />
dikes and dunes. With massive earthen dams we control<br />
nature, influence the hydrological cycle and create energy.<br />
On ground we have built impressive infrastructures: cities,<br />
roads, railways, tunnels, bridges, pipelines, and we keep on<br />
doing so at an increasing scale. We are experts in engineering<br />
with ground. Let’s expand on the significance of ground<br />
for our existence, with focus on the Netherlands.<br />
Ground is protection. For at least ten centuries, the Dutch<br />
have built dikes and polders to withstand surging seas and<br />
rivers. Originally, by hand, all groups of society contributed<br />
as shown by names like Thief’s-dike and Children’s-dike,<br />
later by wind energy produced by thousands of windmills<br />
and thereafter steam and electricity took over, coping with<br />
an ever-increasing scale of lowland development. The social<br />
organisation by water boards, at a level of municipal authority,<br />
is unique in the world and paved the way towards an<br />
excellent management system for optimum safeguarding<br />
against flooding. However, reclaimed lands (particularly<br />
marshlands) shrink and compact. As a result, ground is subsiding.<br />
Along the coast at a maximum rate of 10 cm per century,<br />
in polders at an average rate of 25 cm per century, and<br />
in some peaty areas even at 150 cm per century, and more. It<br />
invokes a permanent concern, but at this rate the safeguarding<br />
against floods is technically manageable, even with the<br />
expected sea level rise . Since 1996 all protection works are<br />
controlled by law each five years and in general the result is<br />
that about 50% is sufficient, 30% is uncertain (lack of data)<br />
and 20% must be improved. The government spends about<br />
1 billion euro annually to maintain sufficient quality of protection.<br />
The public, now being informed in exact numbers<br />
about the status quo, complains about the lack of safety.<br />
Only 50% is guaranteed. But at present they are safer than in<br />
the past. Improvements take years and we should not forget<br />
that a life without risk is unrealistic. Our ancestors knew<br />
better and survived.<br />
Ground is support. Amsterdam is founded on hundreds of<br />
thousands of piles, tourists are told. Indeed, all Western<br />
Netherlands’ structures are supported in smart ways, exhausting<br />
the available bearing capacity of the ground which<br />
is only better at the level of glacial sand layers at depths of<br />
more than 10 metres. The early foundations of monumental<br />
buildings consist of thin wooden friction piles of 6 metres<br />
length at most, sometimes bundled in hoods (“huien”). During<br />
the 17th century, pile-driving machines (by hand) allowed<br />
to install longer wooden piles reaching solid sand<br />
layers. At present, a great variety of foundation methods are<br />
applied reaching depths of 50 metres and more. Now, the<br />
challenge is to build in complex situations with minimum<br />
hindrance to the adjacent environment. The construction of<br />
the north-south metro line in Amsterdam is a perfect example.<br />
Also in the past smart solutions were applied. Around<br />
1650 a strong southwestern storm blew the bell tower of the<br />
Laurens Church in Rotterdam lean, against the nave. The<br />
tower founded on short friction piles had become top-heavy<br />
by the last build-up in fine Italian marble. Lead by the city’s<br />
engineer, a new foundation of long timber piles was driven<br />
around the basement and the heavy tower was adjusted<br />
and put on the new foundation using iron chains and horsepower<br />
without a scratch, an incredible achievement. How<br />
exactly is not described. If we look at Rotterdam, to the new<br />
city centre with tallest buildings, the Kop van Zuid, the Van<br />
Brienenoord- and Erasmus Bridge, the enormous harbour<br />
and the many tunnels, recalling the local very soft soil conditions<br />
and high groundwater levels one may see impressive<br />
demonstrations of sophisticated engineering, however invisible.<br />
Ground is mobility. In the West of the Netherlands road<br />
and railway infrastructure is built on sand embankments.<br />
Without such support, no straight track is possible. Building<br />
roads on weak grounds that hardly settle is not an easy matter,<br />
mainly due to the heterogeneity in the underground.<br />
Ground is not transparent. Modern technologies like acoustic,<br />
seismic and radar reconnaissance are limited. Mobility<br />
needs a firm basis; with proper roads we can move around.<br />
The underground transportation infrastructure is impressive.<br />
<strong>Dam</strong> <strong>edition</strong> | Double Issue 2007/2008 | 16
Ingeokring <strong>News</strong><strong>letter</strong><br />
More than 50 km of short tunnels exist, mostly crossings in<br />
complex situations, under rivers and canals, through dikes<br />
and in dense cities, made under extremely difficult soil conditions.<br />
Since tunnels may provide a short connection, their<br />
flood resistance is of special concern. Tunnel-boring methods<br />
have only been applied since the last decennium, because<br />
current techniques were too risky. Within ten years<br />
Dutch tunnelling techniques conquered a top position in<br />
the international state of the art. The underground is full<br />
with cables and pipelines; every house directly connects to<br />
underground water, gas, sewer, electricity and communication<br />
lines, the length of which reaches many thousands of<br />
kilometres. Main pipes are pushed or conducted under waterways<br />
and other obstacles by directional drilling. The next<br />
step is underground litter transport, underground supply in<br />
city centres and harbours, and large multiple-cable tunnels.<br />
Ground is business. The mainports in Rotterdam and Amsterdam,<br />
as well as Vlissingen and Delfzijl, and many marine<br />
and yacht harbours have been built at borders of land and<br />
water. Quays, wharfs and jetties are suitable for the largest<br />
ships down to the smallest pleasure yachts. Schiphol airport<br />
sets high demands to its runways, constructed on the clayey<br />
bottom of a former lake. Mainports of Europe are cradles of<br />
industriousness, and their capacity is reaching limits. New<br />
ways of expansion are required on the over-occupied<br />
ground: expanding roads and high speed- (HSL) and cargo<br />
railways (Betuwe-line), new lands at the coast (after Stive:<br />
”an anthropogenic massive sand dune just offshore, as a<br />
sand engine creating coastland with time by natural morphological<br />
processes”), new harbour territory (Maasvlakte II),<br />
reviving wetlands in combination with living, working and<br />
nature (IJssel lake). These are great challenges with a distinct<br />
role for the engineer.<br />
Ground is home. More and more we use the underground<br />
space, the 3rd dimension. By moving less pleasant activities<br />
and functions underground, more space becomes available<br />
for activities mostly wanted on the surface such as living,<br />
recreation, agriculture and none the least, giving space to<br />
and enjoying nature. In the underground we may put all<br />
parking garages, shopping centres, libraries, prisons, greenhouses,<br />
public and cargo city transport, various industries<br />
such as water treatment plants, waste storage, and distribution<br />
systems. The underground is insensitive to climate and<br />
daily weather. The ground is a safe home to many activities.<br />
Ground is promising. The bio-chemical potential of the<br />
underground is immense and yet unexplored. In a single<br />
kilogram of soil one may find a thousand billion bacteria<br />
with all kinds of roles: decomposition of organic matter,<br />
nutrient cycling, involved in almost every chemical transformation<br />
in the soil. They can be active or inactive depending<br />
on availability of suitable nutrients. What if we can make<br />
them work for us! Recent developments in this field at<br />
GeoDelft have shown that natural forces of micro-life can be<br />
directed by bio-stimulation, bio-augmentation and bioremediation<br />
to alter soil conditions: making sandstone in<br />
just a few days, sealing-off leaky holes in soil layers without<br />
knowing a priori where they are located, creating specific<br />
slurries for settlement compensation, stabilising peat (not<br />
anymore exposed to oxidation), and cleansing polluted areas.<br />
The beauty of this approach is that we use nature itself<br />
to perform the job. Another striking example is geothermal<br />
energy. More that 99% of the earth is hotter than 1000 ºC,<br />
less than 0.1% is colder than 100 ºC. The underground becomes<br />
warmer with depth at 3 ºC per 100 metres. Imagine:<br />
we live on an immense stove. A large-scale solution for the<br />
present-day energy problem is right under our feet, reachable<br />
by modern and future smart drilling techniques from<br />
the oil industry. Moreover, knowing that more than 90% of<br />
our energy is won out of coal, gas and oil, and that over 35%<br />
of energy use is spent on in-house climate control, it is obvious<br />
that geothermal energy is just what we must develop.<br />
Fossil fuels become extinct (price tripled since 2000). Growing<br />
dependence on energy import is a bad policy. CO 2 -<br />
emission can be reduced by 20 to 30 percent, meeting the<br />
Kyoto declaration. Oil is in fact an irreplaceable ore, too important<br />
to burn. Finally, the oil industry may just stay in the<br />
energy market and expand to geothermal energy. Indeed,<br />
ground is promising.<br />
<strong>Dam</strong> <strong>edition</strong> | Double Issue 2007/2008 | 17
Ingeokring <strong>News</strong><strong>letter</strong><br />
Moraine dams and glacier lake outburst floods (GLOF)<br />
Senta Modder, DG Water, Ministerie Verkeer en Waterstaat<br />
Increased melting of glaciers due to climate change<br />
Climate change has its impacts on biodiversity, freshwater<br />
resources and local livelihoods. A rising average global temperature<br />
is threatening fragile ecosystems like glaciers. Seventy<br />
percent of the world’s freshwater is frozen in glaciers.<br />
Glacier melt buffers other ecosystems against climate variability.<br />
Very often it provides the only source of water for<br />
humans and biodiversity during dry seasons (IPCC, 2007).<br />
The Himalayas have the largest concentration of glaciers<br />
outside the polar caps. With glacier coverage of 33 000 km 2 ,<br />
the region is aptly called the ‘Water Tower of Asia’ as it provides<br />
around 8.6 million m 3 of water annually. These Himalayan<br />
glaciers feed seven of Asia’s great rivers and ensure a<br />
year round water supply to millions of people. Climate<br />
change has impacted the glacial ecosystem tremendously.<br />
67% of the glaciers in the Himalayas are retreating at a startling<br />
rate and the major causal factor has been identified as<br />
climate change (UNEP & ICIMOD, 2002).<br />
Increased risk of GLOF’s due to melting glaciers<br />
Many mountain glaciers in the world built up a prominent<br />
end-moraine during the Little Ice Age (Neo-Glacial) which<br />
lasted until approximately 1850. Since then, the majority of<br />
mountain glaciers in the world has been thinning and retreating<br />
upon a gradual change in climate. During retreat, a<br />
basin is usually formed between the thinning and receding<br />
ice-front and the end moraines. If the morainic dam is relatively<br />
impervious, a lake may form (Mool & Kadota, 1993).<br />
The material of an end moraine consists of unconsolidated<br />
moraine material and/or ice. Moraine material in general is<br />
composed of a diamicton, a heterogeneous mixture of boulders,<br />
gravel, sand and silt. Opposed to most man-made<br />
dams, which are constructed of reasonably erosion resistant<br />
material, the materials of a natural dam are generally very<br />
susceptible to erosion by piping and fluvial overflow. Glacial<br />
lake outburst floods (GLOF’s) are catastrophic discharges of<br />
water resulting primarily from melting glaciers. Principally, a<br />
moraine dam may break by the action of some external trigger<br />
or self-destruction. A huge displacement wave generated<br />
by rockslide or a snow/ice avalanche from the glacier<br />
terminus into the lake may cause the water to top the moraines<br />
and create a large breach that eventually causes dam<br />
failure (Ives, 1986). Earthquakes may also be one of the factors<br />
triggering dam break depending upon magnitude, location<br />
and characteristics. Self-destruction is a result of the<br />
failure of the dam slope and seepage from the natural drainage<br />
network of the dam or melting of internal ice cores.<br />
GLOF waves comprise water mixed with morainic materials<br />
and cause devastation for downstream riparian communities,<br />
hydropower stations and other infrastructure. In South<br />
Asia, particularly in the Himalayan region, it has been observed<br />
that the frequency of the occurrence of GLOF events<br />
has increased in the second half of the 20th century. GLOF’s<br />
have cost lives, property and infrastructure in India, Nepal<br />
and China.<br />
Fig. 1 Small GLOF at Chubung Glacier (Nepal) in 1991 (Modder & Van<br />
Olden, 1995).<br />
<strong>Dam</strong> <strong>edition</strong> | Double Issue 2007/2008 | 18
Ingeokring <strong>News</strong><strong>letter</strong><br />
Case study in Tsho Rolpa, Nepal Himalayas<br />
In 1995 I conducted a M.Sc. thesis in the Nepal Himalayas<br />
with my fellow student Quirijn van Olden. Subject was an<br />
engineering-geomorphological analysis of a moraine dam at<br />
Tsho Rolpa. We were invited by the Nepalese government<br />
and signed a Memorandum of Understanding with the Water<br />
& Energy Commission Secretariat of Nepal. After a small<br />
GLOF at Chubung Glacier in Rolwaling Valley, people were<br />
afraid that the Tsho Rolpa lake would also burst. Tsho Rolpa<br />
is located at an altitude of 4 548 m, is about 3.5 km long by<br />
0.5 km wide and is up to 135 m deep. The lake holds about<br />
80 million m 3 of water. We had two fieldwork periods of a<br />
month, one before and one after the monsoon. For our M.Sc.<br />
thesis, the Tsho Rolpa end moraine complex was analysed in<br />
terms of geomorphology, geotechnical properties of<br />
(surface) materials and (present-day) activity of geomorphological<br />
processes. The first week we spent making an<br />
appropriate topographical map. Then we proceeded to<br />
make a geomorphological map with profiles and an activity<br />
map. The (mass movement related to) melting of dead ice<br />
was identified as the geomorphologically most important<br />
factor. Then we prepared a geotechnical map and detailed<br />
geotechnical descriptions of the units in the geotechnical<br />
Fig. 3 Material of the moraine dam (Modder & Van Olden, 1995).<br />
Fig. 2 Overview of Tsho Rolpa (Modder & Van Olden, 1995).<br />
map, using field observations (scan lines, checklists) and<br />
laboratory tests. The following genetic material units have<br />
been recognised: present-day fluvial deposits, dead-ice<br />
melting induced deposits, colluvial deposits, glacial-fluvial<br />
deposits and glacial deposits. The glacial deposits, especially<br />
the so called ablation deposits, form the skeleton of the<br />
moraine dam and these units will be reached sooner or later<br />
when excavating. Ablation deposits can be described as an<br />
unsorted, well-graded, unstratified, non-oriented mass, consisting<br />
predominantly of subangular cobbles and boulders,<br />
lacking substantial amounts of fine and medium gravel,<br />
sand and fines (4%). In the end we used electromagnetic<br />
equipment to detect the dead-ice core bodies within the<br />
moraine complex. It was not possible to predict exact depth<br />
and size of dead-ice cores. Finally we translated the geomorphological<br />
and geotechnical information into useful recommendations<br />
for engineering applications. The main conclusion<br />
was that the melting of dead-ice in the subsurface is<br />
generating active mass movement on the inner slope of the<br />
dam and a lowering and retreat of the local water divide, the<br />
rim of the dam. One important consequence is the reduction<br />
in height difference between the lake and the dam, the<br />
so called freeboard. Therefore, we recommended lowering<br />
Fig. 4 Slope instability at inner side moraine dam (Modder & Van Olden,<br />
1995).<br />
<strong>Dam</strong> <strong>edition</strong> | Double Issue 2007/2008 | 19
Ingeokring <strong>News</strong><strong>letter</strong><br />
the lake level in order to prevent future GLOF. The second<br />
conclusion was that the spring zone present below the<br />
northwestern terminal moraine may be an important clue<br />
for the future, as by then dead-ice is assumed to be absent<br />
in the subsurface. This makes the location more suitable for<br />
possible future excavation processes.<br />
Installing siphons at Tsho Rolpa<br />
As a start of a remediation strategy Wavin Overseas B.V. Holland<br />
funded and installed a trial siphon over part of the<br />
northwestern terminal moraine in May 1995. This consisted<br />
of a triple-inlet pipe from the lake connecting to a single<br />
pipe (all 160 mm O.D.) whose discharge outlet was located<br />
about 80 m down the outer flank of the moraine.<br />
Alternative technical solutions to reduce GLOF hazard at<br />
Tsho Rolpa<br />
In March 1996, a proposal to the Dutch government for the<br />
long term remediation of Tsho Rolpa was prepared on behalf<br />
of Nepal by John Reynolds from the UK. He suggested<br />
to install more siphons at the northwestern terminal moraine.<br />
Jan Rupke from the University of Amsterdam was<br />
asked for a second opinion by the Ministry of Foreign Affairs<br />
of the Netherlands. Therefore, Jan Rupke and I made a technical<br />
paper (Rupke & Modder, 1996). Conclusion was that<br />
installation of more siphons had several technical disadvantages.<br />
The main disadvantage is the fact that the lake bottom<br />
topography is very shallow at this location. Because of<br />
friction losses due to the long pipe-inlet, this location is not<br />
suitable for siphoning. According to technical calculations<br />
by Wavin, the suction head of the siphon system is reduced<br />
to 0.4 m when the horizontal distance from pipe-inlet to<br />
highest point of the rim is 100 m. Another disadvantage of<br />
the use of siphons is the resulting fluctuating lake level. A<br />
siphon system is not capable of releasing the summer influx<br />
(up to 16 m 3 /s). The resulting fluctuating lake level has a<br />
negative influence on the stability of the dam due to changing<br />
ground temperatures and changing pore pressures.<br />
Another problem is that this shallow part of the lake has no<br />
connection to the deeper parts of the lake because it consists<br />
of several isolated holes. A 12 m lowering cannot be<br />
achieved here without excavating a long channel through<br />
the lake bottom. Considering these disadvantages we proposed<br />
the excavation of an overflow channel without using<br />
siphons. The main advantage is that a continuous, quick and<br />
permanent lowering of the lake level is achieved.<br />
Mitigation measures at Tsho Rolpa<br />
A revised proposal for remediation of Tsho Rolpa (by excavating<br />
an open channel!) was submitted by John Reynolds in<br />
December 1997. Funding worth $2.9 million was granted in<br />
March 1998 by the Dutch government. Preparation for mitigation<br />
measures could start (Reynolds, 1999).<br />
The geophysical studies of Tsho Rolpa moraine dams were<br />
conducted quite intensively during 1999 and 2000. This<br />
gave quite good insight into the internal structure of the<br />
dam, particularly the ice core. While the dam continues to<br />
degrade gradually, rapid and disastrous degradation has not<br />
been observed in recent years. The melting of the ice cores<br />
is still closely being monitored. The implementation of the<br />
mitigation measures started in April 1999 and the drawdown<br />
of the lake was completed in June 2000. The project<br />
essentially includes construction of an open channel, trapezoidal<br />
in cross-section, 6.4 m wide at the bottom and designed<br />
to cater 14 m 3 /s of flow with a maximum capacity of<br />
35 m 3 /s and achieve at least 3 m lowering of lake water level.<br />
A gate structure is designed to regulate the flow if necessary<br />
(e.g. during maintenance) and is otherwise left open year<br />
round. The open channel passes through Horseshoe Lake,<br />
roughly along the alignment of test siphons from May 1995.<br />
In 2004 a micro hydro-electric plant with a capacity of 15 kW<br />
was established to supply electricity to the operator house<br />
built at the project site and manned by 3 Department staff<br />
members year round. The plant taps water flowing through<br />
the sluice gate (Shrestha, 2007).<br />
Fig. 5 Mitigation works at Tsho Rolpa in 1999 (Shrestha, 2007).<br />
Fig. 6 Mitigation works finished at Tsho Rolpa (Shrestha, 2007).<br />
<strong>Dam</strong> <strong>edition</strong> | Double Issue 2007/2008 | 20
Ingeokring <strong>News</strong><strong>letter</strong><br />
Mool, P.K. & T. Kadota (1993). Preliminary Report on the First<br />
Field Investigation on the lower Barun Glacier Lake. WECS Report<br />
No. 3/4/080893/1/1 Seq. No 428, Kathmandu.<br />
Reynolds, J.M. (1999). Glacial Hazard Assessment at Tsho<br />
Rolpa, Rolwaling, Central Nepal. Quart. J. Eng. Geol, 32, pp.<br />
209-214.<br />
Rupke, J. & S. Modder (1996). Tsho Rolpa glacier lake, Rolwaling,<br />
Nepal. Comments on phase IIa of project proposal J.<br />
Reynolds. Alternative technical solutions to reduce GLOF<br />
hazard and set up a GLOF study cell. Commissioned by the<br />
Ministry of Foreign Affairs of the Netherlands.<br />
Fig. 7 Open channel finished in 2000 (Shrestha, 2007).<br />
References<br />
IPCC (2007). Climate Change 2007. Fourth Assessment Report.<br />
Ives, J.D. (1986). Glacial lake outburst floods and risk engineering<br />
in the Himalaya. ICIMOD occasional paper No. 5, Kathmandu.<br />
Shrestha, A.B. (2007). Personal communication, Department<br />
of Hydrology and Meteorology, Nepal.<br />
UNEP & ICIMOD (2002). Inventory of Glaciers, Glacial Lakes<br />
and Identification of Potential Glacial Lake Outburst Floods,<br />
Affected by Global Warming in the Mountains of Himalayan<br />
Region (www.rrcap.unep.org/issues/glof/glof/index.htm).<br />
Modder, S. & Q. van Olden (1996). Engineering Geomorphological<br />
Analysis of a Moraine <strong>Dam</strong> in the Nepal Himalayas.<br />
A detailed survey (scale 1:1500) at Tsho Rolpa Glacier Lake,<br />
Rolwaling valley, Dholakha District, East Nepal. M.Sc. thesis.<br />
<strong>Dam</strong> <strong>edition</strong> | Double Issue 2007/2008 | 21
Ingeokring <strong>News</strong><strong>letter</strong><br />
In the spotlights: De Ondergrondse<br />
Sanne Brinkman, Commissioner of De Ondergrondse (2006-2007)<br />
For years, the ‘Dispuut Ingenieurs Geologie’ (DIG) has been<br />
representing Engineering Geology students. As from October<br />
2006, this dispute has merged with its equivalent for<br />
Underground Construction. This led to a new student chapter<br />
named ‘De Ondergrondse - Dispuut voor Geo-<br />
Engineering’. All students doing their M.Sc. (Master of Science)<br />
within the section Geo-Engineering at TU Delft are<br />
members of De Ondergrondse. The section Geo-Engineering<br />
consists of Geomechanics, Geotechnics, Underground Construction<br />
and, of course, Engineering Geology. This merge<br />
also implies that De Ondergrondse will have considerably<br />
more members than the DIG used to have.<br />
2006-2007 Board of De Ondergrondse: Ivo van Kempen, Jan Mulder,<br />
Elles Bader and Sanne Brinkman.<br />
Engineering. Questionnaires are used to assess the students’<br />
opinion about specific courses and a discussion with professors<br />
follows in order to improve the courses. The results of<br />
this course evaluation will also be made available on Black-<br />
Board to both lecturers and students.<br />
Visit to a geotechnical laboratory during the Madrid study trip. Third<br />
from left, this <strong>News</strong><strong>letter</strong>’s guest editor Michiel Maurenbrecher can be<br />
seen.<br />
The question is now: What are the consequences of the<br />
merge regarding the activities of De Ondergrondse? Most of<br />
the activities previously organised by the DIG will still take<br />
place. These are, for example, lectures within the area of<br />
Geo-Engineering, company visits, the traditional Christmas<br />
Dinner, and many excursions. Regarding the excursions of<br />
last year, the trip to Madrid can definitely be considered one<br />
of the highlights. 28 students and professors spent four days<br />
in the capitol of Spain to visit projects and, of course, enjoy<br />
the Spanish ‘culture’!<br />
Further, an excursion to the Noord-Zuidlijn took place and<br />
the centrifuge of GeoDelft was visited. The latter is one of<br />
the many examples of the cooperation between De Ondergrondse<br />
and Ingeokring. De Ondergrondse is, besides all<br />
other activities, also involved in the production of this<br />
Ingeokring <strong>News</strong><strong>letter</strong>. Furthermore, De Ondergrondse is<br />
involved in the evaluation of the various courses of Geo-<br />
The larger target group of De Ondergrondse does not only<br />
mean that the size of the activities will, in general, be larger<br />
but also leads to an increased number of different activities.<br />
Once a year, there will be an annual meeting (ALV), during<br />
which the board will be changed, an overview of the past<br />
years’ activities is presented and insight in the financial<br />
status of De Ondergrondse can be obtained.<br />
Regarding the organization of the Dispuut, the 2006-2007<br />
Board consisting of Elles, Jan, Ivo and Sanne have experienced<br />
the period as board of De Ondergrondse as great fun,<br />
2007-2008 Board of De Ondergrondse: Auke Lubach, Daan de Clippelaar,<br />
Johan Haan, Paul Gerrits and Paulien Kouwenberg.<br />
<strong>Dam</strong> <strong>edition</strong> | Double Issue 2007/2008 | 22
Ingeokring <strong>News</strong><strong>letter</strong><br />
above all. The new board consists of Paulien, Johan, Paul,<br />
Auke and Daan. Paulien, Johan and Paul are all studying<br />
Engineering Geology and will therefore be in touch with the<br />
Ingeokring.<br />
Finally, if you want to stay up-to-date, please visit our website<br />
at www.ondergrondse.nl. The latest news within the<br />
subject of Geo-Engineering and reports of activities can also<br />
be read in the news<strong>letter</strong> of De Ondergrondse, which appears<br />
four times per year. If you wish to receive the Ondergrondse<br />
news<strong>letter</strong> or want to contact us, please send an<br />
email to: info@ondergrondse.nl.<br />
Wishing you, on behalf of the board, a cordially Glück Auf!<br />
<strong>Dam</strong> <strong>edition</strong> | Double Issue 2007/2008 | 23
Ingeokring <strong>News</strong><strong>letter</strong><br />
<strong>Dam</strong> and canal design on soluble rock (West Gode Irrigation<br />
Project, Ethiopia)<br />
Dr. Peter N.W. Verhoef, Royal Boskalis Westminster nv (formerly Delft University of Technology, Section Engineering Geology)<br />
Prologue<br />
In December 1985 ir. Jaap Oosterman, a DHV engineer who<br />
was managing a NEDECO project for an irrigation scheme in<br />
Ethiopia, visited Prof. David Price. David called me to his<br />
office to join this meeting in which Jaap shortly explained<br />
the project. In the Ogaden desert, along the river Wabi Shebelle<br />
near Gode, an irrigation scheme was planned. It involved<br />
some 20 000 hectares of land to be irrigated, a major<br />
project for the Somali province of Ethiopia. It was a gravity<br />
irrigation project, one of the first of its kind. Current irrigation<br />
was normally done using pumps, where the fuel<br />
needed for the pumps would cost as much as the harvest of<br />
the land would gain. The team of Jaap Oosterman was doing<br />
the design of the project, which had to be finished within a<br />
time span of 8 months, including all field work needed. One<br />
of the key factors was the design of a small weir. This diversion<br />
dam was going to be constructed on a horizontal platform<br />
of limestone, which acted as a barrier causing the river<br />
Wabi Shebelle to flow around this rock. The main reason of<br />
the visit was to discuss the foundation of the dam. Since the<br />
foundation was on rock, Jaap sought the advice of David<br />
Price, the ‘éminence grise’ of Dutch Engineering Geology.<br />
The idea was to build the dam on this rock platform in the<br />
dry, while the river could continue to flow uninterrupted by<br />
the construction process. When finished, the river would be<br />
dammed and the water diverted to the weir to enter the<br />
main irrigation canal. This looked like a good idea.<br />
But then Jaap started to sum up some of his worries. He<br />
mentioned big slabs of limestone found downstream of the<br />
rock platform. He was worrying about these. We talked<br />
about erosion processes that might have caused dislocation<br />
of slabs from the rock outcrop. But then Jaap mentioned<br />
there was gypsum rock in the subsurface. At this point David<br />
Price started to laugh and said with his typical thunderous<br />
bas-baritone voice: “Gypsum?...forget the whole project!”.<br />
With gypsum present in the rock mass under the dam there<br />
would be a high chance of problems caused by the solubility<br />
of this rock. He mentioned examples of dams on gypsum<br />
rock foundation that had failed when reservoirs were filled<br />
for the first time (Flores Calcano & Rodrigues Alzura, 1967).<br />
He was pessimistic and said that a thorough investigation<br />
was needed to find out the geological conditions of the dam<br />
site.<br />
It was decided at the meeting that I would go to Ethiopia in<br />
January 1986 to do field work and prepare a site investigation<br />
program for the dam. Jaap had scheduled a visit to the<br />
site of three days, but David and I insisted that two weeks of<br />
fieldwork were needed for me to be able to do the work.<br />
So I went off to Addis Abeba in January, where I was to join<br />
other team members to travel to the Ogaden. There we<br />
found that the old DC-4 Dakota plane that should fly us to<br />
Gode had broken down. We had to wait a few days, which<br />
meant that I had only one week to spend in the field. During<br />
the week preceding the site visit, I visited the Ministry of<br />
Mines where I could study 1:20 000 aerial photographs of<br />
the site and a hydrogeological report on the Ogaden area<br />
(NWRC, 1972). This allowed a proper preparation of the fieldwork.<br />
A visit to the Technological University in Addis Abeba<br />
was made, to acquire information on the possibilities for<br />
geophysical site investigation and laboratory testing of rock<br />
in Ethiopia.<br />
Our party, consisting of Jaap Oosterman, other Ethiopian<br />
and Dutch engineers and myself, left next weekend for<br />
Gode. This was no straightforward trip. First by plane to Deri<br />
Dawa. We stayed overnight in this town and bought food at<br />
the local market place to bring with us. The next day we flew<br />
in the Dakota to Gode. The most interesting flight I have had<br />
up to now! The doors could not be locked anymore and<br />
were secured by hemp rope. The small plane slowly rose and<br />
flew at low height over the mountains, rocking and jumping.<br />
One of the few times I saw many people making use of paper<br />
vomiting bags… After a few hours we arrived at Gode.<br />
From there the party went by Toyota Land Cruiser to the<br />
camp site, some 40 km to the west. We made a stop along<br />
the road to examine a basalt outcrop. One of the nice things<br />
of being a geologist is that you can explain people a lot<br />
about their own rocks, even when you yourself are a newcomer<br />
under the African sky!<br />
<strong>Dam</strong> <strong>edition</strong> | Double Issue 2007/2008 | 24
Ingeokring <strong>News</strong><strong>letter</strong><br />
1. Geology<br />
Ethiopia is situated at the Afar triangle, the well-known triple<br />
point of the African and Red Sea rift systems (Figure 1).<br />
Therefore one of the first things to think of is seismic risk<br />
related to movements along the fault system of the rift. Existing<br />
hazard maps show that the Ogaden occurs far south<br />
of the mountain ranges along the rift system and Gode is<br />
situated in a low seismic risk zone.<br />
has incised in this plateau, it flows 5 to 6 m below plateau<br />
level (Photo 1). The Wabi Shebelle flows in a broad valley<br />
filled with alluvial clay deposits. This clay apparently seals<br />
the river from the surrounding soluble gypsiferous rock,<br />
which explains that this river does not disappear into the<br />
underground and can reach the Indian Ocean (Figure 2).<br />
Fig. 2 Geological map of Ethiopia (note that the Ogaden desert coincides<br />
with the presence of gypsum rock at the surface).<br />
Fig. 1 Location of the Ogaden and Gode.<br />
The geological map of Ethiopia reveals that the Ogaden is<br />
underlain by Cretaceous gypsiferous rocks (Figure 2). On the<br />
map one can see that the northern rivers entering the<br />
Ogaden desert disappear in the underground, attesting to<br />
the effect of dissolution of gypsum (Figure 2). At a distance<br />
of 40 km from the proposed diversion dam site near Gode, a<br />
deep borehole has been made which shows that the gypsiferous<br />
rock formation is at least 250 m thick. The cross section<br />
shows that basaltic rock, related to African Rift volcanism,<br />
has intruded into the gypsiferous Cretaceous rocks<br />
(Figure 3).<br />
When we examine the local geological map west of Gode<br />
(Figure 4), we see that the basement of gypsiferous rock is<br />
covered by recent wadi deposits, with the wadi streams<br />
flowing into the direction of the Wabi Shebelle. At present<br />
the Ogaden is a plateau gently dipping into the direction of<br />
the Indian Ocean (Figures 2 and 3). The Wabi Shebelle itself<br />
The alluvial deposits are reported to reach a thickness of at<br />
least 30 m (NWRC, 1972). In the study area the alluvial deposits<br />
have a width of 12 to 13 km. The deposits consist of<br />
clays, sandy silts and gravels rich in ferromagnesian minerals<br />
resulting from the weathering of volcanic source rocks situated<br />
in the mountains far to the northeast (Figure 4, green<br />
horizontal hatching). The recent local deposits are alluvial<br />
wadi deposits and debris cones from intermittent rivers and<br />
wind-blown silt deposits often redeposited by flood flows<br />
during rainstorms (Figure 4, red hatching).<br />
The main gypsiferous formation (Neocomian, Lower Cretaceous)<br />
occupies a large part of the Ogaden (Figure 4, white).<br />
It is made up of alternating marls, more or less gypsiferous<br />
clays, thick beds of massive gypsum, dolomites and very<br />
Photo 1 Wabi Shebelle near Gode.<br />
<strong>Dam</strong> <strong>edition</strong> | Double Issue 2007/2008 | 25
Ingeokring <strong>News</strong><strong>letter</strong><br />
thick rock salt layers. Thickness near Gode surmounts 250 m.<br />
On top of the gypsiferous formation a dolomitic-calcareous<br />
layer of about 30 m thick occurs, the Mustahil Limestone.<br />
This layer forms a very distinct resistant cover over the main<br />
gypsum, and represents a major geomorphologic feature of<br />
the Ogaden (Figure 4, blue coloured rock in the south). The<br />
dolerites are within 15 km of the building site of the dam.<br />
Examination in the field has shown that the dolerite occurs<br />
mainly as rounded core stones left over from ancient weathering<br />
episodes. The core stones itself, however, have only a<br />
very thin weathered skin of brown coloured iron oxides.<br />
They are strong, dense and fresh and probably suitable for<br />
construction purposes.<br />
Fig. 3 Section AA’ of geological map in Fig. 2. Basement rock is Jurassic<br />
limestone overlain by gypsum rock and sandstones, which are invaded<br />
by dolerite and basalt related to the African Rift system.<br />
very rich fossil content points to a Barremian-Albian age<br />
(Lower Cretaceous). The Mustahil Limestone is covered by<br />
gypsiferous marly layers. Dolerite dykes of olivine basalt<br />
composition cut through the sedimentary cover all over the<br />
Ogaden Basin (Figure 4, green colour). Occurrences of these<br />
Fig. 5 Outline of irrigation project (I and II: location of dam site I and II).<br />
2. The irrigation scheme layout<br />
Figure 5 gives schematically the layout of the irrigation<br />
scheme. The proposed dam site occurs at location I. As you<br />
can see, the design was changed (why will become clear in<br />
the following) and the main canal starts at dam site II. First<br />
an area to the north of Wabi Shebelle is irrigated. This area is<br />
called West Gode. Then the irrigation canal crosses the river<br />
by a siphon to irrigate an area south of the river.<br />
3. <strong>Dam</strong> site I<br />
The site of the weir structure has been chosen at a locality<br />
where limestone rock forms a natural barrier for the Wabi<br />
Shebelle (Photo 2). On the 1:250 000 geological map this<br />
rock is indicated as belonging to the Mustahil Limestone<br />
(Figure 4).<br />
Fig. 4 Geological map west of Gode (white: gypsiferous rock series,<br />
blue: Mustahil Limestone, green: dolerite and basalt, red hatch: recent<br />
wadi deposits).<br />
When I examined this outcrop in 40 degrees Celsius heat (it<br />
was forbidden to swim in the river, since the local crocodile<br />
was really dangerous), I found that the limestone rock is<br />
<strong>Dam</strong> <strong>edition</strong> | Double Issue 2007/2008 | 26
Ingeokring <strong>News</strong><strong>letter</strong><br />
that below the limestone, layers of clay alternating with gypsum<br />
occur, and below that massive gypsum and gypsiferous<br />
dolomite may occur.<br />
Both the limestone foundation and the underlying rock are<br />
suspect of having dissolution cavities or open discontinuities,<br />
since both gypsum and carbonate are solvable. Field observations<br />
have not shown obvious dissolution features in the limestone,<br />
apart from features resulting from the river erosion. The<br />
gypsum layers above the limestone, however, indicate recent<br />
dissolution features; open piping-like holes at least 1.5 meters<br />
deep into the formation occur along the riverside.”<br />
Photo 2 <strong>Dam</strong> site I, on this limestone rock the dam was planned to be<br />
constructed in the dry.<br />
capped with a reddish-yellow dolomite layer of about 1 m<br />
thickness, which appears to be very resistant to river erosion.<br />
Below this dolomite layer, a thinly bedded limestone sequence<br />
occurs with a thickness of at least 2.70 m (measured<br />
up to the water line). The limestone rock has a more or less<br />
horizontal position. Striking, however, is that the limestone<br />
beds tend to dip water-inward at many places where the<br />
limestone borders the river (see the dip signs in the sketch<br />
map of Figure 6). This indicates that somewhere below the<br />
waterline the river erodes a soft layer, undercutting the limestone.<br />
On the left bank of the river the limestone and dolomite<br />
are covered by recent sandy silt deposits, with some<br />
clay intercalations. Cross-bedding in the sandy silt indicates<br />
that these have been laid down by sheet wash on the riverbank<br />
slope during heavy rainfall periods. On the right bank,<br />
however, on top of the yellow dolomite two beds of gypsiferous<br />
formation occur, with a total thickness of 3 m<br />
(maybe these beds have been eroded away by the river on<br />
the left bank in the past, before deposition of the recent<br />
sheet wash deposits). The lower of the two gypsiferous beds<br />
is about 1.25 m thick and consists of thinly bedded distorted<br />
limestone layers and pebbles and loose blocks of limestone<br />
cemented by fine, crystalline gypsum. On top of this, there is<br />
a 1.75 m thick layer of gypsiferous gravel and marly sand. It<br />
has been observed that this gypsiferous bed can be easily<br />
eroded by the river and that dissolution occurs. On top of<br />
the gypsum beds about 2 m of recent sandy silt sheet wash<br />
deposits occur (Figure 6, cross section AA’).<br />
In the field I gathered information on the rock discontinuities<br />
along scan lines. In the limestone two sets of subvertical<br />
discontinuities occur; a set (J1) which trends in NE-SW direction<br />
and is persistent (>20 m) and a set (J2) which trends in<br />
NW-SE direction. On the dolomite surface these subvertical<br />
joints have a very wide aperture (up to several tens of centimetres),<br />
due to erosion by the river. In the underlying platy<br />
limestone the aperture of the joints closes to very tight. The<br />
third set of discontinuities that exists is parallel to the subhorizontal<br />
bedding. In the platy limestone beds also a scan<br />
line measurement has been carried out. The joints and bedding<br />
planes are being opened up by tree roots, some are<br />
very wide, some are narrow and filled with stiff clay. Most<br />
discontinuities are tight.<br />
I wrote the following description in my report concerning<br />
the engineering geological situation of this site:<br />
“The foundation rock for the diversion dam consists of strong<br />
dolomite and limestone. Thickness of the foundation rock is at<br />
least about 4 meters, drilling will have to provide information<br />
on depth and nature of the underlying materials. It is expected<br />
Fig. 6 Sketch of the design of the dam on site I, with cross sections<br />
made after the results of the borehole investigation became available.<br />
<strong>Dam</strong> <strong>edition</strong> | Double Issue 2007/2008 | 27
Ingeokring <strong>News</strong><strong>letter</strong><br />
The aim of the field work was to prepare the site investigation<br />
that would follow. The observations made it evident<br />
that more information of the discontinuities should come<br />
from the boreholes. Since the two sets of joints are subvertical,<br />
inclined boreholes are necessary to obtain information<br />
on the nature of these. So a borehole program was set up<br />
and it was specifically stressed that inclined drilling had to<br />
be done. Also borehole packer tests were requested, to determine<br />
rock mass permeability.<br />
My main assignment was to assemble the necessary parameters<br />
to define the foundation of the dam. I did not expect<br />
problems concerning the bearing capacity of the foundation<br />
rock. The crucial hazard was the possibility of leakage<br />
pathways, either already existing or induced by the changed<br />
hydraulic head after construction of the dam. The possibility<br />
of piping erosion due to dissolution of gypsum present in<br />
the foundation rock should be considered. Possibly a grouting<br />
curtain would have to be constructed below the dam to<br />
prevent such piping erosion, or to decrease the permeability<br />
of the foundation rock. A grouting blanket to seal the pervious<br />
dolomite layer might also be necessary. So I summed up<br />
my requirements for the ensuing site investigation:<br />
“The data coming from the further site investigation and<br />
laboratory tests will be necessary to assess:<br />
• the nature of the foundation rock mass<br />
• the bearing capacity of the rock mass<br />
• permeability of the rock mass<br />
• possibility of piping erosion/dissolution problems<br />
• necessity of grouting<br />
• rippability of the rock<br />
• abrasion resistance of the limestone rock<br />
• type of concrete to be used on site (considering the possibility<br />
of reaction of concrete with sulphate-rich water or<br />
with dolomite)<br />
Certainly for construction of the dam the gypsum layers on<br />
top of the dolomite will have to be removed. This can easily<br />
be done by ripping.<br />
The quality of the further site investigation will determine<br />
the firmness with which answers can be given to the above<br />
mentioned questions concerning the diversion dam construction<br />
on this site.”<br />
Photo 3 <strong>Dam</strong> site II with drill rig at position of borehole 25 (Figure 8).<br />
4. The site investigation in April and May 1986<br />
After the preparatory fieldwork, I wrote the requirements for<br />
the fieldwork needed on the dam site. The locality was chosen<br />
in the expectance of finding a sequence of limestone<br />
and underlying gypsiferous stiff clay to found the dam upon.<br />
Since also massive gypsum was expected below the site,<br />
deep boreholes were prescribed. The cross sections of Figure<br />
6 show the situation that was found after drilling these<br />
boreholes. The limestone is at places highly fissured parallel<br />
to the bedding and has low RQD values. In one borehole a<br />
cavity, of which the bottom was not reached, was encountered<br />
(probably in gypsum) at 18.5-20.0 m depth. At this site<br />
also geophysical surveying has been performed. Due to the<br />
complicated subsurface conditions at the dam site the seismic<br />
refraction measurements were unsuccessful. Electric<br />
resistivity soundings along flushing canal and desilting basin<br />
gave better results, but their interpretation awaited confirmation<br />
by drilling (Ruiter, 1986).<br />
After the execution of 6 boreholes it was decided to abandon<br />
the site because the quality of the underlying limestone<br />
and gypsum was such that an expensive grouting program<br />
would be surely necessary to improve the foundation of the<br />
diversion dam. The main advantage of the site, from a construction<br />
point of view, was the possibility to build the dam<br />
without any necessity to divert the river during construction.<br />
Now a new site had to be selected, lacking this advantage.<br />
I was phoned at that time and told that the cavities below<br />
the limestone layer were so large that when the driller hit<br />
the rock with a steel bar, one could hear a hollow sound<br />
from below!<br />
<strong>Dam</strong> <strong>edition</strong> | Double Issue 2007/2008 | 28
Ingeokring <strong>News</strong><strong>letter</strong><br />
5. A new site for the dam: dam site II<br />
A new site was selected one kilometre upstream, with the<br />
intention of founding the dam on alluvial stiff clay, which<br />
was reported by the Wabi Shebelle Survey to have a thickness<br />
of at least 30 m at that location (Figure 5). A comprehensive<br />
drilling program was set up with this in mind (Photo<br />
3). An electrical resistivity survey along the proposed dam<br />
site was performed as well, by an engineering geophysics<br />
student from Delft, Jacob Ruiter, who stayed for several<br />
months at the project site (Ruiter, 1986). Unexpectedly, already<br />
the first borehole (nr. 1) hit gypsum rock at the unexpected<br />
depth of 7.5 m. The following two boreholes (nr. 5<br />
and 7), found the rock surface at depths of 23 and 30 m,<br />
respectively (Figure 7). At this stage I was called in, since<br />
again problematic rock was involved at the site. From June<br />
19 until June 26 a field visit was made.<br />
It was expected that two days were needed to evaluate the<br />
situation at dam site II. Unfortunately the drilling crew had<br />
experienced difficulties. Rock coring had become impossible<br />
due to lost wire-line rods in borehole 7. Up to now, only<br />
information of the above mentioned 3 boreholes was available.<br />
Drilling equipment was excellent: a brand new Nordmeyer<br />
DSB 1/3.5 trailer-mounted rig. But it would take 3<br />
months before the replacement rotary core barrels would<br />
reach the site from Germany.<br />
Fig. 7 Interpretation using the first three boreholes and the electrical<br />
resistivity survey made at dam site II.<br />
Fig. 8 After the results of the auger drilling through the clay soil became<br />
available (red numbers give depth to rock), a depth contour map of<br />
gypsum rockhead could be made. This map shows the outline of a<br />
steep gorge in the gypsum rock in the subsurface.<br />
Somewhere in August we could examine the results of the<br />
drilling exercise. Figure 8 shows just as I expected the outlines<br />
of a meandering river valley with steep slopes. The first<br />
design had placed the dam structure right on top of a subsurface<br />
gypsum rock hill!<br />
The new information now allowed us to define the best<br />
position for the dam. This should be a position where there<br />
would be a thick layer of alluvial clay separating the foundation<br />
of the dam from the gypsiferous rock. In Figure 10a the<br />
design of the diversion weir is given. It is shown that the<br />
weir is used to divert the water of the river via a desilting<br />
basin to the main canal. Also the dikes that are constructed<br />
once the dam is finished are indicated on the drawing. Plateau<br />
level is 327 m at the site, so the dam is constructed in<br />
excavation. The simplified picture of the design is shown in<br />
Figure 10b.<br />
In the meantime I had developed quite a good idea of what<br />
could be expected in the subsurface at this new dam location.<br />
I envisaged that when the river first encountered this<br />
gypsiferous rock, extensive dissolution must have occurred<br />
at the river bed. Steep gorges as you see in some limestone<br />
terrains must have developed. A karstic moonscape, now<br />
filled with alluvial clay deposits. A plan was drawn up to<br />
spread the boreholes to a wider area. Fortunately we could<br />
still drill up to the rock head, using the shell and auger<br />
equipment which was still functioning.<br />
Fig. 9 Cross section along AA’ of the map of Figure 8. The black outline<br />
shows the location chosen for dam construction.<br />
<strong>Dam</strong> <strong>edition</strong> | Double Issue 2007/2008 | 29
Ingeokring <strong>News</strong><strong>letter</strong><br />
The location of the dam is along the line of boreholes JIFHG<br />
in Figure 8. There, the depth of the gypsiferous rock is at -22<br />
m or more, which is at about 300 m as can be seen in Figure<br />
9. On the cross section in this figure the outline of the dam is<br />
shown in profile. Borehole H has been continuously sampled<br />
by large diameter Shelby<br />
tube. This was done to<br />
ensure that any permeable<br />
layer within the clay<br />
would be detected. In<br />
several of the boreholes,<br />
permeability tests (falling<br />
head) were performed in<br />
the clay and piezometers<br />
were placed.<br />
One of the more hazardous<br />
findings was that the<br />
Photo 4 120 mm tube core of stiff clay<br />
with gypsum veins and nodules<br />
stiff clay regularly contained<br />
gypsum nodules,<br />
(borehole H).<br />
at some places up to 40 volume percent (Photo 4). This was<br />
disquieting, since one of the major questions for the foundation<br />
stability of the dam was at this time formulated as:<br />
“What would be the effect of the rebound of the soil after<br />
excavation in the clay?” This question was related to the fact<br />
that the dam would be constructed in excavation. Since the<br />
weight of the soil mass removed in the excavation would be<br />
higher than the weight of the diversion weir constructed in<br />
it, rebound fractures might form in the clay mass and together<br />
with any dissolution of gypsum this would have a<br />
deteriorating effect on the integrity of the clay directly below<br />
the dam structure.<br />
6. Helicopter Survey<br />
My second visit in June gave me extra opportunities to get<br />
familiar with the local geology. As I had difficulties to convince<br />
people of the necessity of inclined drilling and the<br />
performance of packer permeability tests after my first visit<br />
in January, in June the client had become very aware of the<br />
major problem which the project was facing: the solubility<br />
Photo 5 Sinkholes in the silt cover of the plateau in the West Gode irrigation<br />
area.<br />
of the gypsum bedrock! A helicopter was now available to<br />
perform an extensive survey over the area. General geological<br />
surveying was performed and suitable localities for the<br />
construction materials needed for the project were sought<br />
for. The work during this week was carried out together with<br />
the site geologist, Ato Getu Tilahun.<br />
Three days were needed to survey the area and to find suitable<br />
locations for construction materials. On the geological<br />
map (Figure 4) the localities visited are given (Nos. 1-8); at<br />
each locality a walk-over survey lasting one to two hours<br />
was made. Sufficient basalt of good quality is present at site<br />
8. The basalt forms a ridge, estimated to be possibly 500 m<br />
long (striking NWW-SEE). If it would be decided to open up a<br />
quarry there I advised to put down exploratory boreholes to<br />
check for the degree of weathering of the olivine basalt,<br />
since other parts of the basalt nearby (sites 2 and 5) are extensively<br />
affected by secondary alteration and serious<br />
weathering. Site 8 is about 14 km from the dam site.<br />
Fig. 10a: design of the diversion weir (top); 10b: sketch map (bottom).<br />
The best source for sand and gravel is the wadi south of dam<br />
site II. The wadis north of the Wabi Shebelle are unsorted<br />
with a large amount of fines. In the wadi south of dam site II<br />
<strong>Dam</strong> <strong>edition</strong> | Double Issue 2007/2008 | 30
Ingeokring <strong>News</strong><strong>letter</strong><br />
the fines are washed out at many places. Up to 10 km south<br />
of the dam site, the wadi has localities with large accumulations<br />
of sand and gravel. The composition is mainly limestone<br />
and chert (amorphous quartz). Also some contamination<br />
with gypsum is likely to be present. Chert is known to<br />
cause alkali-aggregate reactions in concrete, causing cracking<br />
after about 10 years. However, since it is clear that sulphate<br />
resistant cement has to be used for construction of<br />
the dam (to protect the concrete from aggressive sulphaterich<br />
groundwater), alkali-aggregate reactions will be prevented.<br />
m (Photo 6). Diameters up to 3 m have been observed. The<br />
holes may be very deep (in the order of one to three metres),<br />
which can best be observed in January (as was told by the<br />
local Somali herdsmen), when the soil is completely dried<br />
out and maximum shrinkage has occurred. In the central<br />
area of West Gode a bush zone occurs, which is excluded<br />
from irrigation. Within the bush the concentration of holes is<br />
less but the sinkholes are larger (up to 3 m). This is probably<br />
due to the vegetation; the groundwater does not reach the<br />
underlying gypsum in such an amount as in the adjacent<br />
area next to the bush.<br />
Another interesting observation was made at site 7 (Figure<br />
4). From the air this seemed to be a quarry in limestone. It<br />
turned out, however, to be a limestone layer about 2 m thick<br />
overlying a thick, massive gypsum layer. An entrance into a<br />
cave was present. The cave, developed in the geological<br />
past by the dissolution of gypsum, was 50 m long, 20 m<br />
wide and 5 m high. Apparently the limestone layer could<br />
span a cavern of this size. Adjacent to the cave a collapsed<br />
cavern is present (Photo 7).<br />
Photo 6 Sinkhole about 40 cm deep, developed after rainy period of<br />
two weeks.<br />
The proposed irrigation area of West Gode was surveyed<br />
from the air and photographs were taken. Especially in the<br />
area north of the alluvial deposits (see geological map, Figure<br />
4), where overland flow occurs during the rainy season,<br />
many sinkholes have developed (Photo 5). The sinkholes<br />
have apparently been formed where gypsum is present in<br />
the subsoil. The gypsum dissolves, forming cavities that<br />
subsequently collapse. Size of these holes is mostly 0.5-1.0<br />
Photo 8 Vast area with huge limestone slabs downstream of dam site I.<br />
Probably this rock is the remnant of a collapsed roof above a dissolved<br />
gypsum layer (Figure 6). Somali pastors guard their herd.<br />
After I had seen the collapsed roof of the cave, it became<br />
completely clear to me what situation I had encountered at<br />
dam site I. I concluded that the limestone plate abutting the<br />
river was in fact a remnant roof rock above an elsewhere<br />
completely dissolved and collapsed gypsum layer as illustrated<br />
in Figure 6. This explained the loose large slabs of<br />
limestone lying upstream and downstream of the rock<br />
(Photo 8).<br />
Photo 7 Cave in gypsum rock below a limestone roof of about 2 m<br />
thick. This situation serves as a model for the situation at dam site I<br />
(Figure 6).<br />
The helicopter survey, which lasted three days, allowed a<br />
better understanding of the local geology. I could now draw<br />
a sensible cross-section through the area, which is given in<br />
<strong>Dam</strong> <strong>edition</strong> | Double Issue 2007/2008 | 31
Ingeokring <strong>News</strong><strong>letter</strong><br />
Figure 11. The interpretation of the limestone at dam site I<br />
as being Mustahil Limestone on the geological map was<br />
certainly wrong. It contains hardly any fossils and is a limestone<br />
and dolomite intercalated in the gypsiferous rock<br />
formation.<br />
Everywhere in the area there is evidence of the high dissolution<br />
capacity of gypsum, which forms the main geotechnical<br />
problem of the Gode Irrigation Project.<br />
grout curtain (middle and lower drawing). Both a blanket in<br />
front of the dam and a grouting curtain ensure a reduction<br />
in hydraulic velocities and uplift pressures under the dam.<br />
Grouting is common practice in dam construction. It is used<br />
to improve bad rock conditions in the foundation (sealing of<br />
fissures to improve bearing capacity and to reduce seepage).<br />
In general, if the rock is reasonably sound and no improvement<br />
of the bearing capacity is necessary, then a sealing<br />
blanket fulfils the function of reducing seepage velocities.<br />
In the case of gypsum rock, a classic curtain design<br />
would probably even be hazardous. If the grouting has been<br />
done by injection through boreholes, there is always a<br />
chance that water comes directly in contact with gypsum<br />
and starts dissolving, right under the dam structure itself<br />
(Figure 12).<br />
Fig. 11 NS geological cross section through the valley of the Wabi Shebelle.<br />
7. The engineering geological situation<br />
Figure 9 gives schematically an interpretation of the geological<br />
situation at dam site II. The alluvial sequence is silty<br />
sand underlain by stiff clay with on average 10-20% of gypsum<br />
nodules. At a lower level pebbles of limestone are present<br />
in this clay, and the lowest layer consists of limestone<br />
gravel. The bedrock consists of a sequence of gypsum with<br />
clay and limestone intercalations. The top 15 m along the<br />
rock-alluvium surface may be badly weathered gypsum and<br />
limestone.<br />
If the diversion dam would be founded upon stiff clay, a<br />
layer of about 10-15 m of clay is sealing-off the probably<br />
highly permeable zones below that. This situation seems to<br />
be acceptable. What has to be considered to assess the risk<br />
of this situation are the possible water transporting zones in<br />
the clay and their permeability. A second consideration<br />
should be the possible dissolution of gypsum crystals in the<br />
clay and its effect on settlement of the structure and maybe<br />
even on leakage.<br />
If the dam or dykes would be founded upon the gypsum<br />
rock series, such as below borehole 1 and 5 (Figure 8 and 9),<br />
then permeable zones should be detected. Dissolution of<br />
gypsum may lead to excessive settlement of the structures.<br />
Concentration of dissolution in certain zones results in tubular<br />
water pathways (piping) below the structures with consequently<br />
excessive leakage.<br />
Fig. 12 Sketch of the design of the diversion weir and hypothetical<br />
drawings of the groundwater flow paths in the case of a design with a<br />
grout curtain. The disadvantage of a grout curtain is the possibility of<br />
dissolution taking place right at the dam structure itself.<br />
At dam site II it seems that the problem of dissolution of<br />
gypsum might be controllable since the foundation of the<br />
dam will be on stiff clay which seals off the fresh water from<br />
the gypsum rock below (Figure 13). But considering the<br />
entire project, major difficulties can be envisaged. Fresh<br />
water will flow in canals over large stretches of area directly<br />
underlain by gypsum rock. This requires an analysis of the<br />
impact of this problem on the project.<br />
In Figure 12 the implications of such a situation are illustrated.<br />
Two measures to decrease the hydraulic head are<br />
indicated: a blanket in front of the dam (top drawing) and a<br />
<strong>Dam</strong> <strong>edition</strong> | Double Issue 2007/2008 | 32
Ingeokring <strong>News</strong><strong>letter</strong><br />
8. The engineering of hydraulic structures on gypsiferous<br />
rock: dissolution problems<br />
The Ogaden near Gode is underlain by a sub-horizontal sequence<br />
of gypsiferous rock, which at Gode has a thickness of<br />
at least 250 m. In the irrigation area on top of the gypsiferous<br />
rock there may be alluvial sediments of varying thickness,<br />
deposited by the Wabi Shebelle. These are mainly stiff<br />
red clays that contain gypsum grains. Thickness can amount<br />
up to 37 m. Also so-called recent local deposits consisting of<br />
silty sand with local clay seams may be present above the<br />
gypsiferous rock (Figure 4).<br />
the sealing effect of the clay-rich alluvium that was likely<br />
deposited by the river during an earlier phase of relatively<br />
high sea level.<br />
The main problem with foundations of dams or other hydraulic<br />
structures on gypsiferous rock is how to prevent<br />
excessive dissolution to occur. Gypsum is one of the rockforming<br />
minerals which tend to dissolve in fresh water.<br />
Compared with carbonate rock such as limestone, it dissolves<br />
twice as fast and more importantly, much more material<br />
can be taken into solution (about 1 600 times or more)<br />
(James & Kirkpatrick, 1980). The rate of dissolution depends<br />
on the composition of the dissolving water, the ambient<br />
temperature, the flow velocity of the dissolving water, and<br />
the contact area of the gypsum exposed to the dissolving<br />
water (Table 1).<br />
Table 1 Comparison of dissolution rates for different soluble rocks,<br />
using the model of Figure 14: retreat of a soluble surface beneath flowing<br />
water. Solubility and dissolution rate constants from James & Lupton<br />
(1978).<br />
Fig. 13 Design of the diversion weir on stiff clay with impermeable<br />
blanket.<br />
The gypsiferous rock series is a sequence of layers of varying<br />
lithology. Massive gypsum layers, several metres in thickness,<br />
alternate with gypsiferous marls and clays and limestone<br />
layers (Figures 7 and 11). At every locality where rock<br />
containing gypsum comes into contact with fresh water,<br />
dissolution may occur (Photo 9).<br />
As a matter of fact, it may seem rather surprising that the<br />
water of the Wabi Shebelle has a low salinity, flowing for<br />
such a long distance through gypsiferous rock. This is due to<br />
Solution rate of surface (m/year)<br />
Kd Dissolution rate (m/s)<br />
Cs Solubility (kg/m3)<br />
Flow rate (m/s)<br />
Temperature (ºC)<br />
Type of rock<br />
Rock Salt (NaCl) 10 0.05 360 0.3x10 -5 16.2<br />
Limestone (CaCO 3) 10 0.05 0.015 0.4x10 -5 7x10 -4<br />
Gypsum (CaSO 4 .2H 2 O) 10 0.05 2.5 0.2x10 -5 0.068<br />
same 23 0.5 2.5 4x10 -5 1.36<br />
Gypsum with NaCl<br />
dissolved in water<br />
10 0.05 10 0.2x10 -5 0.27<br />
same 23 0.5 10 4x10 -5 5.44<br />
The dissolution rate increases with increasing temperature,<br />
flow rate, sodium chloride content of the dissolving water<br />
and with decreasing grain size of the soluble grains (i.e. increasing<br />
contact area). James & Lupton (1978) have determined<br />
the dependence of dissolution rate on these parameters,<br />
which allows us to make estimates of dissolution rates.<br />
Photo 9 Collapse of a slope along the river bank in gypsiferous rock.<br />
Dissolution is clearly an element determining the stability of the slopes.<br />
With respect to problems of dissolution in the foundation<br />
rock or soil of hydraulic structures, it is important to realise<br />
that the exact location where dissolution may take place is<br />
depending highly on the subsurface geology and especially<br />
on the specific flow paths the groundwater follows in the<br />
subsurface. Prediction of dissolution rates and quantities<br />
<strong>Dam</strong> <strong>edition</strong> | Double Issue 2007/2008 | 33
Ingeokring <strong>News</strong><strong>letter</strong><br />
therefore depends on the (hydro)-geological model used<br />
and thus on the quality of the basic data gathered from the<br />
subsurface (boreholes, samples, in-situ test results).<br />
8.1 Analysis of foundation diversion dam<br />
Three possibilities were presented for the dam foundation<br />
during the site investigation of diversion dam site II: 1) foundation<br />
on gypsiferous rock with a grouting curtain; 2) foundation<br />
on gypsiferous rock with a blanket; and 3) foundation<br />
on stiff clay with a blanket. It was outlined that a foundation<br />
on stiff clay would give the least problems with respect to<br />
gypsum dissolution. Fortunately, a site has been found<br />
where this situation appears to exist. Figure 13 shows a simplified<br />
cross-section, and some of the parameters used in<br />
the analysis below are given in this figure. In the design the<br />
dam is thought to have a blanket upstream, made of an<br />
impermeable synthetic foil. This foil is also present under the<br />
structure itself, to protect the structure against chemical<br />
attack on the cement and concrete by the sulphate-rich<br />
groundwater.<br />
Following James & Lupton (1978), the stiff clay with gypsum<br />
grains which forms the foundation soil mass of the dam may<br />
be treated as a ‘particulate’ deposit. Two factors with respect<br />
to dissolution are important to assess:<br />
(1) The width of the dissolution zone (the distance over<br />
which the ground water is capable of dissolving gypsum);<br />
(2) The migration rate of this dissolution zone towards the<br />
structure. James & Lupton (1978) give two formulae to solve<br />
this problem:<br />
The parameters K d and C s are not exactly known at the diversion<br />
dam site. K d depends on temperature and flow velocity,<br />
but also on the sodium chloride content of the groundwater.<br />
This dependence has been studied by James & Lupton<br />
(1978), and estimates of K d can be obtained from their study.<br />
The solubility C of gypsum of the site is determined on water<br />
samples taken of the fresh water of the Wabi Shebelle and of<br />
the groundwater in the boreholes at dam site II. The solubil-<br />
ρβl0<br />
T =<br />
K C α<br />
And:<br />
d<br />
where:<br />
s<br />
Q / A<br />
u =<br />
nβl<br />
3 0 ρ / C<br />
s<br />
+1<br />
T = the characteristic time for complete dissolution (s)<br />
(1)<br />
(2)<br />
u = migration rate of the dissolution zone (m/s)<br />
ρ = density of gypsum = 2 320 kg/m 3<br />
l 0 = dimension of a gypsum particle (m)<br />
β = volume coefficient of a particle (volume = βl 03 )<br />
α = area coefficient of a particle (area =αl 02 )<br />
n = number of particles per unit volume (1/m 3 )<br />
K d = dissolution rate (m/s)<br />
C s = solubility (saturated concentration) (kg/m 3 )<br />
Q = volumetric flow rate (m 3 /s)<br />
A = flow area (m 2 )<br />
In our case the gypsum is present as grains of sand to gravel<br />
size (mostly sand size) and the volume of gypsum in the stiff<br />
clay is visually estimated from the boring samples. If we<br />
consider the gypsum grains as spheres, the volume and area<br />
coefficients become:<br />
α=π and β=1/6π (area=4πr 2 =πl 02 ; volume = 4/3 πr 3 = 1/6πl 03 ).<br />
We have now an estimate of gypsum volume. The velocity of<br />
groundwater flow under the dam can be approximated<br />
from Q/A, the flow velocity, which is the hydraulic conductivity<br />
K (m/s) times the hydraulic gradient i:<br />
Q<br />
v =<br />
A<br />
= Ki<br />
This allows us to calculate the migration rate of the dissolution<br />
zone towards the dam (Figure 13). Using the volume<br />
estimate of gypsum in the clay, equation (2) becomes:<br />
v<br />
u =<br />
vol% ρ<br />
. +1<br />
100 C<br />
With the help of the characteristic time T (equation 1) we<br />
can calculate the width of the dissolution zone (which is the<br />
distance fresh water coming in contact with gypsum can<br />
travel until it is saturated and cannot dissolve gypsum anymore):<br />
W = T.v<br />
s<br />
The parameters needed to estimate u and W for the stiff clay<br />
are volume, size, dissolution rate K d and solubility C s of the<br />
gypsum particles in the groundwater, flow velocity v (i.e. the<br />
hydraulic conductivity K of the clay), and the hydraulic gradient<br />
i (which depends on the design of the dam structure).<br />
(3)<br />
(4)<br />
(5)<br />
<strong>Dam</strong> <strong>edition</strong> | Double Issue 2007/2008 | 34
Ingeokring <strong>News</strong><strong>letter</strong><br />
ity in fresh water was 0.13 g/l of dissolved gypsum<br />
(CaSO 4 .2H 2 O) and of water from the boreholes 11.5 g/l water.<br />
That much more gypsum can dissolve in the groundwater<br />
is explained by the presence of sodium chloride in the<br />
groundwater. In the river water the sodium chloride (NaCl)<br />
content was 0.06 g/l; in the groundwater it was 10.4 g/l. This<br />
data can be compared to the literature values given in Table<br />
1.<br />
Electrical conductivity measurements, which can be done in<br />
the field using simple hand held devices, give a good indication<br />
of the salt content in water: The Wabi Shebelle water<br />
has a conductivity of 0.4 mmohs/cm; the groundwater in the<br />
alluvial clay has a value of 10.8 mmohs/cm. Using these values<br />
and Figure 10 from James & Lupton (1978) estimates of<br />
K d applicable to the situation at dam site II have been made.<br />
the flow velocity, which is determined by the hydraulic gradient<br />
and the permeability (hydraulic conductivity). In the<br />
preliminary design used for site investigation purposes at<br />
dam site II, a 75 m blanket is provided for. This would correspond<br />
to a hydraulic gradient of 0.05. The example calculation<br />
shows that the width of the dissolution zone is then<br />
0.01 m, which is migrating with a velocity of 0.01 m/year<br />
towards the dam structure. This would mean that after 100<br />
years only a 1 m wide zone would have been affected by<br />
dissolution. If we decrease the blanket length, however, also<br />
the hydraulic gradient increases. A reduction of the blanket<br />
length to 30 m will increase the migration rate (i=0.2, K=10 -6<br />
m/s; v=2x10 -7 m/s, 10% gypsum, 5 mm size, spherical;<br />
w=0.04 m, u=0.3 m/year). The dam would then be reached<br />
after 100 years.<br />
At borehole 5 a permeability of 5.4x10 -7 m/s was obtained at<br />
the boundary of stiff clay and gypsiferous marl (at a depth of<br />
8.00 m). The hydraulic gradient of a design with a blanket of<br />
75 m length (Figure 13) leads to a hydraulic gradient of 0.05.<br />
It follows that v=2.7x10 -8 m/s. Say the stiff clay has 40% gypsum<br />
grains of 5 mm diameter size, of spherical shape. Then<br />
(K d from James & Lupton (1978): 5x10 -5 m/s; C s = 10 kg/m 3 ;<br />
ρ gypsum = 2 320 kg/m 3 ):<br />
π<br />
2320. .5x10<br />
T =<br />
6<br />
-5<br />
5x10 .10. π<br />
W = T.v = 0.01m<br />
-8<br />
-3<br />
= 386.7 ×10 s<br />
2.7x10<br />
u =<br />
m/ s = 0.009m/ year<br />
2320<br />
(0.40). +1<br />
10<br />
(using equations 1, 5 and 4).<br />
The width of the dissolution zone is 1 cm and this will migrate<br />
with a rate of 1 cm/year towards the structure. These<br />
values are very low, but they are depending highly on the<br />
flow rate, and thus on the reliability of the values found for<br />
the hydraulic conductivity. To show the influence of some<br />
parameters the same calculation has been made varying the<br />
parameters. If we use for example groundwater with no<br />
NaCl, the width of the dissolution zone can become of the<br />
order of 1 m. The migration velocity of the dissolution zone<br />
remains of the order of cm per year.<br />
Apparently with the prevailing parameters the width of the<br />
dissolution zone is acceptably low, and its migration rate<br />
towards the dam too. The largest influence on the result has<br />
3<br />
Fig. 14 Concept of dissolution of unlined irrigation canal above gypsum<br />
rock.<br />
To fully rely on calculations such as above is unwarranted.<br />
Much more should be known about the distribution of hydraulic<br />
conductivity in the stiff clay and on the actual dissolution<br />
process. A continuous sample of the foundation clay<br />
has been obtained from borehole H (Figure 8) and no high<br />
permeability layers have been observed.<br />
Another important aspect to consider is how the soil behaves<br />
after the gypsum nodules and veins in it have been<br />
dissolved. What will be the change in geotechnical properties?<br />
Probably the permeability and deformability of the<br />
leached zone increases and its shear strength will decrease.<br />
Excessive differential settlement may occur, the amount of<br />
which is likely to be determined by the (irregular) distribution<br />
of gypsum in the clay.<br />
Given these uncertainties a conservative design has been<br />
adopted for the dam, with appreciable blanket length, to<br />
keep the dissolution zone far away from the dam structure.<br />
<strong>Dam</strong> <strong>edition</strong> | Double Issue 2007/2008 | 35
Ingeokring <strong>News</strong><strong>letter</strong><br />
8.2 Effects of dissolution below the canals and the irrigation<br />
area<br />
During the helicopter survey made in June 1986 it was observed<br />
that at many places where gypsum is present near<br />
the earth surface (for example near the camp site), sinkholes<br />
of varying size (0.1-3 m diameter) are present (Photos 5 and<br />
6).<br />
It may be expected that dissolution along the main canal<br />
and primary and secondary canals also could take place<br />
giving rise to leakage and surface subsidence.<br />
The situation below a canal can be analysed as follows<br />
(Figure 14, from James & Lupton (1978)):<br />
dM<br />
- = K dA(Cs<br />
- C)<br />
dt<br />
where M is the amount of gypsum dissolved at time t, A is<br />
the surface area of gypsum in contact with fresh water and C<br />
is the concentration of dissolved gypsum in the water (since<br />
this is constantly refreshed this may be taken as zero).<br />
The linear retreat of the gypsum surface below a canal may<br />
also be written as -dZ/dt (see Figure 14) and the amount of<br />
gypsum dissolved per unit of time:<br />
dM dZ<br />
- = .A.ρ<br />
dt dt<br />
Combining (6) and (7), taking C=0:<br />
dZ K d C s<br />
- =<br />
dt ρ<br />
Again K d and C s have to be estimated and depend on flow<br />
rate, temperature and concentration of sodium chloride in<br />
the groundwater.<br />
Example 1. In the case of a silt layer between massive gypsum<br />
and the canal (Figure 14):<br />
Take K d =10 -4 m/s and a low hydraulic gradient, then v~10 -5<br />
m/s. If the silt contains salts, then the groundwater may<br />
have dissolved sodium chloride (NaCl) in it and estimates of<br />
K d =5x10 -5 m/s and C s =10 kg/m 3 may apply. This gives<br />
(Equation 8):<br />
dZ -4<br />
5 × 10<br />
-<br />
- = = 2.16 × 10<br />
7<br />
dt 2320<br />
(6)<br />
(7)<br />
(8)<br />
= 6.8m / year<br />
Example 2. If no sodium chloride is present, then K d =10 -5 m/s<br />
and C s =2.5 kg/m 3 and<br />
dZ 2.5 × 10<br />
-<br />
- =<br />
= 1.08 × 10<br />
8<br />
dt 2320<br />
Example 3. If free flowing canal water is flowing directly<br />
over a gypsum rock surface, with a velocity of 0.5 m/s, then<br />
at 23 °C: K d =4x10 -5 m/s (James & Lupton, 1978). Since hardly<br />
any sodium chloride is present in Wabi Shebelle water,<br />
C s =2.5 kg/m 3 .<br />
-5<br />
-5<br />
dZ (4 × 10 ).(2.5)<br />
-<br />
- =<br />
= 4.3 × 10<br />
8<br />
dt 2320<br />
These values are high and show that protection against contact<br />
with fresh water is necessary. They also explain why<br />
sinkholes may develop rapidly in the wadis of the irrigation<br />
area during the rainy season, the only time when water is<br />
flowing over these areas. Consider a locality where silt containing<br />
some sodium chloride salts is present above gypsiferous<br />
rock (the conditions of example 1). Say a localised<br />
flow of water during the rainy period occurred for a period<br />
of two weeks, then a retreat of the underlying gypsum surface<br />
of 6.8 m/year x (2/52) = 0.26 m could occur. This is sufficient<br />
for a small sinkhole to develop (Photo 6).<br />
These calculations can be considered as examples. Comparable<br />
calculations for different rock types are shown in Table<br />
1. The calculated solution rates are regularly confirmed by<br />
observations and reported in literature (James et.al., 1981).<br />
Using actual site measurements of flow velocities and electrical<br />
conductivity measurements of the water and groundwater,<br />
these could be tailored to the real situation.<br />
8.3 Design of monitoring program<br />
= 0.34 m / year<br />
= 1.36m / year<br />
Before the actual construction starts, many data can be<br />
gathered and monitored that would aid in the refining of<br />
the prediction of dissolution behaviour of gypsiferous rocks<br />
and soils under hydraulic structures in the irrigation area.<br />
Monitoring of piezometric levels in the piezometric stations<br />
at the dam site, together with temperature and electrical<br />
conductivity measurements will give information on hydraulic<br />
conductivity and also whether there is any fluctuation of<br />
the salinity of the groundwater. Also the variation in C<br />
(solubility) over the site and in the irrigation area can be<br />
obtained this way (by similarly measuring the electrical conductivity<br />
of the groundwater in other boreholes).<br />
During and after construction it is highly advisable to monitor<br />
the groundwater, to be aware of any changes in conditions.<br />
After construction, the groundwater should be con-<br />
<strong>Dam</strong> <strong>edition</strong> | Double Issue 2007/2008 | 36
Ingeokring <strong>News</strong><strong>letter</strong><br />
trolled regularly. Any groundwater coming from the drains<br />
of the diversion dam should be saturated with gypsum. A<br />
sudden decrease (or change) in salinity (as measured by<br />
electrical conductivity) may indicate that somewhere a dissolution<br />
zone has reached the dam and a leakage zone<br />
(possibly in the blanket) should be found to prevent further<br />
damage. Any increase in the salinity of the water flowing in<br />
the canals in the irrigation area indicates that somewhere<br />
the canal water is in contact with gypsum. The location may<br />
be found by tracing increasing conductivity values and repair<br />
measures can be taken.<br />
9. Conclusion<br />
The presence of gypsum in the subsurface has serious implications<br />
for the engineering of this irrigation project. It<br />
should at all times be ensured that no undesired dissolution<br />
can take place during the engineering life of the constructions.<br />
The engineering solution envisaged at the time of<br />
design of this project in 1986 was to place synthetic impermeable<br />
foil as a blanket in front of the dam and the protective<br />
dykes. Also below the dam foil had to be placed, to protect<br />
the concrete from aggressive sulphate groundwater.<br />
And last but not least: impermeable foil should be placed at<br />
the bottom of the main canal and irrigation canals, everywhere<br />
gypsum rock is near the surface. It might also be considered<br />
to line the irrigation canals with alluvial clay to prevent<br />
contact of gypsum rock with the irrigation water.<br />
Furthermore the recommendation was made to develop a<br />
monitoring system, based on the measurement of electrical<br />
conductivity of the water in the irrigation system. Any increase<br />
in conductivity would signal the dissolution of gypsum.<br />
Epilogue<br />
After Nedeco finished the design of the irrigation works at<br />
Gode, I was of course interested to know when the construction<br />
work would start. But I did not hear much from Ethiopia.<br />
Over the years I used this interesting site investigation case<br />
in my lectures and halfway through the nineties I heard from<br />
Ethiopian students that this project was still considered to<br />
be executed, also by the new government that had taken<br />
over from the ‘Military Government of Socialist Ethiopia’. But<br />
finally I thought that the project had never come off.<br />
When Michiel Maurenbrecher asked me to write a paper on<br />
this case for the <strong>News</strong><strong>letter</strong>, I started to have a look at our<br />
new aid of the past two years: Google Earth. And then I<br />
could not believe my eyes! I definitely saw the contours of<br />
the canal starting at the location of dam site II and a pattern<br />
of irrigation canals in the West Gode region (Figure 15). I was<br />
surprised and also a bit puzzled, because things do not look<br />
right on this Google image. I do not see any green fields and<br />
also the canals do not seem to contain water…<br />
Then I started searching the internet and found bits and<br />
pieces of news. The completion of the construction of the<br />
dam in December 2001 had taken over 13 years. It appears<br />
that digging of the main canal started in 1999 and that IACO<br />
(Canada) was called in to assist with re-designing the project.<br />
Apparently one of the delaying factors during dam<br />
construction was the import of sulphate resistant cement.<br />
Fig. 15 Google Earth image of the West Gode irrigation area near Gode<br />
(Bale). Yellow scale bar is 5 km.<br />
I have not found more details on the construction. On the<br />
Google image I see no quarry development in the basalt<br />
rock, so I assume that it was chosen to build a concrete weir<br />
instead of a masonry one. To the southwest of the dam I see<br />
something like a sand and gravel pit from which the aggregate<br />
could have been derived. But all this is speculation.<br />
Apparently only the West Gode area is irrigated, which is<br />
some 7 050 hectares of land. In 2003, 350 hectares of this<br />
land were distributed to peasants. Each peasant owns about<br />
1 hectare of land.<br />
Then disaster struck on October 17, 2006. A torrential rain<br />
caused massive overflowing of the river. I have seen a map<br />
that showed that the complete 12 km width of the alluvial<br />
valley was flooded, including the irrigated agricultural area<br />
of West Gode. It is reported that high-water indicators that<br />
are used to record river levels, have been submerged by the<br />
water bursting over muddy banks and flooding more than<br />
17 000 hectares of land. The Wabi Shebelle river doubled in<br />
volume within two days. This disaster took the life of more<br />
<strong>Dam</strong> <strong>edition</strong> | Double Issue 2007/2008 | 37
Ingeokring <strong>News</strong><strong>letter</strong><br />
than 20 people and numerous cattle in the Gode area.<br />
The irrigation canal and the dam are reported to have been<br />
damaged. Today efforts are underway to repair the damage<br />
and reinstall the irrigation works. I will check Google Earth<br />
regularly to see evidence of a change...<br />
References<br />
Flores Calcano, C.E. & P. Rodrigues Alzura (1967). Problems<br />
of dissolution of gypsum in some dam sites. Bulletin of Venezuelan<br />
Society of Soil Mechanics and Foundation Engineering,<br />
July-September, pp. 75-80.<br />
James, A.N. & A.R.R. Lupton (1978). Gypsum and anhydrite in<br />
foundations of hydraulic structures. Geotechnique, 28, No. 3,<br />
pp. 249-272.<br />
James, A.N. & I.M. Kirkpatrick (1980). Design of foundations<br />
of dams containing soluble rocks and soils. Quart. J. Eng.<br />
Geol., 13, No. 3, pp. 189-198.<br />
James, A.N., A.H. Cooper & D.W. Holliday (1981). Solution of<br />
the gypsum cliff (Permian, Middle Marl) by the River Ure at<br />
Ripon Parks, North Yorkshire. Proceedings of the Yorkshire<br />
Geological Society, Part 4, 24, pp. 433-450.<br />
NWRC (National Water Resources Commission) (1972). Ethiopia-France<br />
Cooperative Program, Wabi Shebelle Survey. Part<br />
IV : Geological Survey of the Wabi Shebelle Basin, A : Maps at<br />
1:1.000.000 and 1:250.000 with explicative notes. B : Hydrological<br />
Survey of Ogaden.<br />
Ruiter, J.P. (1986). Seismic refraction survey and resistivity<br />
soundings at the original dam site. Gode Irrigation Scheme.<br />
Nedeco.<br />
<strong>Dam</strong> <strong>edition</strong> | Double Issue 2007/2008 | 38
Ingeokring <strong>News</strong><strong>letter</strong><br />
<strong>Dam</strong> <strong>edition</strong> | Double Issue 2007/2008 | 39
Ingeokring <strong>News</strong><strong>letter</strong><br />
Engineering geologist abroad<br />
Xander van Beusekom, Senior Engineering Geologist, Advanced Geomechanics<br />
From a ship, sailing south along the Northwest Shelf in Australia<br />
in some ‘mild rough weather’, it is my turn to show<br />
what it is like to be an engineering geologist abroad. But let<br />
me start with the beginning.<br />
Drilling vessel Markab.<br />
Before I ended up here in Australia I worked at Fugro for<br />
several years, during which I travelled around the world to<br />
lead offshore site investigations. Several of these travels<br />
brought me to Australia and I must say that it increased my<br />
urge to have a better look at ‘Terra Australis’ (land down<br />
under) formerly known as ‘New Holland’. Since business in<br />
both the offshore and mining industry is booming in Western<br />
Australia it wasn’t difficult to get a job and I ended up at<br />
a consultancy firm called Advanced Geomechanics. It is a<br />
relatively small company (which was a nice change coming<br />
from a multinational like Fugro) that is specialised in offshore<br />
foundations in carbonate soils.<br />
The first project I took on was one for which I did the preparations<br />
for the actual site investigation a year ago and it was<br />
my task now to work with these results. The best part was<br />
that the report was a typical engineering geological report,<br />
in this case on a pipeline shore crossing through calcarenites.<br />
A real challenge again for several reasons. First of<br />
all, I hadn’t really worked with rock since my M.Sc. thesis.<br />
Secondly, the material consisted of highly irregular cemented<br />
material, which made it almost impossible to assign<br />
useful parameters to the different formations.<br />
The other interesting aspect of the work is being a client<br />
representative on board during offshore site investigations.<br />
And as could be expected, most of the offshore work is still<br />
being executed by Fugro which makes it almost feel like<br />
home… except I am on the other side of the table now. Having<br />
been a site manager for so long is a big plus when working<br />
as a client representative. You know how the work is<br />
done, it is easy to notice when things are not going according<br />
to plan and you know if the optimum has been achieved<br />
with the available resources at the time. And it is always<br />
good to see some familiar faces. So far, I have been lucky<br />
enough to work for BP in West Papua, for Inpex in the Timor<br />
Sea and currently for Woodside on the Northwest Shelf.<br />
The offshore geotechnical world is already relatively small,<br />
but in Perth it is extremely small. This means that during the<br />
day you can have a meeting where the arguments fly back<br />
and forth over the table, and in the evening you are having a<br />
beer with that same person simply because the person is a<br />
former colleague or a good friend. Or you can be at a party<br />
having a drink with your direct competitor, while the two<br />
major contractors for offshore work are doing exactly the<br />
same thing. All in all a very pleasant atmosphere to work in.<br />
It is just a matter of separating business and pleasure.<br />
Drilling vessel Mariner.<br />
But of course work is not the only reason I have chosen<br />
Perth. I wanted to see something of the country as well. The<br />
first thing to realise is that Perth is the most remote city of<br />
the world. The closest city is Adelaide, which is a trip of approximately<br />
2 500 km. Even though the amount of people<br />
living there is well over a million, it still feels like a village. I<br />
have already been able to drive down from Darwin to Perth<br />
several years ago, but there were 2 things still high upon my<br />
wish list: The Kimberley and Uluru in the Red Centre. By the<br />
time I got back from my job in West Papua in January, it was<br />
<strong>Dam</strong> <strong>edition</strong> | Double Issue 2007/2008 | 40
Ingeokring <strong>News</strong><strong>letter</strong><br />
Great Central Highway.<br />
not really possible to go to The Kimberley because of the<br />
wet season. So the choice was easily made to head for the<br />
Red Centre.<br />
During this trip, my mate and I travelled for almost 8 000 km<br />
(of which 2 000 on dirt road) plus 72 km on a tow truck to<br />
get back to civilisation. This allowed us to see the Super Pit<br />
(biggest open pit goldmine in the world), camels, emus,<br />
Uluru (Ayers Rock), where we towed aboriginals back to<br />
their community, have seen sunset and sunrise at Uluru and<br />
the sunset at Kata Tjuta. I swam in a water hole in Kings Canyon,<br />
camped underground in Coober Pedi (opal capital of<br />
the world), tried the ‘wichelroede’, made a scenic flight<br />
above Wilpena Pound in the Flinders Ranges and visited<br />
Adelaide. We watched the Admirals Arch and the Remarkable<br />
Rocks on Kangaroo Island, where we also got a very<br />
close look at Australian sea lions, New Zealand fur seals,<br />
possums, wallabies and koalas. We crossed the Nullarbor (a<br />
road of 2 000 km with hardly any sidetracks), watched dolphins<br />
at Esperance during a boat trip and had a look at<br />
Wave Rock on the way back.<br />
All in a 3 weeks journey where the temperature ranged between<br />
20 degrees at the coast up to 45 degrees in the Red<br />
Centre. And I can assure you that 20 degrees feels bloody<br />
cold if you just got out of 45 degrees!<br />
And apart from all this: the fantastic weather in Perth, the<br />
beautiful beaches and the wineries nearby. All in all not a<br />
bad place to live.<br />
Uluru (Ayers Rock).<br />
<strong>Dam</strong> <strong>edition</strong> | Double Issue 2007/2008 | 41
Ingeokring <strong>News</strong><strong>letter</strong><br />
Estimating ‘efficiency-permeability’ of upstream cut-off membranes<br />
for dams<br />
Michiel Maurenbrecher, Delft University of Technology, Section Geo-Engineering<br />
Introduction<br />
Thirty years ago I claimed the British had made a Dutchman<br />
out of me. The last project I was involved with was designing<br />
flood defences along the north bank of the Thames downstream<br />
from the Thames barrier. The firm of consulting engineers,<br />
called Binnie & Partners (they later amalgamated with<br />
Black & Veatch, American consultants by which name they<br />
are now known), were prominent in the field of water works,<br />
sewerage and water storage. A few years back I wrote an<br />
article in the Ingeokring <strong>News</strong><strong>letter</strong> about the river Thame,<br />
the dirtiest river of England, which was another project I was<br />
then involved with during my three years with Binnie & Partners.<br />
One task I was asked to perform was to look at the effectiveness<br />
of upstream membrane cut-offs on earth and rock fill<br />
dams as a design study for a proposed dam at Romsley, near<br />
Birmingham. Traditionally such dams have an internal clay<br />
core. Much of the literature I examined on the subject came<br />
from ICOLD (International Commission on Large <strong>Dam</strong>s) congresses.<br />
Part of the data that was obtained and is referring to<br />
reinforced concrete upstream membranes, is summarised in<br />
Table 1 (the original table for the design study contained<br />
data on 24 dams and included asphalt as well as reinforced<br />
concrete membranes). Data was provided on membrane<br />
thicknesses, height of reservoir levels and leakage. To make<br />
a comparison with regard to their ‘efficiency’ there was a<br />
problem to reduce this data to a more meaningful comparison.<br />
This would be the ‘permeability’ of the membrane.<br />
There were high narrow dams and wide lower dams of similar<br />
membrane design giving different leakages. Two dams<br />
with comparable membranes were the Salt Springs <strong>Dam</strong> in<br />
California and the Paradela <strong>Dam</strong> in Portugal. Both dams had<br />
similar concrete membranes which were thick and narrow in<br />
width at the toe and thinned and widened towards the crest<br />
of the dam to, more or less, resist the high hydraulic head at<br />
the toe and the low hydraulic head at the crest. The literature<br />
stated that the Paradela <strong>Dam</strong> membrane was based on<br />
the design of the Salt Springs <strong>Dam</strong>. Of interest was the Salt<br />
Springs <strong>Dam</strong>’s significant drop in leakage with a partially<br />
filled reservoir. The analysis presented below shows this did<br />
not result from an increase of overall membrane permeability<br />
as it was thought that the higher hydraulic pressures may<br />
influence the opening of concrete construction joints.<br />
Analysis: derivation of a leakage equation for a variable<br />
membrane<br />
The analysis adapts Darcy's equation for flow through an<br />
upstream triangular membrane with a linearly variable thickness.<br />
The method assumes that there is a full potential drop<br />
in water head across the membrane which is reasonable if<br />
the permeability of the filter and rock fill beneath the membrane<br />
is of several orders greater than that of the membrane.<br />
Hence, to calculate the permeability of the membrane<br />
the measured flow at the downstream toe of the dam<br />
is assumed only to have passed through the membrane. The<br />
literature did not seem to provide a method for solving for<br />
‘k’. Width, thickness and hydraulic head could be easily related<br />
with a linear equation with height. Hence, by integrating<br />
the leakage across a horizontal strip of membrane δh<br />
high at depth h having a surface area δA=wδh where w=f(h)<br />
and having a hydraulic gradient h/τ where τ is the thickness<br />
of the membrane at depth h, and τ=f(h). Leakage through a<br />
strip δh at depth h is from Darcy’s equation q=k(hγ/τ)wδh.<br />
This expression is then integrated over the height and width<br />
of the upstream membrane, the solution for this is provided<br />
in Figure 1 and the equation box.<br />
This was then used to estimate the ‘efficiencypermeabilities’<br />
for a number of dams from which remarkably<br />
the Paradela <strong>Dam</strong> (after repairs!) and the two lake levels at<br />
Salt Springs <strong>Dam</strong> gave very similar values. The lower<br />
‘efficiency-permeabilities’ at the other dams reflect improved<br />
membrane design. A web search today reveals both<br />
Paradela and Salt Springs dams required repairs to their<br />
membranes and that Cethana <strong>Dam</strong>, also of similar design<br />
but an order of permeability less than the first two dams,<br />
had performed consistently well.<br />
Figure 1 shows the model used for the analysis to which<br />
Equation Box 1 refers. The derivation first assumes that the<br />
width at the base of the dam is W B =0. The width at reservoir<br />
level is taken as W T . This results in equation 1 in the equation<br />
box. Allowing for a finite width at the base of the dam W B ,<br />
results in equation 2 where r=1-W B /W T . Equations 1 and 2<br />
are then used to determine k based on the leakage and geometrical<br />
data of the dams. The results are given in Table 1.<br />
Figures 2 and 3 are taken from websites showing how the<br />
dams appear today.<br />
<strong>Dam</strong> <strong>edition</strong> | Double Issue 2007/2008 | 42
Ingeokring <strong>News</strong><strong>letter</strong><br />
A<br />
WT<br />
h<br />
δh<br />
H-h<br />
WT-(h/H)(WT-WB)<br />
WB<br />
h<br />
δh<br />
H-h<br />
α<br />
b<br />
τ = ah+b<br />
A’<br />
Front (upstream) elevation<br />
Side elevation (cross-section A-A’)<br />
w = W T[1-(h/H)(1 -W B/W T )]=W T [1-rh/H]<br />
r = 1-WB/W T<br />
Fig. 1 Model used to solve for overall membrane permeability k.<br />
Fig. 2 Paradela <strong>Dam</strong>, Northeast Portugal (source: cnpgb.inag.pt/<br />
gr_barragens/gbingles/ParadelaIng.htm).<br />
Fig. 3 Salt Springs <strong>Dam</strong>, central California (source: concise.britannica.com/ebc/art-73277/Salt-Springs-<strong>Dam</strong>-a-rock-dam-ison-the-North).<br />
Table 1 ‘Efficiency-permeability’ of dams with upstream reinforced concrete membrane cut-offs.<br />
<strong>Dam</strong><br />
Height<br />
[m]<br />
Crest<br />
length<br />
[m]<br />
Slope<br />
(upstream/<br />
down-<br />
Geology<br />
Fill<br />
Type membrane/<br />
foundation cut-off<br />
Membrane<br />
Thickness [m]<br />
Crest<br />
Base<br />
Leakage<br />
[l/s]<br />
Permeability,<br />
k [m/s] 1<br />
Cethana (Tasmania,<br />
110 213 1.3/1.3 Quartzite<br />
1971) A<br />
Rock, compacted<br />
Reinforced concrete<br />
(RC)/8 m grout curtain<br />
0.3 0.6 35 2x10 -8<br />
Paradela (Portugal,<br />
110 525 1.3<br />
1957) B<br />
Granite, weathered<br />
Rock, sluice<br />
dumped<br />
RC/30 m grout curtain 0.3 1.1 3020/315 2 1.3x10 -7<br />
Salt Springs<br />
100 396 1.3/1.4 Granite, sound<br />
(California, 1931) C<br />
Rock, sluice<br />
dumped<br />
RC/1.5 m wide 1 to 6 m<br />
deep trench & 15 m deep<br />
0.3 1.1 113/556 3 2x10 -7 /3x10 -7<br />
Lower Bear 1 75 293 1.3/1.4 Granite, massive RC/no information 0.3-0.75 0.6 57 4.7x10 -8<br />
Lower Bear 2<br />
46 264 1.0/1.3 Granite, massive 0.3 0.6<br />
(California, 1952) C<br />
Vilar (Portugal) B 55 210 1.1/1.3 Granite and Rock, sluice RC/no information 0.3 0.6 130 7.4x10 -8<br />
Quioch (Scotland,<br />
38 320 1.3/1.4 Rock, sound<br />
1955) D<br />
Rock, rolled<br />
sluiced<br />
RC/2 m concrete wall & 12<br />
m grout curtain<br />
0.3 22 5x10 -8<br />
La Sassiere (France,<br />
30 300 1.4/1.4 Moraine Rock, dumped<br />
1959) E<br />
RC/2m wide, more than<br />
15 m deep grout curtain<br />
0.35 12 5.4x10 -8<br />
1<br />
Value for k is back-calculated; 2 Before/after repair; 3 partly filled/full reservoir<br />
A<br />
Wilkins (1973); B Da Palma Carlos, et al. (1973); C Steele & Cooke (1958, 1969); D Roberts (1958); E Destenay & Lemay (1961)<br />
<strong>Dam</strong> <strong>edition</strong> | Double Issue 2007/2008 | 43
Ingeokring <strong>News</strong><strong>letter</strong><br />
Equation Box 1 Derivation of equations used to solve for dam upstream membrane permeability.<br />
Darcy'<br />
s equation : δq = k.i. δA<br />
h<br />
h<br />
δA= (W T - ( WT<br />
) × δh<br />
cosec α , i = =<br />
H<br />
τ<br />
where a = tan β / sinα<br />
substituting for i and δA<br />
k WT<br />
( H − h)<br />
cosec α h<br />
δq =<br />
. × δh<br />
H a h + b<br />
k WT<br />
cosec α h (H - h) δh<br />
δq =<br />
.<br />
H a h + b<br />
Q<br />
∫<br />
0<br />
dq<br />
=<br />
put ah + b = τ , h =<br />
Q<br />
∫<br />
0<br />
K<br />
dq<br />
=<br />
3<br />
a<br />
K ⎡<br />
Q = (<br />
3 ⎢ a<br />
a ⎣<br />
( τ − b)<br />
/ a,<br />
2<br />
(Ha(<br />
τ − b)<br />
- ( τ − b)<br />
) K<br />
.<br />
dτ<br />
=<br />
3<br />
τ<br />
a<br />
2<br />
K ⎡⎛<br />
τ<br />
2<br />
⎞ ⎤<br />
Q = ( 2 ) ( ) ln<br />
3 ⎢<br />
⎜ Ha + b τ − − Hab + b τ + C ⎥<br />
⎣<br />
2<br />
⎟<br />
a ⎝<br />
⎠ ⎦<br />
K ⎡⎛<br />
( ah + b)<br />
Q = ( 2 )( )<br />
3 ⎢<br />
⎜ Ha + b ah + b −<br />
a ⎣⎝<br />
2<br />
K<br />
Q =<br />
3<br />
2<br />
a<br />
Q<br />
3 2 2<br />
1 2 2<br />
2<br />
[( [( Hab + b + h(<br />
a H + ba)<br />
− a h − ( abH + b )[ln( aH + b)<br />
+ C)<br />
]<br />
2<br />
a<br />
H + ba)<br />
h − h<br />
2<br />
dh<br />
adh<br />
= dτ<br />
,<br />
dτ<br />
dh<br />
=<br />
a<br />
− ( Hab + b<br />
2<br />
2<br />
⎡⎛<br />
H Hb ⎞ ⎛ bH b ⎞<br />
⎤<br />
= K ⎢<br />
⎜ +<br />
( ln( ) ln( ))<br />
2<br />
2 3<br />
⎥<br />
⎣ 2<br />
⎟ −<br />
⎜ +<br />
⎟ aH + b − b<br />
⎝ a a ⎠ ⎝ a a ⎠<br />
⎦<br />
⎡ H b b ⎛ b ⎞ ⎛ aH + b ⎞<br />
= kW cosecα<br />
+ − 1 + ln<br />
⎡ ( Hab + b<br />
. ⎢( Ha + 2b)<br />
−τ<br />
-<br />
⎣<br />
τ<br />
⎞ ⎤<br />
) ln( ah + b)<br />
+ C<br />
⎟ ⎥<br />
⎠ ⎦<br />
) ⎤<br />
⎥dτ<br />
⎦<br />
where C'<br />
= C + Hab +<br />
⎤<br />
Q<br />
T ⎢<br />
(1)<br />
2 2<br />
⎜ ⎟ ⎜ ⎟<br />
2<br />
⎥<br />
⎣ a a a ⎝ Ha ⎠ ⎝ b ⎠ ⎦<br />
for a triangular (front elevation) dam<br />
⎡ H b b ⎛ b ⎞ ⎛ aH + b ⎞⎤<br />
⎛ WB<br />
⎞<br />
Qr<br />
= kWT<br />
cos ecα<br />
⎢ + r 1 ln where 1<br />
(2)<br />
2 −<br />
2<br />
⎜ + r ⎟ ⎜ ⎟ =<br />
2<br />
⎥ r<br />
⎜ −<br />
⎟<br />
⎣ a a a ⎝ Ha ⎠ ⎝ b ⎠⎦<br />
⎝ WT<br />
⎠<br />
W = is the width at the base of the dam for a trapezium shape (see figure 1front elevation).<br />
B<br />
H<br />
∫<br />
0<br />
k WT<br />
cosec α<br />
.<br />
H<br />
H<br />
∫<br />
0<br />
2<br />
h (H - h)<br />
a h + b<br />
2<br />
2<br />
2<br />
h<br />
ah + b<br />
2<br />
/<br />
⎤<br />
− ( abH + b ) ln( ah + b)<br />
+ C ⎥<br />
⎦<br />
H<br />
∫<br />
0<br />
H<br />
0<br />
2<br />
H<br />
0<br />
H<br />
0<br />
2<br />
H<br />
0<br />
3<br />
2<br />
b<br />
2<br />
References<br />
Destenay, J. & Y. Lemay (1961). Les masques d'etancheite<br />
des barrages en enrochements construits par electricité de<br />
France. Proceedings 7th ICOLD Congress, Rome, Vol. IV, p.129.<br />
Palma Carlos, A. da, et al. (1973). Behaviour of the Portuguese<br />
concrete face rockfill dams. Proceedings 11th ICOLD<br />
Congress, Madrid, Vol. IV, p. 1045.<br />
Roberts, C. M. (1958). The Quoich rockfill dam. Proceedings<br />
6th ICOLD Congress, New York, Vol. III, p. 101.<br />
Steele, I. C. & J.B. Cooke (1958). Rockfill dams: Salt Springs<br />
and Lower Bear river concrete face dams. Proceedings Symposium<br />
on Rockfill <strong>Dam</strong>s, ASCE Proc. Symp. Series No. 3, paper<br />
1 737.<br />
Steele, I. C. & Cooke, J.B. (1969). Concrete face rockfill dams,<br />
Section 19. Handbook of Applied Hydraulics (3rd <strong>edition</strong>).<br />
McGraw HilI Book Company.<br />
Wilkins, J. K. (1973). The design of Cethana concrete face<br />
rockfill dam. Proceedings 11th ICOLD Congress, Madrid, Vol.<br />
III, p.25.<br />
<strong>Dam</strong> <strong>edition</strong> | Double Issue 2007/2008 | 44
Ingeokring <strong>News</strong><strong>letter</strong><br />
Review of the 10th IAEG Congress, September 2006,<br />
Nottingham (UK)<br />
Leon van Paassen<br />
From September 6-11, 2006 the 10th Congress of the International<br />
Association for Engineering Geology and the environment<br />
(IAEG) was organised in Nottingham, United Kingdom.<br />
Hosted by the UK branch of the IAEG, the Engineering<br />
Group of the Geological Society of London, the conference<br />
was attended by more than 400 participants, of which 11<br />
from our Dutch division Ingeokring, and some 800 abstracts<br />
were received from all over the world.<br />
Part of the Dutch delegation to Nottingham. From left to right: Robrecht<br />
Schmitz, Michiel Maurenbrecher, Niek Rengers, Robert Vuurens<br />
and Leon van Paassen.<br />
quote and write papers for the bulletin. Finally the location<br />
of the IAEG conference for 2010 was chosen to be Auckland,<br />
New Zealand. For more details on these IAEG issues go to<br />
the website www.iaeg.info.<br />
Next day the conference started with an opening lecture by<br />
John Burland, giving an overview of the current status of<br />
Geotechnical Engineering (as a merge of engineering geology,<br />
soil mechanics and rock mechanics) and emphasising<br />
the necessity of theoretical models, laboratory experiments<br />
and practical case histories to make predictions about future<br />
behaviour. The next 4 days many papers were presented in 3<br />
parallel sessions and all technical committees organised<br />
their yearly meetings. Meanwhile continuous poster sessions<br />
prevented boredom and gave opportunity for discussions.<br />
Some of my personal highlights were presentations<br />
about using rock models to predict the behaviour of ancient<br />
historical buildings in Rome and the design of a new metro<br />
in Napoli, TC meetings on building stones and historical<br />
monuments and presentation of an upcoming publication<br />
on deserts and a youth forum. The main goal of each conference:<br />
to gain new ideas, meet old friends and make new<br />
ones, was very well established during this one. Especially<br />
the conference dinner and final day of field excursions<br />
added to the already good atmosphere.<br />
On the first day of the conference the yearly IAEG council<br />
meeting was held, presided by Niek Rengers, honorary<br />
member of Ingeokring. During this meeting the IAEG executive<br />
committee presented their yearly reports on activities<br />
and finances and all the technical committees of IAEG and<br />
joint technical committees of IAEG, ISRM, ISSMGE gave an<br />
overview of their current activities. The new IAEG president,<br />
Fred Baynes, was elected together with 7 new regional vicepresidents.<br />
A proposal by the presidents of IAEG, ISRM and ISSMGE to<br />
found a Federation of International Geo-Engineering Societies<br />
(FIGS), was supported by a narrow majority of council<br />
members. The objective of FIGS is to raise awareness for the<br />
Geo-engineering profession and coordinate activities in<br />
overlapping interests between the members of the federation.<br />
Brian Hawkins, editor of the IAEG bulletin, showed<br />
some nice quoting statistics and encouraged all members to<br />
Summit of Mam Tor on the left forms the back scarp of a major<br />
landslide (bottom right) containing 3.2 Mm 3 of sliding material, which<br />
started sliding 300 to 400 years ago and still continues to slide at an<br />
average rate of 100 mm/year.<br />
<strong>Dam</strong> <strong>edition</strong> | Double Issue 2007/2008 | 45
Ingeokring <strong>News</strong><strong>letter</strong><br />
climb to the summit. Apart from the nice scenery we got<br />
detailed information about the local geology and geoengineering<br />
features. After additional visits to the caves of<br />
Nottingham and Sherwood Forest and a drink with a part of<br />
the Dutch conference delegation at Nottingham Castle it<br />
was time to go back home fully inspired to continue our<br />
ordinary jobs.<br />
So continue writing papers for both the Ingeokring <strong>News</strong><strong>letter</strong><br />
and IAEG Bulletin, become a member of IAEG and join<br />
one of the technical committees and I’ll see you in Auckland<br />
in 2010.<br />
Road damage on the Mam Tor landslide.<br />
One European field trip was organised to see several tunnelling<br />
projects in the Alps and three field trips were made in<br />
the UK, one of them visiting the highlights of the Peak district:<br />
limestones, shales and sandstones near Castleton and<br />
the major landslide on the slopes of Mam Tor, including a<br />
<strong>Dam</strong> <strong>edition</strong> | Double Issue 2007/2008 | 46
Ingeokring <strong>News</strong><strong>letter</strong><br />
Piping phenomenon in earth dams: case histories<br />
R. Vázquez Ballona, Senior Advisor, National Enterprise for Applied Research, Havana City, Cuba<br />
M. Alvarez Grima, Project Manager, MTI Holland, Kinderdijk, The Netherlands<br />
Introduction<br />
This paper reviews the main factors that caused piping in<br />
five earth dams built in Cuba in the late 1980’s. As a common<br />
geological feature we can mention that the dams were<br />
built in alluvial basins consisting of bedded granular particles.<br />
These soils are characterised by a high permeability. In<br />
the situation where the continuity of the layers under the<br />
dam foundation is extended downstream, the likelihood of<br />
occurrence of piping is very high.<br />
Fig. 1 Piping phenomenon: transport of fine soil (fine sand) amongst<br />
coarse particles (gravel).<br />
of the pore water which is higher than in ordinary soils. Dispersive<br />
soils usually have a high exchangeable sodium content.<br />
They rapidly erode, forming tunnels by a process in<br />
which the clay particles go into suspension in slow moving<br />
water (colloidal erosion) damaging earth dams. This type of<br />
piping is often called chemical piping.<br />
Piping mechanics and identification<br />
Piping occurs when water seeps through the soil and tends<br />
to transport the soil particles with it. This generally occurs<br />
when the pore sizes are larger than the soil particles (Figure<br />
1). This phenomenon occurs in sites composed of soils characterised<br />
by a high permeability. As a consequence, a<br />
change of water flow rate occurs and the piping process<br />
commences, giving rise to an outcrop of water seepage. As a<br />
result of this, the finest soil particles are washed away with<br />
the water flow. The diameter and the depth of the resulting<br />
hole will enlarge in time, bringing into existence the piping<br />
through which the reservoir and lower dam slope toe are<br />
connected (Figure 2).<br />
In the five historical cases analysed, piping took place in the<br />
dam foundations and not in the embankments. The principal<br />
reason is that dam embankments are made from selected<br />
materials which are subjected to rigorous compaction<br />
and control tests whereas dam foundations are dictated by<br />
Mother Nature.<br />
Designed flow path<br />
Permeable foundation<br />
H<br />
It was noticed that the position of the dam axis contributed<br />
considerably to the occurrence and acceleration of the piping<br />
process. In some cases piping might have been avoided<br />
by making a better selection of the dam axis location.<br />
The distribution of continuous and permeable layers beneath<br />
the dam foundations which connected the reservoir<br />
with areas downstream was a common feature as well. In<br />
most of the projects the selection of dam axis was based not<br />
only on geological and geotechnical considerations, but also<br />
on economical aspects such as the transportation distance<br />
of suitable borrow materials for the construction of the embankments.<br />
Piping occurred in sandy gravels. It is worth mentioning,<br />
however, that piping can also take place in dispersive soils.<br />
These soils are characterised by a dissolved sodium content<br />
Actual flow path<br />
Fig. 2 Schematic representation of seepage under dam foundation<br />
causing piping.<br />
Piping can occur along a spillway and other conduits<br />
through the embankment. Sinkholes that develop on the<br />
embankment are signs that piping has commenced. A whirlpool<br />
in the reservoir surface may soon follow and then likely<br />
a rapid and complete failure of the dam. Emergency procedures,<br />
including downstream evacuation, must be rapidly<br />
implemented if this condition is observed.<br />
The failure can be shown as a sudden raising of the foundation<br />
at the apron of the embankment. This undermining is<br />
generally caused by a gradual increase of piping, and it can<br />
lead to the appearance of ruptures such as longitudinal and<br />
transversal cracks on the embankment (Figures 3 and 4). The<br />
<strong>Dam</strong> <strong>edition</strong> | Double Issue 2007/2008 | 47
Ingeokring <strong>News</strong><strong>letter</strong><br />
most dangerous ruptures are transversal cracks, in as much<br />
as if they appear on the same level with the banked-up water<br />
level, a new outlet of reservoir water starts to form, and it<br />
could lead to a complete catastrophic failure.<br />
By analysing the geological site conditions of the dams, it<br />
was observed that the affected dike stretch was founded on<br />
permeable alluvial deposits consisting of heterogeneous soil<br />
with continuous horizontal stratification. This caused a natural<br />
path beneath the dike between upstream and downstream.<br />
Seepage took place as a result of the existing hydraulic<br />
gradient (i). Table 1 lists the values of the actual critical<br />
gradient of the five dams analysed.<br />
i=ΔH/L<br />
ΔH = difference between reservoir and downstream water<br />
levels<br />
L = water running length from reservoir to water outlet<br />
lower dam<br />
Fig. 3 Longitudinal view of dam axis.<br />
Seepage can cause slope failure by creating an increase in<br />
water pressure or by saturating the slope. The pressure of<br />
seepage within an embankment is difficult to determine<br />
without proper instrumentation. A slope which becomes<br />
saturated and develops slides may be showing signs of excessive<br />
seepage pressure.<br />
Table 1 Critical hydraulic gradient.<br />
Earth dam<br />
Hydraulic load Water running<br />
(ΔH), [m]<br />
length (L), [m]<br />
Critical gradient (i)<br />
Case A 3.2 45 0.07<br />
Case B 6.0 60 0.10<br />
Case C 15.0 115 0.13<br />
Case D 20.0 150 0.13<br />
Case E 18.0 300 0.06<br />
Engineering geological properties of investigated piped<br />
soils<br />
Properties of the piped soils in the five dams were analysed.<br />
In all cases the soil consisted mainly of non-cohesive granular<br />
particles: fine and medium sand (Figure 5). They had a<br />
vertical permeability of K=0.5-10 m/day. The horizontal permeability<br />
varied between 5-50 m/day. In fact, this is characteristic<br />
for Cuban alluvial terraces where the dams were<br />
built.<br />
It can be seen in Table 1 that the piped soils have a critical<br />
hydraulic gradient smaller than 0.15, with an average value<br />
of about 0.10. Table 2 lists the smallest values found in the<br />
literature at that time, these values were used in the design<br />
of the dams as an admissible gradient to prevent piping.<br />
Table 2 Admissible hydraulic gradient used in the designs.<br />
Type of soil<br />
Admissible gradient<br />
Clay 1.20<br />
Sandy clay 0.65<br />
Gravelly sand 0.45<br />
Medium sand 0.38<br />
Fine sand 0.29<br />
Observations and analysis<br />
Fig. 4 Transversal crack created on dam axis.<br />
The engineering properties analysed in the piped soils were:<br />
grain size distribution, hydraulic conductivity, admissible<br />
hydraulic gradient, critical gradient, and geological and engineering/geotechnical<br />
conditions of the sites.<br />
<strong>Dam</strong> <strong>edition</strong> | Double Issue 2007/2008 | 48
Ingeokring <strong>News</strong><strong>letter</strong><br />
The analysis of the results revealed that the piped soils had<br />
more than 50% of granular particles and the transported<br />
particles consisted mainly of fine and medium sand (Figure<br />
5). Moreover, we could verify that for the piped soils with a<br />
low value of hydraulic load (ΔH=3-6 m) and a low hydraulic<br />
gradient (i=0.06-0.13) piping can occur; provided that<br />
granular layers are laying underneath the dam foundation.<br />
The presence of fine particles (0.2-2.0 mm) in large amounts<br />
can also be an indicator for the possible occurrence of piping<br />
based on the grain size distribution of the piped soils.<br />
Percentage passing [%]<br />
0.02 0.06<br />
0.2<br />
0.6<br />
2<br />
6<br />
20<br />
60<br />
100<br />
0<br />
90<br />
10<br />
80<br />
20<br />
70<br />
30<br />
60<br />
40<br />
50<br />
50<br />
40<br />
60<br />
30<br />
70<br />
Percentage retained [%]<br />
Also permeable layers beneath the foundations were not cut<br />
up totally. In case B piping took place at low water level in<br />
the reservoir (about 5 m below the normal water level). Also<br />
we could observe clearly the tunnels created by the piping<br />
mechanism. The diameter of the tunnels observed varied<br />
between 15 cm and 35 cm. Also the presence of flow of fine<br />
sand was observed.<br />
Besides the above mentioned aspects, it can be said that<br />
some geological and geotechnical conditions contributed to<br />
the occurrence of the piping phenomenon too: dam location<br />
(axis) in meander zones and location of concrete structures<br />
on permeable sandy layers laying parallel to the underground<br />
water flow. Also preventive measures were not totally<br />
completed before the filling of the reservoir. Table 3<br />
summarises the main factors that caused soil piping.<br />
20<br />
10<br />
80<br />
90<br />
0<br />
100<br />
0.01 0.1 1 10 100<br />
Particle size [mm]<br />
Fig. 5 Grain size distribution range of piped soils.<br />
We could observe that for these soils the assumed design<br />
values for admissible gradient were generally ranging between<br />
0.20 and 0.40 and they were based on experience and<br />
scarce data available from literature at that time (Table 2).<br />
Despite of the fact that the designers took into consideration<br />
some preventive measures to reduce seepage underneath<br />
the dams, in practice these measures were not effective<br />
at all. Some of them were incomplete or inefficient, resulting<br />
in locally high seepage through the foundation. The<br />
use of sheet piles did not avoid high seepage, as it was<br />
thought.<br />
Table 3 Main factors that caused piping.<br />
<strong>Dam</strong>s Factors<br />
Case A Sandy layer cut by steel pile, but laying on fissured limestone<br />
Considerations about some measures taken against piping<br />
The main considerations are as follows:<br />
• Drainage structure with an inverted filter acts as pore<br />
water pressure dissipater. However, it does not avoid<br />
seepage, which is considered high in permeable foundations.<br />
This measure might be feasible when the dam<br />
foundation is less granular and when the soil permeability<br />
is not too high.<br />
• An apron or a partial cut-off (or a combination of both)<br />
lowers the hydraulic gradient since the water running<br />
path is enlarged. It was found that in practice this measure<br />
was not totally effective.<br />
• Grout curtains made from cement and bentonite are<br />
effective when the soil porosity allows it, but requires<br />
finishing 3 to 4 profiles before the reservoir is filled up,<br />
avoiding in this way seepage concentration at the middle<br />
stretches. This measure requires time and control<br />
measures while it is executed.<br />
Case B<br />
Case C<br />
Case D<br />
The impervious cut-off did not cut up the sandy layer at affected<br />
zone<br />
Reinforced concrete structure placed (water in-take) on granular<br />
layers, with impervious apron and drainage structure, but<br />
design critical gradient 0.25 compared to 0.13 (the actual<br />
gradient measured)<br />
Grout curtain made from cement in granular foundation, but<br />
reservoir was filled before grout curtain was finished, seepage<br />
was concentrated in affected stretches<br />
• Soil-cement walls built by means of a trench or sheet<br />
piling together with pouring of blended bentonitecement<br />
is considered a safe measure when permeable<br />
layers are cut.<br />
Case E<br />
Deep impervious layer was not cut up with steel piles used.<br />
However, in the zone where bentonite mix was applied, there<br />
was no problem<br />
<strong>Dam</strong> <strong>edition</strong> | Double Issue 2007/2008 | 49
Ingeokring <strong>News</strong><strong>letter</strong><br />
Concluding remarks<br />
• In the five analysed dams we could corroborate that the<br />
admissible gradient reported in the literature at that<br />
time was not safe.<br />
• Piping took place in permeable foundations consisting<br />
of fine and medium sand having a high permeability.<br />
Hydraulic Resources Secretaryship, Engineering Institute,<br />
UNAM (1976). Behaviour of <strong>Dam</strong>s in México. University City,<br />
Mexico City.<br />
Sherard, J.L., R.J. Woodward, S.F. Gizienski & W.K. Clevenger<br />
(1963). Earth and Earth-Rock <strong>Dam</strong>s. John Wiley & Sons Inc.,<br />
New York.<br />
U.S. Bureau of Reclamation (1967). Small <strong>Dam</strong> Design. Translated<br />
into Spanish by C.E.C., Mexico City.<br />
Literature<br />
Armas Novoa, R. & E. Horta Mestas (1987). Earth <strong>Dam</strong>s. Polytechnic<br />
Higher Institute (ISPJAE), Havana, Cuba.<br />
Marsal, R.J. & D. Reséndiz (1975). Rockfill <strong>Dam</strong>s. Limusa Editorial,<br />
Mexico City.<br />
<strong>Dam</strong> <strong>edition</strong> | Double Issue 2007/2008 | 50
Ingeokring <strong>News</strong><strong>letter</strong><br />
The activities of the Netherlands’ National Committee on Large<br />
<strong>Dam</strong>s (NETHCOLD)<br />
Ir. J. van Duivendijk, NETHCOLD Chairman<br />
In this article, a short description is given of the aims of the<br />
International Commission on Large <strong>Dam</strong>s (ICOLD) and those<br />
of its member representing The Netherlands, the Netherlands’<br />
National Committee on Large <strong>Dam</strong>s (NETHCOLD). In<br />
the definition of ICOLD all dams having a height of 15 m or<br />
more are large dams. However, also 10 m high dams having<br />
a crest exceeding a certain length or a reservoir exceeding a<br />
certain volume or area are considered to be large dams. It<br />
implies that The Netherlands has some 10 large dams.<br />
Worldwide, the number of large dams is in the order of<br />
50000. In recent years ICOLD members have broadened<br />
their scope to the so-called small dams. Some national committees<br />
have even taken the trouble to delete the word<br />
‘large’ in their committee name. Obviously, our sea defences<br />
(sea dikes) and flood embankments (river dikes) have much<br />
in common with small dams.<br />
ICOLD, having its secretariat in Paris, has been founded in<br />
1928 in order to create a forum for discussion and exchange<br />
of knowledge and experience in the field of dam design and<br />
construction. Anybody who, in one way or another, is involved<br />
in dam building and water management may become<br />
active in ICOLD. In the year 2006, 85 countries were a<br />
member of ICOLD through their national committees. In<br />
those national committees one usually finds representatives<br />
of governmental departments, technical institutes, consulting<br />
engineers and contractors; but also financing institutions,<br />
environmentalists and insurers may play an active<br />
role.<br />
NETHCOLD was founded in 1969. The implementation of the<br />
Delta Project was at its peak at that time. In an article published<br />
in ‘De Ingenieur’ (November 22, 1968) the writer<br />
stated:<br />
“Also in The Netherlands dams have been built and are being<br />
built which fit the ICOLD definition. In this respect one should<br />
not only refer to our estuary dams in the delta region of Rhine<br />
and Meuse but also to the dams closing off tidal inlets like the<br />
Zuyderzee, the Braakman and the Lauwerszee. During construction<br />
of (for instance) tidal power plants (France, England,<br />
Canada, Russia) conditions are encountered which are comparable<br />
to those prevailing in our own coastal and deltaic regions.<br />
One could imagine that the experience and know-how, obtained<br />
during design, model and field investigations and construction<br />
of the Delta Project, after its completion…could be<br />
useful for providing expertise and carrying out assignments in<br />
other countries. But in that case one must make sure that others<br />
are aware of the Dutch skills and technology in this field.<br />
One way of reaching this goal is the membership of ICOLD”.<br />
Partly as a consequence of this article NETHCOLD (a<br />
‘stichting’) was founded and, at that time, placed under the<br />
supervision of KIVI (some years ago KIVI did not any longer<br />
think this supervision to be necessary). Members can be<br />
governmental entities as well as commercial enterprises and<br />
individuals. At present two departments of Rijkswaterstaat,<br />
Delft University of Technology (Fac. CiTG), institutes (Delft<br />
Hydraulics, IHE-UNESCO), engineering consultants and contractors<br />
are corporate members as well as some individuals.<br />
In the Statutes it is laid down that in case the Chairman is<br />
somebody employed by Rijkswaterstaat, the Secretary must<br />
come from a commercial enterprise and vice-versa.<br />
Within ICOLD, exchange of experience and know-how takes<br />
place in the so-called technical committees, during the annual<br />
technical symposia and during the congresses which<br />
are held every three years. A list of technical committees can<br />
be found at ICOLD’s web site (www.icold-cigb.org) under<br />
the heading ICOLD -> Technical Committees.<br />
ICOLD members meet each other first of all during the said<br />
congresses (some 1 500 participants) but also during the<br />
committee meetings which are held during the Annual<br />
Meetings. During such annual meetings the host country<br />
will, apart from a technical symposium, also organise workshops<br />
and study tours to dam projects in the host country<br />
and neighbouring countries.<br />
A new development in ICOLD is the creation of regional<br />
‘clubs’. NETHCOLD is member of the Club for European National<br />
Committees. This club also has a number of working<br />
groups. They discuss and formulate rules on such topics as<br />
floods, risk assessment, dam safety and the European Water<br />
Directive but also on seismic criteria for dams. The work in<br />
these groups is of great interest for the Netherlands as the<br />
basin-wide approach plays a significant role. An example is<br />
the analysis of the role of dams in European rivers during<br />
flood periods.<br />
NETHCOLD members have always been very active in various<br />
technical committees. In most cases the findings and<br />
conclusions of such committees are laid down in so-called<br />
<strong>Dam</strong> <strong>edition</strong> | Double Issue 2007/2008 | 51
Ingeokring <strong>News</strong><strong>letter</strong><br />
Bulletins. During the past 40 years NETHCOLD has had an<br />
important input in some 15 Bulletins. Currently there are<br />
some 100 Bulletins available (see ICOLD’s web site under<br />
publications).<br />
The input from the Netherlands covers a wide range of topics<br />
such as the use of bitumen in fill dams, hydraulics for<br />
dams, sedimentation of reservoirs, dam safety, dams and<br />
floods, the role of dams in the development and management<br />
of river basins, public awareness and education and,<br />
last but not least, environmental issues. Members of NETH-<br />
COLD have chaired some committees for shorter or longer<br />
periods.<br />
Apart from this committee work, NETHCOLD has also organised<br />
study tours to the Netherlands (1983 and 1995) and<br />
taken the initiative (in 1993) for a special study group to get<br />
ICOLD members, when designing a dam, more focused on a<br />
river basin-wide approach and sustainable solutions.<br />
NETHCOLD, in collaboration with KIVI, Waterbouwdispuut<br />
and IHE-UNESCO, from time to time organises symposia on<br />
matters related to dams (1985, 1990, 1995 and 2001). The<br />
symposia have resulted in the publication of two books: ‘De<br />
Keerzijde van de <strong>Dam</strong>’ (edited by Rijkert Knoppers and Walter<br />
van Hulst) (1995) and ‘<strong>Dam</strong>s and Dykes in Development’<br />
(2002).<br />
Finally, it should be mentioned that NETHCOLD members<br />
translated the ICOLD Technical Dictionary on <strong>Dam</strong>s (1990).<br />
This translation is now available for the public at VSSD Delft<br />
in its series of Lecture Notes.<br />
Reference is made to NETHCOLD’s website for more specific<br />
information and details: www.nethcold.org.<br />
<strong>Dam</strong> <strong>edition</strong> | Double Issue 2007/2008 | 52
Ingeokring <strong>News</strong><strong>letter</strong><br />
<strong>Dam</strong>s in the Western USA<br />
Erik Schoute, Royal Boskalis Westminster nv<br />
Introduction<br />
While working in the United States, I spent some time vacationing<br />
in the Southwest of the USA in the summer of 2003<br />
and in the Northwest of the USA/Southwest of Canada in<br />
the fall of 2004. During these two road trips, on which occasions<br />
we clocked 6 000 and 10 000 kilometres on the car’s<br />
odometer, we came across some very interesting hydropower<br />
projects. As I was travelling with a friend who graduated<br />
at TU Delft as a Civil Engineer, we certainly could not<br />
just drive by without getting a closer look into some of these<br />
projects. In this article, some of my own impressions about<br />
the dams will be presented together with background information<br />
collected while on the road and from the internet.<br />
area in a period from 1946 to 1948. The site met several criteria:<br />
the area forming the basin could contain an immense<br />
amount of water, the canyon walls and bedrock foundation<br />
were strong and stable enough to safely support the high<br />
dam and a large source of good rock and sand was available<br />
at nearby Wahweap Creek.<br />
2003 Road Trip: Glen Canyon <strong>Dam</strong> and Hoover <strong>Dam</strong><br />
During the trip in the summer of 2003 which started and<br />
ended in Las Vegas, the route went clockwise through Nevada,<br />
Utah, Colorado, New Mexico, Arizona, California and<br />
back into Nevada. The magnificent scenery, good roads and<br />
road side services make the Southwest of the USA a particularly<br />
great region to travel around. In this area of the USA, a<br />
vast amount of National Parks can be found (to name just a<br />
few that were visited: Zion, Bryce Canyon, Capitol Reef, Glen<br />
Canyon, Canyon de Chelly, Grand Canyon, Lake Mead and<br />
Death Valley). Two of these National Parks are also home or<br />
close to some of the most spectacular hydropower projects<br />
in the world: Glen Canyon <strong>Dam</strong> and Hoover <strong>Dam</strong>.<br />
Glen Canyon <strong>Dam</strong><br />
Glen Canyon <strong>Dam</strong> is part of the Glen Canyon National Recreation<br />
Area, which covers over 5 000 km 2 in Arizona and<br />
Utah. The dam is situated in the Colorado River near Page,<br />
Arizona.<br />
Glen Canyon <strong>Dam</strong> is a concrete thick gravity arch dam<br />
(’thick’ meaning with a base thickness to structural height<br />
ratio of 0.3 or greater) with a height of 216 m and a crest<br />
length of 475 m. Width of the dam is 7.5 m at the crest and<br />
91 m at the base. See Figure 1 for an impression of Glen<br />
Canyon <strong>Dam</strong> and Bridge.<br />
Fig. 1 Looking south, with Lake Powell at the bottom of the photo, then<br />
Glen Canyon <strong>Dam</strong> and Glen Canyon Bridge (source: en.wikipedia.org/<br />
wiki/Glen_Canyon_<strong>Dam</strong>).<br />
Glen Canyon was carved by differential erosion from the<br />
Colorado River over an estimated 5 million years. The Colorado<br />
Plateau, through which the canyon cuts, arose some 11<br />
million years ago. Within that plateau, there are layers of<br />
rock from over 300 million years old to the relatively recent<br />
volcanic activity. Navajo Sandstone, the result of compressed<br />
sand dunes, forms the canyon walls at the dam site<br />
and throughout most of Lake Powell. The sandstone is remarkably<br />
uniform and homogeneous over wide areas and<br />
nearly identical samples can be obtained from areas separated<br />
by many kilometres. Navajo Sandstone is buff to reddish,<br />
fine to medium grained, and soft to moderately hard. It<br />
is massive with pronounced cross-bedding and commonly<br />
indistinct horizontal bedding. The sandstone is moderately<br />
porous and highly absorptive, owing to the high capillarity<br />
created by the small size of intergrain pore spaces.<br />
The remote location in a part of the Colorado River valley<br />
called Marble Canyon was selected by a group of Bureau of<br />
Reclamation engineers and geologists, who explored the<br />
<strong>Dam</strong> <strong>edition</strong> | Double Issue 2007/2008 | 53
Ingeokring <strong>News</strong><strong>letter</strong><br />
Fig. 2 Glen Canyon <strong>Dam</strong> and Bridge (note the white band on the<br />
Navajo Sandstone, result of the low level of the reservoir behind the<br />
dam) (source: author’s photo).<br />
Upon completion of Glen Canyon <strong>Dam</strong> the Colorado River<br />
and its tributaries began to back up, no longer being diverted<br />
through the tunnels. The newly flooded Glen Canyon<br />
formed Lake Powell, stretching for over 300 km upstream.<br />
As the lake filled over the years, seismic activity in the area<br />
increased as the ground shifted beneath the increasing<br />
weight of the water. It took 17 years for the lake to rise to<br />
the high water mark, which was reached on June 22, 1980.<br />
Since then the reservoir level has fluctuated wildly and is<br />
currently less than 60% of its total capacity. The reservoir is<br />
currently suffering from prolonged drought. The reservoir<br />
has been evaporating as much as ever, and the longsubmerged<br />
side canyons are being revealed. This lower level<br />
can be clearly seen as the so-called ‘bathtub ring’ (white<br />
band) in Figure 2.<br />
Construction of the dam started in 1956 with the creation of<br />
water diversion tunnels. By 1959, nearby Glen Canyon<br />
Bridge was completed (see Figure 2), allowing trucks to deliver<br />
equipment and materials for the dam and the new<br />
town of Page. Concrete placement started around the clock<br />
on June 17, 1960. The last bucket of concrete was poured on<br />
September 13, 1963 (see Figure 3 for typical bucket size).<br />
Over 3.7 million m 3 of concrete was used. Construction of<br />
the dam, bridge and all other adjacent facilities cost $314<br />
million (adjusted for inflation) and 18 people’s lives.<br />
Next, turbines and generators were installed from 1963 to<br />
1966. The plant consists of eight 155 500 horsepower Francis<br />
turbines that generate more than 1 300 MW of electricity<br />
with each of the 40 ton steel shafts turning at 150 rpm. With<br />
all eight generators operating at full output, over 55 million<br />
litres of water will pass through the power plant's penstocks<br />
each minute.<br />
Fig. 4 Aerial photo of Hoover <strong>Dam</strong> with the U-shaped power plant in<br />
front and Lake Mead in the back (source: photo.net/photo/pcd2882/<br />
hoover-dam-aerial-91.4.jpg) .<br />
Hoover <strong>Dam</strong><br />
Almost 2 200 km and 5 days later we had arrived at the last<br />
stop before leaving from Las Vegas again: the giant Hoover<br />
<strong>Dam</strong>. Hoover <strong>Dam</strong> is situated in another NPS administered<br />
National Recreation Area: Lake Mead, which stretches out<br />
over an area of 750 km 2 . Hoover <strong>Dam</strong> is situated in the Black<br />
Canyon of the Colorado River valley, on the border between<br />
Nevada and Arizona (the actual border runs over the crest of<br />
the dam), some 50 km southeast of Las Vegas.<br />
Fig. 3 Bucket which was used to pour concrete (source: author’s photo).<br />
In total, 21 000 people worked on the project which was<br />
completed in 1936. Construction costs of the dam were<br />
$676 million (adjusted for inflation) and 114 people’s lives<br />
were lost over the total project period from 1922 to 1942.<br />
Hoover <strong>Dam</strong> is a similar type dam as Glen Canyon <strong>Dam</strong>, a<br />
concrete thick gravity arch dam, with a height of 220 m and<br />
a crest length of 380 m. Width of the dam is 14 m at the crest<br />
and 200 m at the base.<br />
<strong>Dam</strong> <strong>edition</strong> | Double Issue 2007/2008 | 54
Ingeokring <strong>News</strong><strong>letter</strong><br />
The foundation and abutments mainly consist of andesite<br />
breccia and welded ash-flow tuff intruded by latites. The first<br />
concrete for the dam was placed on June 6, 1933 and until<br />
May 29, 1935 3.3 million m 3 of concrete was poured. Hoover<br />
<strong>Dam</strong> is the tallest solid concrete dam in the Western Hemisphere.<br />
There is one taller dam in the USA (Oroville <strong>Dam</strong>),<br />
but this is not a solid concrete dam. Worldwide, Hoover <strong>Dam</strong><br />
ranks number 20 in the list of tallest dams. Lake Mead, which<br />
was formed by the construction of Hoover <strong>Dam</strong>, is the largest<br />
reservoir in the USA.<br />
2004 Road Trip: Hungry Horse <strong>Dam</strong>, Grand Coulee <strong>Dam</strong>,<br />
Chief Joseph <strong>Dam</strong> and Diablo <strong>Dam</strong><br />
In October and November 2004, I made a road trip through<br />
the Northwestern states of the USA (Washington, Oregon,<br />
Idaho, Wyoming and Montana) and the Western provinces<br />
of Canada (Alberta, British Columbia). This area can be called<br />
‘dam country’ without exaggerating too much, as can be<br />
The power plant is located in the U-shaped structure at the<br />
base of the dam (see Figure 4). Each power plant wing is 200<br />
m long and there are 17 main turbines. The plant has a total<br />
capacity of 2.99 million horsepower and 2 079 MW.<br />
Hoover <strong>Dam</strong> generates more than 4 billion kWh per year of<br />
low-cost hydro-electric power, which is enough to serve 1.3<br />
million people in Nevada, Arizona, and California. Contrary<br />
to what many people think, only 4% of Las Vegas’ massive<br />
energy consumption is generated by the Hoover <strong>Dam</strong> hydropower<br />
plant.<br />
Fig. 6 Columbia River basin with dams (source: www.nwdwc.usace.army.mil/report/colmap.htm).<br />
seen in Figure 6 which (by coincidence) is also more or less<br />
the area that I visited on this road trip. The picture shows the<br />
Columbia River basin, an area with roughly the size of<br />
France. The Columbia's heavy flow and its large elevation<br />
drop over a relatively short distance give it tremendous potential<br />
for hydropower generation. It is the largest hydroelectric<br />
power producing river in North America, with 14<br />
dams in the Columbia River alone, in the United States and<br />
Canada.<br />
3 of the 4 dams that were visited are in the Columbia River<br />
basin: Hungry Horse <strong>Dam</strong> (Hungry Horse, Montana), Grand<br />
Coulee <strong>Dam</strong> (Grand Coulee, Washington) and Chief Joseph<br />
<strong>Dam</strong> (Bridgeport, Washington). The other dam is the Diablo<br />
<strong>Dam</strong> in the Skagit River, just east of Seattle.<br />
Fig. 5 Spectacularly placed transmission masts in the Black Canyon<br />
near Hoover <strong>Dam</strong> (source: author’s photo).<br />
<strong>Dam</strong> <strong>edition</strong> | Double Issue 2007/2008 | 55
Ingeokring <strong>News</strong><strong>letter</strong><br />
Hungry Horse <strong>Dam</strong><br />
On the road from Kalispell to Glacier National Park, I stopped<br />
along the road for a view of the Hungry Horse <strong>Dam</strong>. This<br />
dam is a concrete thick arch dam, located in a narrow canyon<br />
in the Flathead River, near Columbia Falls in Montana.<br />
Construction started in 1948 and at the time of its completion<br />
in 1953, the dam was the third largest dam, and the<br />
second highest concrete dam, in the world. Currently, it is<br />
the largest dam in Montana and nr. 11 in the list of largest<br />
concrete dams in the USA.<br />
situated in the Columbia River near the towns of Grand Coulee<br />
and Electric City. The dam is part of Lake Roosevelt National<br />
Recreation Area, administered by the National Park<br />
Service. The dam itself is operated by the U.S. Bureau of Reclamation.<br />
Grand Coulee <strong>Dam</strong>, with its three powerhouses, forms the<br />
largest hydro-electric project in the USA and the fourth largest<br />
in the world. It is the largest concrete structure in the<br />
USA, with 9.16 million m 3 of concrete used. Crest length of<br />
the dam is 1 592 m, while its height is 168 m. Base width is<br />
152 m and crest width is 9 m.<br />
Construction of the original project started in December<br />
1933, as part of the Columbia Basin Project for irrigation of<br />
desert areas of the Pacific Northwest and for the production<br />
of electricity for the then rapidly expanding cities of Spokane,<br />
Portland, Seattle and Tacoma. Foundation rocks at the<br />
dam site consist of hard, sound, massive granite varying<br />
from coarse-grained in the right abutment to fine-grained<br />
porphyritic in the left abutment.<br />
Fig. 7 View on Hungry Horse <strong>Dam</strong> from the road between Columbia<br />
Falls and Glacier National Park (source: author’s photo).<br />
The 172 m high dam is a variable-thickness concrete arch<br />
structure with a crest length of 645 m. Crest width is 10 m,<br />
base width 98 m. The dam and appurtenant works contain<br />
2.4 million m 3 of concrete. The spillway is the highest morning-glory<br />
structure in the world. Water cascading over the<br />
spillway rim drops a maximum distance of 149 m. The capacity<br />
of the spillway is 1 415 m 3 per second, and the reservoir<br />
has a total surface area of 96 km 2 .<br />
Construction finished in 1942, and numerous modifications<br />
followed in more recent years. The first power was generated<br />
in 1941 and the last of the original 18 units (of the initial<br />
two powerhouses, one at each side of the dam’s spillway)<br />
started production in 1950. Between 1966 and 1974<br />
the dam was expanded to add the Third Powerhouse. The<br />
original dam was modified for the Third Powerhouse by a<br />
357 m long, 61 m high forebay dam along the right abutment<br />
approximately parallel to the river and at an angle of<br />
64 degrees to the axis of Grand Coulee <strong>Dam</strong>. This involved<br />
demolishing 80 m of the northeast side of the dam. The<br />
addition accommodates six new generators. These new<br />
turbines and generators, three 600 MW and three 805 MW<br />
The dam is used for power generation, using 71 MW generators.<br />
The generator capacity was upgraded in the 1990´s to<br />
107 MW each, for a total plant capacity of 428 MW. The<br />
dam’s foundation consists of Siyeh Limestone in regular<br />
beds ranging from a few centimetres to metres thick, made<br />
highly insoluble by impurities. Cut by one major and several<br />
minor shear zones, and one major bedding-plane slip.<br />
Grand Coulee <strong>Dam</strong><br />
After Hungry Horse <strong>Dam</strong>, I travelled through Canada for two<br />
weeks and after that I went south again and visited the<br />
beautiful northeastern part of the state of Washington. After<br />
crossing the border between the USA and Canada, I went to<br />
the giant Grand Coulee <strong>Dam</strong>. This is a concrete gravity dam,<br />
Fig. 8 Grand Coulee <strong>Dam</strong>, with Right and Left Powerplants at both<br />
sides of the spillway and Third Powerhouse and Forebay <strong>Dam</strong> at the left<br />
side (source: U.S. Bureau of Reclamation).<br />
<strong>Dam</strong> <strong>edition</strong> | Double Issue 2007/2008 | 56
Ingeokring <strong>News</strong><strong>letter</strong><br />
units, are some of the largest ever produced. The expansion<br />
was completed in the early eighties and made the Grand<br />
Coulee <strong>Dam</strong> one of the largest hydro-electric producers in<br />
the world. In total, it has 3 power plants with 33 generators,<br />
and a pumping-generating plant, all together generating a<br />
total of 6 809 MW of electricity. The lake which formed during<br />
construction of the dam is called Franklin D. Roosevelt<br />
Lake and stretches over 243 km upstream.<br />
I was able to tour the dam, with a descent into the Third<br />
Powerhouse by a ride in a glass elevator on top of the forebay<br />
penstocks in the Third Powerhouse (elevator visible at<br />
left side in the aerial photo in Figure 8). In the Third Powerhouse,<br />
the world’s largest indoor cranes are active for maintenance<br />
work on the 6 gigantic Francis turbines (see Figure<br />
9).<br />
Fig. 10 View on Chief Joseph <strong>Dam</strong> and Rufus Woods Lake (source:<br />
www.nws.usace.army.mil/publicmenu/images/cjdam/<br />
chief_joseph_dam_large.jpg).<br />
Engineers. It is also the Corps’ largest dam and the second<br />
largest hydropower producing dam in the USA (behind<br />
Grand Coulee <strong>Dam</strong>). Its capacity is 2 600 MW, and average<br />
annual production is 12 million MWh, which is enough electricity<br />
to meet the needs of all homes, businesses and industries<br />
in the Seattle metropolitan area. It has the longest<br />
straight-line powerhouse in the USA, stretching 621 m.<br />
Construction of the dam started in 1949 and 9 years later,<br />
the dam’s first 16 turbine generators were in place. Total<br />
costs of construction were $145 million. By 1981, 11 more<br />
generators had been added and the dam was raised 3 m<br />
(cost: $396 million). 1.68 million m 3 of concrete was used in<br />
the construction of the dam. The dam is constructed in such<br />
a way that a maximum length is exposed to the river to generate<br />
as much electricity as possible. The total crest length of<br />
the dam is 1 817 m, where the river is only 300 m wide. The<br />
dam is therefore constructed in a L-shape, which made it<br />
possible to extend the powerhouse and install more generators.<br />
Construction of the dam created Rufus Woods Lake,<br />
which stretches 82 km upstream to the Grand Coulee <strong>Dam</strong>.<br />
Fig. 9 Francis turbine in Third Powerhouse (source: www.usbr.gov/<br />
power/data/sites/grandcou/grandcou.html).<br />
Chief Joseph <strong>Dam</strong><br />
A little further down the road from the Grand Coulee <strong>Dam</strong> I<br />
stopped to take a look at Chief Joseph <strong>Dam</strong>, which is also<br />
situated in the Columbia River near the town of Bridgeport<br />
in the state of Washington.<br />
It is a concrete gravity dam with a height of 72 m and is designed,<br />
constructed and operated by the U.S. Army Corps of<br />
Fig. 11 View on the spillway of the dam (source: author’s photo).<br />
<strong>Dam</strong> <strong>edition</strong> | Double Issue 2007/2008 | 57
Ingeokring <strong>News</strong><strong>letter</strong><br />
Fig. 12 Cross sectional sketch of giant fold exposing migmatites in the Metamorphic Core Domain (Chelan Mountains terrane) (source:<br />
www2.nature.nps.gov/GEOLOGY/usgsnps/noca/nocastc.html#Napeequa).<br />
Diablo <strong>Dam</strong><br />
After a nice scenic drive across iced roads in the North Cascades<br />
National Park, I stopped briefly for a look at the Diablo<br />
<strong>Dam</strong>. This dam forms part of a series of dams (Ross, Diablo<br />
and Gorge) that were built in the Upper Skagit River in the<br />
1930’s as part of the Skagit River Hydro-electric Project. The<br />
dams were constructed without a single road traversing the<br />
North Cascades at that time (only in 1972 a paved road was<br />
opened in the then brand new National Park).<br />
Construction of Diablo <strong>Dam</strong> started in 1927. It is a 116 m<br />
high concrete arch dam which was the world’s highest of<br />
this type when construction was finished in 1930. On October<br />
20, 1936 Diablo <strong>Dam</strong> started generating hydropower, its<br />
current capacity is 169 MW. The lake behind the dam is<br />
called Diablo Lake.<br />
Fig. 13 Diablo <strong>Dam</strong> and Lake (source: www.ci.seattle.wa.us/light/tours/<br />
Skagit/Images/DiabloBig.jpg).<br />
Geologically, the wilderness of North Cascades National Park<br />
forms part of the Skagit Gneiss Complex. This is derived from<br />
the metamorphosed strata of the Chelan Mountains terrane<br />
by intrusion of many igneous sills and dikes, which were<br />
then metamorphosed. Two types of gneiss are present in<br />
the region around Diablo <strong>Dam</strong>: banded gneiss and orthogneiss.<br />
Banded gneiss is made up of layers of granitic<br />
orthogneiss alternating with schist. The gneiss layers are<br />
mostly deformed igneous sills. Most of the Skagit Gneiss<br />
Complex consists of migmatite. Figure 12 gives an impression<br />
of the complex geology in this area.<br />
Orthogneiss of at least two different ages makes up much of<br />
the Skagit Gneiss Complex. Some magma intruded while<br />
rocks of the Metamorphic Core Domain were being<br />
squeezed and probably folded. While the magma crystallised<br />
or soon thereafter, the squeezing (or flattening)<br />
aligned the minerals and the rock became foliated orthogneiss.<br />
Twenty million years or so later, much of the<br />
squeezing had ceased. When new magma invaded, the<br />
newly crystallised granitic rocks developed much less foliation<br />
than their predecessors. But because they were subjected<br />
to an episode of stretching, these younger granitic<br />
rocks exhibit strong lineation. The older magmas solidified<br />
about 65-90 million years ago (Cretaceous) and the younger<br />
ones about 45 million years ago (Eocene).<br />
In many areas, the complex sequence of invading magma<br />
and deformation left a confusing mixture of rocks. Gneiss<br />
was cut by light-coloured dikes or sills which were then all<br />
squeezed and deformed. This deformation was followed by<br />
intrusion of still more dikes and further squeezing and<br />
stretching. Even more dikes may have intruded after that.<br />
<strong>Dam</strong> <strong>edition</strong> | Double Issue 2007/2008 | 58
Ingeokring <strong>News</strong><strong>letter</strong><br />
• www2.nature.nps.gov/GEOLOGY/usgsnps/noca/<br />
nocageol6.html#skagit (Skagit Gneiss Complex)<br />
• Maps and guides of the various national parks visited<br />
during the road trips<br />
Further reading<br />
• www.lib.utah.edu/spc/photo/crampton/crampton2.htm<br />
(beautiful images of Glen Canyon before the flooding)<br />
• www.nps.gov (National Parks Service website)<br />
Fig. 14 Diablo <strong>Dam</strong> during the Skagit River flood of October 2003<br />
(source: www.nwrfc.noaa.gov/floods/oct_2003/sld023.html).<br />
• www.usbr.gov (U.S. Bureau of Reclamation website)<br />
Literature<br />
• en.wikipedia.org/wiki/ (Wikipedia entries on the various<br />
projects covered in this article)<br />
• www.usbr.gov/dataweb/dams (large database of dams<br />
managed by the U.S. Bureau of Reclamation)<br />
• www.canyon-country.com/lakepowell/gcdam.htm (Glen<br />
Canyon <strong>Dam</strong> and Lake Powell)<br />
• www.visitmt.com/categories/moreinfo.asp?<br />
IDRRecordID=10846&SiteID=1 (Hungry Horse <strong>Dam</strong>)<br />
• www.nws.usace.army.mil/PublicMenu/Menu.cfm?<br />
sitename=cjdam&pagename=hydropower (Chief Joseph<br />
<strong>Dam</strong>)<br />
Fig. 15 View of the Diablo <strong>Dam</strong> spillways resting on metamorphic rocks<br />
of the Skagit Gneiss Complex (source: author’s photo).<br />
<strong>Dam</strong> <strong>edition</strong> | Double Issue 2007/2008 | 59
Ingeokring <strong>News</strong><strong>letter</strong><br />
Review of the 11th ISRM Congress, July 2007, Lisbon (Portugal)<br />
Dr.ir. Robrecht Schmitz<br />
Lisbon, the city where the first conference of the International<br />
Society for Rock Mechanics (ISRM) was organised,<br />
hosted in July 2007 the 11th ISRM Congress, titled: ‘The second<br />
half century of rock mechanics’. Especially our most<br />
senior ISRM colleagues, of whom there were no few that<br />
joined the first ISRM personally, pointed out at several occasions<br />
that the founders of the ISRM would have been surprised<br />
of the dimensions, standards and world-wide reach<br />
that the ISRM attains today.<br />
Photo taken on a stroll through Lisbon. The camera was accidentally<br />
set to black and white mode (leaving you puzzled if this photo was<br />
taken during the 1st or the 11th congress).<br />
Even after 50 years of intensive academic and industrial<br />
research it is interesting to note that:<br />
3) There is need to consolidate the knowledge gained by<br />
half a century of ISRM activity. Examples are the publication<br />
of the book ‘The complete ISRM suggested methods for rock<br />
characterisation, testing and monitoring’ presented at the<br />
conference by the Turkish national group of the ISRM as well<br />
as the set-up of a mining interest group by past president<br />
Nielen van der Merwe.<br />
4) The diversity in presentations was very wide. Subjects<br />
covered were a.o.: underground- and surface mining, dam<br />
construction, tunnelling and slope stabilisation in virtually<br />
all rock classes. All subjects were treated very theoretically<br />
but also (fortunately) from the practitioner's point of view.<br />
The question was raised if this broad spectrum of presentations<br />
is good or if one should focus on more detailed aspects<br />
during future conferences.<br />
Summarising, one can say the organisation committee did a<br />
perfect job. The lectures started on time, changes in the<br />
programme were clearly communicated and the help offered<br />
to the lecturers to set up the presentation was excellent.<br />
Nevertheless, the old tradition of simultaneous translation<br />
should be kept in mind for following conferences since<br />
the quality of many excellent presentations suffered from a<br />
linguistic point of view.<br />
The information gained during the day was discussed with<br />
colleagues from all over the world during the coffee breaks<br />
and continued during the evening, framed by Lisbon’s excellent<br />
gastronomic setting.<br />
1) There are still basic aspects in rock engineering that are<br />
unsolved, e.g. questions regarding the behaviour of rock<br />
mass in block caving (presentation by Prof. E.T. Brown). A<br />
very important issue, as the rush for raw materials forces an<br />
increase in production rates of underground mining activities.<br />
2) Automation of outcrop mapping still presents challenges.<br />
The most sophisticated tools are, at present, only capable of<br />
identifying 50% of the discontinuities the trained eye/brain<br />
can recognise (presentation by Prof. Z.N. Flynn). For the long<br />
slopes in large surface mines there is no automated way to<br />
map kilometres of slopes on an automated basis (discussion<br />
during the laser scanning session).<br />
Professor E.T. Brown who attended the 1st and 11th ISRM conference<br />
was honoured this year by receiving the Rocha medal.<br />
<strong>Dam</strong> <strong>edition</strong> | Double Issue 2007/2008 | 60
Ingeokring <strong>News</strong><strong>letter</strong><br />
Excursions were organised to Portugal’s thriving marble<br />
quarrying industry and ore mining activity in the Iberian<br />
Pyrite Belt. Another excursion showed how Lisbon’s metro is<br />
extended with all challenges accompanying construction<br />
through very inhomogeneous, partly anthropogenic deposits<br />
with virtually no overburden.<br />
Literature<br />
Ulusay, R. & J.A. Hudson (2007). The complete ISRM suggested<br />
methods for rock characterisation, testing and monitoring:<br />
1974-2006. Suggested Methods prepared by the Commission<br />
on Testing Methods, International Society for Rock Mechanics<br />
(ISRM). ISRM Turkish National Group.<br />
Ribeiro e Sousa, L., C. Olalla & N. Grossmann (eds.) (2007).<br />
Proceedings 11th Congress of the International Society for Rock<br />
Mechanics: The Second Half Century of Rock Mechanics. Taylor<br />
& Francis/Balkema, Leiden.<br />
The conference centre near Bélem next to the river Tagus.<br />
<strong>Dam</strong> <strong>edition</strong> | Double Issue 2007/2008 | 61
Ingeokring <strong>News</strong><strong>letter</strong><br />
Verification of two-dimensional numerical earthquake<br />
site effects on a dam site, Costa Rica<br />
Sigarán-Loría, C. & H.R.G.K. Hack (2007). Verification of two-dimensional numerical earthquake site effects on a dam site, Costa<br />
Rica. Proceedings 11th Congress of the International Society for Rock Mechanics: The Second Half Century of Rock Mechanics. Taylor<br />
& Francis/Balkema, Leiden, pp. 1 203-1 207.<br />
Abstract: The ground response and site effects of a steep valley were verified with a two-dimensional plane strain analysis in the time domain<br />
against recorded motions. Weak motions (
Ingeokring <strong>News</strong><strong>letter</strong><br />
3. Field measurements & models<br />
3.1 Field measurements<br />
Three digital Etna Kinemetrics accelerographs have been<br />
registering motions on the site since September 2005 (one<br />
at the base of the valley on rock, and one at each abutment<br />
towards each slope crest, on saprolitic materials (highly<br />
weathered rock), at heights of 190 m and 135 m above the<br />
river). They were aligned with a north-south (NS) strike, parallel<br />
to the dam axis (Figure 2).<br />
Table 2 Site responses and Fourier spectra frequencies.<br />
Event/<br />
Peak ground acceleration (PGA)<br />
Fourier<br />
Station<br />
NS EW Vertical<br />
spectra [Hz]<br />
28/12/2005<br />
Base 10.99 16.82 9.53 1-10<br />
Right crest 129.26 82.91 39.25 4<br />
Left crest 120.18 120.15 58.05 3<br />
18/11/2006<br />
Base 7.26 16.02 6.42 3-10<br />
Right crest 40.96 40.91 33.79 4-5<br />
30/11/2006<br />
Base 3.94 8.80 3.66 1-9<br />
Right crest 20.75 18.84 13.91 4-6<br />
3.2 2D FEM models<br />
Fig. 2 <strong>Dam</strong> site looking downstream with sketch of dam and placement<br />
of accelerographs.<br />
These instruments have a register capacity of 2 g amplitude,<br />
and a frequency range from 0.12 Hz to 45 Hz. Some weak<br />
motions have been registered, of which three near-field<br />
events were chosen for this analysis (Table 1).<br />
The responses at the measurement points are listed in Table<br />
2, with the main frequencies obtained from smoothed Fourier<br />
amplitude spectra. The left slope is not registered during<br />
the last two events due to a defect in the accelerograph.<br />
The rock motions (‘base’ signals) from the NS component<br />
were the input for the numerical models. The three events<br />
had base-line correction, the same frequency range (0.12-45<br />
Hz) and duration (about 20 s each).<br />
Table 1 Characteristics of the measured earthquakes.<br />
All the FEM models from the valley had the same dimensions<br />
and mesh coarseness. The elements used were 15-<br />
noded triangular, fine enough to ensure appropriate wave<br />
propagation in accordance with the wavelength and shear<br />
wave velocities of the materials. The models were further<br />
refined towards the surface.<br />
The distances from the boundaries were approximately<br />
1300 m from the slope crests to the lateral boundaries and<br />
from the base of the valley to the bottom boundary 20 m<br />
depth. They were chosen after a sensitivity assessment of<br />
the site response under different dynamic loads to find the<br />
models for which the responses converge, avoiding possible<br />
reflections from the boundaries.<br />
The responses in the models were measured at different<br />
points to control the amplification patterns but the focus of<br />
this paper is on the points that correspond with the accelerograph<br />
locations. These are shown in Figure 3. ‘L’ is the<br />
accelerograph at the left slope, corresponding with the<br />
slope crest, and ‘R’ the one at the right slope, located approximately<br />
90 m behind the slope crest.<br />
Distance and<br />
direction from<br />
dam (km)<br />
Hypocentral<br />
depth (km)<br />
Source of rupture<br />
Magnitude (Mw)<br />
Event date<br />
28/12/2005 5.1 Subduction 43 24.2 NW<br />
18/11/2006 5.0 Local fault 23.8 6.5 SW<br />
30/11/2006 4.8 Local fault 9 23 W<br />
<strong>Dam</strong> <strong>edition</strong> | Double Issue 2007/2008 | 63
Ingeokring <strong>News</strong><strong>letter</strong><br />
0 100 200 300 400 500 m<br />
L<br />
R<br />
N<br />
Fig. 3 Measurement points at the slope crests, L: left, R: right (equal<br />
horizontal and vertical scales) and apparent dip of the layers.<br />
3.3 Ground properties and constitutive model<br />
The site consists of a discontinuous rock mass of turbidites<br />
(sandstones and shales) of the Térraba Formation (Oligo-<br />
Miocene). The average bedding is 290°/25° dipping downstream<br />
(Figure 3). Geotechnically, it is divided in three units:<br />
(a) lower: slightly weathered rock, (b) intermediate: moderately<br />
weathered and decompressed rock and (c) upper:<br />
completely weathered, transitional to soil (saprolite). The<br />
lower unit is found at approximately 23 m depth in the left<br />
abutment and 20 m in the right abutment. It transitionally<br />
turns into the intermediate unit, which has about 18 and<br />
16.5 m thickness on the left and right abutments respectively.<br />
The upper unit (saprolitic material) is considerably<br />
weaker and less stiff. Its thickness is 5 m and 4 m on the left<br />
and right abutments respectively, at the accelerograph locations.<br />
The spatial distribution of the units is sketched in Fig-<br />
Table 3 Geotechnical parameters of the site.<br />
Parameter Name Unit Geotechnical Units<br />
Upper Intermediate<br />
Lower<br />
Material<br />
model<br />
Model - Linear elastic<br />
Material<br />
behaviour<br />
Type - Drained<br />
Unit weight γ kN/m 3 18 26.5 27.1<br />
Young’s<br />
modulus<br />
E ref kPa 5e +4 2.5e +6 7e +6<br />
Poisson’s<br />
ratio<br />
ν - 0.3 0.3 0.25<br />
Shear wave<br />
velocity<br />
v s m/s 102 596 1006<br />
Wavelength<br />
λ<br />
for highest<br />
m 2.3 13.2 22.4<br />
frequency<br />
Rayleigh<br />
α<br />
- 0.0314 0.0314 0.0314<br />
damping<br />
ß<br />
- 3.2e -4 3.2e -4 3.2e -4<br />
constants<br />
ure 3, their properties are summarised in Table 3. The geotechnical<br />
characterisation was done through extensive in<br />
situ and laboratory tests (e.g. plate bearing, SPT, triaxial),<br />
geophysical (e.g. microseismicity, seismic refraction) and<br />
geological survey (e.g. drillcore, mapping).<br />
The left slope has a steepness of 43° and 36° towards the<br />
crest. It is gentler than the right slope due to the bedding<br />
dip and strike angles towards the river in that side. The opposite<br />
happens on the right abutment, giving higher steepness<br />
to the slope (57° to 50°).<br />
Due to the scale of this analysis, the complexity of the discontinuities<br />
characterisation, nonlinearity, heterogeneity<br />
and anisotropy of the rock mass could not be incorporated<br />
in the models. In the models the site was considered as a<br />
homogeneous, isotropic continuum. The properties were<br />
used following Table 3.<br />
As the strains for these types of events are small, deformations<br />
range within the elastic range. Therefore, the linear<br />
elastic model was suitable for the purpose of this analysis.<br />
Different geological-geotechnical scenarios were evaluated<br />
to discern between the geological and topographical site<br />
effects and to quantify it. This was done with a model with<br />
the site topography and without the upper geotechnical<br />
unit. This unit was substituted with the intermediate unit,<br />
giving this model two units. Another evaluation was made<br />
with only the lower unit.<br />
3.4 Dynamic properties and loads<br />
Dynamic viscous absorbent boundaries were used to avoid<br />
reflections. The horizontal NS component of the registered<br />
acceleration time histories from the base station on rock<br />
were prescribed along the bottom boundary. The peak accelerations<br />
and main frequencies of the input signals are<br />
given in Table 2.<br />
The damping of the system was Raleigh type, chosen for the<br />
frequency band of the input signals. The resultant mass (α)<br />
and stiffness (ß) proportional constants were estimated for a<br />
5% damping (Table 3).<br />
The natural frequencies of the site were estimated from<br />
transfer functions on a one-dimensional equivalent-linear<br />
system with different earthquake signals from the world<br />
given by the software. The right side displayed a first oscillation<br />
mode between 5 and 6 Hz and a second around 9.5 Hz.<br />
The left side had the first oscillation mode between 3.5 and<br />
4.4 Hz, and a second around 8.5 Hz. The left slope has a<br />
slightly lower fundamental frequency due to the thicker<br />
upper unit of the saprolite. The results of the right slope are<br />
shown in Figure 4.<br />
<strong>Dam</strong> <strong>edition</strong> | Double Issue 2007/2008 | 64
Ingeokring <strong>News</strong><strong>letter</strong><br />
4. 2D FEM ground responses<br />
The site responses from the FEM models were measured<br />
behind the crests of both slopes and along the slope at the<br />
left margin. The output from the points that correspond<br />
with the accelerograph locations are listed in Table 4. The<br />
strongest registered motion (December 28, 2005) was also<br />
modeled with variations in the geology, keeping the site<br />
topography to quantify the site effect of geology on the<br />
response (Table 4).<br />
Amplitude<br />
35<br />
El Centro, PA: 0.34 g<br />
30<br />
Petrolia, PA: 0.42 g<br />
25<br />
Taft, PA: 0.185 g<br />
20<br />
Northridge, PA: 0.33 g<br />
Loma Prieta (TI), PA: 0.16 g<br />
15<br />
Loma Prieta (YB), PA: 0.07 g<br />
10<br />
5<br />
0<br />
0 5 10 15 20 25<br />
f (Hz)<br />
Fig. 4 Oscillation modes at the accelerograph location on the right<br />
slope.<br />
4.1 Amplitude<br />
The peak ground accelerations of the site under the three<br />
motions are given in Table 4 and Figure 5. A good match in<br />
amplitude between the field measurements (referred as<br />
‘instr.’) and the responses from the numerical models was<br />
obtained. Figure 6 illustrates the spatial distribution of the<br />
horizontal accelerations on the left slope.<br />
For the left slope, a consistent trend of higher amplification<br />
towards the slope crest was obtained coinciding with the<br />
position of the accelerograph (Figure 5 and Figure 6). The<br />
right slope showed a peak around 100 m from the crest for<br />
the stronger event (approximate location of the accelerograph,<br />
described in 3.1), but for the other two motions that<br />
trend was not clear (Figure 5). More measurement points are<br />
needed to make further conclusions.<br />
Table 4 Peak ground accelerations and amplification factors at the<br />
right and left crests.<br />
Event Right crest Left crest<br />
PGA (cm/s 2 ) A.f.* PGA (cm/s 2 ) A.f.<br />
28/12/2005 127.6 11.6 118.8 10.8<br />
2 units 36.9 3.4 29.1 2.6<br />
1 unit 28.8 2.6 32.0 2.9<br />
18/11/2006 43.3 5.9 53.3 7.3<br />
30/11/2006 25.8 6.5 28.9 7.3<br />
* A.f.: Amplification factor<br />
PGA (cm/s^2)<br />
PGA's of the three events<br />
140<br />
left, 18.11.06<br />
120<br />
right, 18.11.06<br />
100<br />
left, 30.11.06<br />
right, 30.11.06<br />
80<br />
left, 28.12.05<br />
60<br />
right, 28.12.05<br />
instr., right, 28.12<br />
40<br />
instr., left, 28.12<br />
20<br />
instr., right, 18.11<br />
instr., right, 30.11<br />
0<br />
-400 -300 -200 -100 0 100 200 300<br />
slope<br />
behind crest<br />
distance from crests (m)<br />
Fig. 5 Peak ground accelerations of the three motions along the left<br />
slope and behind the crests of both slopes. The zero on the x-axis represents<br />
the crest of each slope. “Instr.” are the instrumental field measurements.<br />
When overlapping the time domain outputs from the model<br />
with the accelerograph signals, a good correspondence for<br />
the stronger event (December 28, 2005) was found but the<br />
others showed a time disparity of 2 to 4 s, although the signals<br />
kept similar shapes amongst them.<br />
4.2 Site effects on the amplification<br />
Three models with variations in the geotechnical units keeping<br />
the site topography the same were assessed to quantify<br />
the amplifications associated with the geological site effects.<br />
The two-units model was performed without the upper unit<br />
(saprolite). That layer was substituted with the material of<br />
the intermediate unit. Similarly, the one-layer model was<br />
carried out considering only the response of the lower unit<br />
within the site morphology. The peak accelerations and<br />
amplification factors of these models are given in Table 4. As<br />
expected, the model with one unit gave the lowest amplifications,<br />
followed by the two-units one. The difference between<br />
the responses of these models with the real situation<br />
(three units) is important. When removing the upper unit,<br />
the amplification factors drop down 3.4 to 4 times, from 11.6<br />
to 3.4 in the right slope, and from 10.8 to 2.6 in the left<br />
(Table 4). The removed layer has important differences in its<br />
physical-mechanical properties and lower impedance. The<br />
one-unit model displayed similar range and trend in its responses<br />
to the two-units one (Table 4).<br />
Locally, below the accelerograph locations, the fundamental<br />
frequencies were estimated as 5-6 Hz at the right side and<br />
3.5-4.4 Hz at the left side (Figure 4). The frequency content<br />
of the Fourier spectra (Table 2) of the three events showed a<br />
similar range between 1 and 10 Hz at the base. The same<br />
spectra at the accelerograph locations displayed a main<br />
frequency peak between 4-6 Hz at the right slope and 3 Hz<br />
at the left. Comparing the Fourier amplitude spectrum of<br />
the site with the fundamental natural frequencies, it is seen<br />
<strong>Dam</strong> <strong>edition</strong> | Double Issue 2007/2008 | 65
Ingeokring <strong>News</strong><strong>letter</strong><br />
7. References<br />
Assimaki, D., G. Gazetas & E. Kausel (2005). Effects of Local<br />
Soil Conditions on the Topographic Aggravation of Seismic<br />
Motion: Parametric Investigation and Recorded Field Evidence<br />
from the 1999 Athens Earthquake. Bulletin of the Seismological<br />
Society of America, 95, No. 3, pp. 1 059-1 089.<br />
Fig. 6 Peak horizontal accelerations on the left slope (in m/s 2 ). Peak<br />
towards the crest. Response under the motion of December 28, 2005.<br />
that under those places resonance develops in the upper<br />
geotechnical unit.<br />
5. Conclusions<br />
The numerical ground responses of this plane strain survey<br />
provided a good approximation of three field-measured<br />
weak earthquakes (
Ingeokring <strong>News</strong><strong>letter</strong><br />
Papalou, A. & J. Bielak (2004). Nonlinear Seismic Response of<br />
Earth <strong>Dam</strong>s with Canyon Interaction. Journal of Geotechnical<br />
and Geoenvironmental Engineering, 130, No. 1, pp. 103-110.<br />
Psarropoulos, P.N., Y. Tsompanakis & Y. Karabatsos (2007).<br />
Effects of local site conditions on the seismic response of<br />
municipal solid waste landfills. Soil Dynamics and Earthquake<br />
Engineering, 27, No. 6, pp. 553-563.<br />
Semblat, J.F., M. Kham, E. Parara, P.-Y. Bard, K. Pitilakis, K.<br />
Makra & D. Raptakis (2005). Seismic wave amplification: Basin<br />
geometry vs soil layering. Soil Dynamics and Earthquake<br />
Engineering, 25, No. 7-10, pp. 529-538.<br />
Sincraian, M.V. & C.S. Oliveira (2001). A 2-D Sensitivity Study<br />
of the Dynamic Behavior of a Volcanic Hill in the Azores Islands:<br />
Comparison with 1-D and 3-D Models. Pure and Applied<br />
Geophysics, 158, No. 12, pp. 2 431-2 450.<br />
Thimus, J.-F., P. Delvosal, S. Waltener, C. Schroeder & N.<br />
Boukpeti (2006). Analysis of seismic wave propagation in<br />
soils, FLAC and Numerical Modeling in Geomechanics-2006.<br />
Proceedings of the 4th International FLAC Symposium,<br />
ITASCA Consulting Group, Inc., Minneapolis, pp. 181-186.<br />
<strong>Dam</strong> <strong>edition</strong> | Double Issue 2007/2008 | 67
Ingeokring <strong>News</strong><strong>letter</strong><br />
Excursie Hubertustunnel, Den Haag<br />
Leon van Paassen en Marcel Remijn<br />
Op een schitterende vrijdagmiddag (13 april 2007) verzamelde<br />
een grote groep ingenieursgeologen en belangstellenden<br />
zich bij het bezoekerscentrum van de Hubertustunnel<br />
in Den Haag. Daar werden zij hartelijk ontvangen door<br />
Sallo van der Woude, projectleider bij aannemerscombinatie<br />
HTC (Hubertus Tunnel Combinatie).<br />
Nadat iedereen een kopje koffie voor zichzelf had ingeschonken<br />
begon Sallo te vertellen over de tunnel: over de<br />
problemen die ze tot nu toe bij het boren waren tegengekomen,<br />
maar vooral ook over de snelle voortgang van het project.<br />
Door de toenemende verkeersdrukte wordt de bereikbaarheid<br />
van Den Haag en met name Scheveningen steeds<br />
slechter. Door de ligging aan zee heeft Den Haag geen mogelijkheid<br />
het verkeer rondom de stad te leiden, verkeer uit<br />
de regio moet door de stad heen. Woonwijken worden bovendien<br />
ernstig belast door verkeer dat een andere weg<br />
zoekt om files en vertragingen te vermijden. Een groot deel<br />
van deze problemen wordt opgelost door de aanleg van de<br />
Hubertustunnel, die 1 600 meter lang wordt. Het tracé van<br />
de tunnel loopt van het terrein van de voormalige Kleine<br />
Alexanderkazerne naar het Hubertusviaduct. De tunnel zal<br />
bestaan uit twee tunnelbuizen, waarvan de eerste bij het<br />
bezoek al was geboord. Het boren van de tweede buis was<br />
kort tevoren gestart. In vier boorploegen wordt er 24 uur per<br />
dag, 7 dagen per week gewerkt, zodat de tweede tunnelbuis<br />
begin juni 2007 klaar zou zijn. In de zomer van 2008 moet de<br />
tunnel open gaan voor verkeer.<br />
Tijdens het boren van de eerste buis ontstonden er problemen<br />
met de pasvorm van de tunnelsegmenten waaruit de<br />
tunnelbuis wordt opgebouwd. Omdat de vorm van sommige<br />
segmenten meer afweek dan de tolerantie toeliet traden<br />
er piekspanningen op in de hoeken. Dit leidde tot beschadigingen<br />
aan de segmenten tijdens, of kort na de plaatsing.<br />
Het repareren en/of vervangen van deze segmenten zorgde<br />
voor extra reparaties<br />
en tijdsverlies. Nadat<br />
de gietmallen van de<br />
segmenten waren aangepast<br />
was dit probleem<br />
grotendeels<br />
verholpen.<br />
De Hubertustunnel is<br />
een van de eerste tunnels<br />
in Nederland die<br />
onder bestaande bebouwing<br />
doorgaat. Het<br />
monitoren van zettingen<br />
is daarom van<br />
groot belang. In samenwerking<br />
met Fugro is een uitgebreid en volledig geautomatiseerd<br />
monitoringssysteem opgezet. Dit systeem<br />
houdt 24 uur per dag de zettingen van de grond en gebouwen<br />
boven en rond de Hubertustunnel in de gaten. Indien<br />
de vervormingen groter zijn dan verwacht kan er besloten<br />
worden om het boorproces aan te passen, door bijvoorbeeld<br />
de steundruk van het boorfront te verhogen of te<br />
verlagen.<br />
Na de presentatie van Sallo werden de laarzen aangetrokken<br />
en de helmen opgezet en verplaatste de hele groep zich<br />
naar het bouwterrein. Onder begeleiding van Sallo gingen<br />
we de eerste tunnelbuis in. Hier was men bezig met de aanleg<br />
van de dwarsverbinding naar de tweede tunnelbuis. Dit<br />
wordt gedaan door de grond tussen de twee buizen te bevriezen<br />
en dan grond te verwijderen en de dwarsverbinding<br />
aan te leggen.<br />
Hierbij willen we Sallo bedanken voor de goede ontvangst<br />
en het organiseren van deze gezellige en leerzame excursie.<br />
<strong>Dam</strong> <strong>edition</strong> | Double Issue 2007/2008 | 68
Ingeokring <strong>News</strong><strong>letter</strong><br />
Water at the desert fringe<br />
The Marib dams and irrigation schemes in the Republic of<br />
Yemen. A personal memory and a historical view<br />
Charles Dufour, Project co-manager Water Resources Assessment Yemen Arab Republic project (WRAY) 1985-1989<br />
In memory of Koos Uil (1946-2003), hydro-geologist WRAY project 1985-1989<br />
Location, population and economic activities<br />
The Marib dam and the surrounding irrigation area are located<br />
within the longitudes 45°15’ and 45°40’ east and latitudes<br />
15°20’ and 15°45’ north at the northeastern fringe of<br />
the mountainous area of the Yemen highlands. The site of<br />
the Marib dam is located where the Wadi Dhana (also<br />
known as Wadi Adhanah) enters the plain and is called the<br />
Wadi As Sudd at that spot. Towards the east of Marib the<br />
Ramlat extends as Sab’atayan, towards the north of Marib<br />
the desert extends as Rub Al Khali, translated in English as<br />
The Empty Quarter. The area under cultivation around Marib<br />
is 10 000 hectares, spread over an area of 20x25 km (500<br />
km 2 ).<br />
of 36%. The reference crop evapotranspiration in Marib is<br />
3180 mm (calculated according the modified Penman<br />
method).<br />
The ancient Great Marib <strong>Dam</strong><br />
Historical background<br />
Marib was the capital over which the legendary Queen of<br />
Sheba (or Sabah), known as Bilqis to the Arabs, ruled around<br />
950 B.C. The Queen of Sheba is mentioned in the Koran as<br />
well in the Old Testament for her famous visit to King Solomon<br />
in Jerusalem (I Kings, chapter 10).<br />
The population density in the Marib area was estimated to<br />
be 49 persons per km 2 , giving an estimate of 24 500 persons<br />
by 1986. The main activities are agriculture and trade of<br />
goods from Saudi Arabia to the highlands of Yemen. Although<br />
from 1985 onwards the successful exploration and<br />
exploitation of oil and gas is the most important activity in<br />
the area in terms of macro economy, the local population is<br />
hardly involved in these activities.<br />
Meteorology and hydrology<br />
For the Marib area, the principal source of water is the catchment<br />
of the Wadi Dhana. Its runoff-generating area covers<br />
8200 km 2 . Average rainfall in this area is estimated to be 140<br />
mm per year. Rainfall in the Marib area itself is estimated to<br />
be less than 100 mm per year. Most of the rain falls only a<br />
few days a year. The highest daily rainfall recorded prior to<br />
1989 was 65.8 mm at the southern boundary of the Wadi<br />
Dhana, the highest daily rainfall registered in the runoffgenerating<br />
zone of the catchment area in the period 1985-<br />
1989 was 39 mm. The mean annual runoff of the Wadi<br />
Dhana was 104 million m 3 (calculation based on the observations<br />
in the period April 1, 1986-April 26, 1989).<br />
In Marib, the temperature is high with an annual average of<br />
26.4 °C, the relative humidity is low with an annual average<br />
Fig. 1 Looking from south sluice gate of ancient Marib dam to north<br />
sluice gate.<br />
The Kingdom of Sheba was prosperous and its power was<br />
based on trade, both by sea (to and from India and the Persian<br />
Gulf) and land routes (the frankincense roads in the<br />
Arabian peninsula). Camels were first domesticated for<br />
freight in the second millennium B.C. and were soon used to<br />
transport the highly valuable incense along a network of<br />
oasis trading stations. Marib, capital city of the kingdom, was<br />
the focal point of this trade route. The Sabaeans built the<br />
Marib dam to protect the area against flash floods and to<br />
develop an irrigated agriculture on the land around the city.<br />
The dam was considered one of the wonders of the ancient<br />
world and played an important role in the economic<br />
strength of the Sabaen rulers. The Kingdom of Sheba is de-<br />
<strong>Dam</strong> <strong>edition</strong> | Double Issue 2007/2008 | 69
Ingeokring <strong>News</strong><strong>letter</strong><br />
scribed as a fertile land. The land was cultivated by controlling<br />
floodwater in the ‘wadis’, and had fertile gardens and<br />
fields with fruits and spices.<br />
The ancient dam was not intended to create a reservoir that<br />
could be drawn all over the year round. The main object was<br />
flood control, i.e. to catch and divert the unpredictable<br />
floods resulting from rainfall in the mountainous catchment<br />
area and secondly to raise the water to the level of the agricultural<br />
land at both sides of the wadi known as the two<br />
gardens. Raising this water level made it possible to distribute<br />
the water over distant fields, so extending the irrigated<br />
agricultural area.<br />
<strong>Dam</strong> construction and irrigation scheme<br />
Prior to the construction of the ancient Great Marib <strong>Dam</strong>, a<br />
smaller diversion dam existed in the Wadi As Sudd. The remnants<br />
are located approx. 300 m to the east of the ancient<br />
Great Marib <strong>Dam</strong> in the centre of the valley. It is estimated<br />
that this dam was built 1 000-2 000 years before the Great<br />
Marib <strong>Dam</strong>. It was 55 m long and 30 m wide, built with<br />
stones as big as 2 m which were cemented with lead. However,<br />
the attempts to maintain this structure for irrigation<br />
were not successful due to the accumulation of sediment<br />
and deposits.<br />
The initial Great Marib <strong>Dam</strong> was built around 750 B.C. The<br />
dam was a simple earth structure, 580 m in length and is<br />
estimated to have been 4 m high. It ran straight across the<br />
wadi between high rocks on the southern side to a rock<br />
shelf on the northern bank belonging to the Jabal al Balaq<br />
mountains. The dam was built slightly downstream of the<br />
narrowest point in the Wadi Dhana to allow space for a natural<br />
spillway and sluices between the northern end of the<br />
dam and the high rocky cliff. The initial storage capacity was<br />
about 55 million m 3 .<br />
Around 500 B.C. the dam was heightened. The second structure<br />
was a 7 m high earth dam. The cross-section was triangular<br />
with both faces sloping at 45 degrees. The water face<br />
(i.e. the upstream slope) was covered with stones set in mortar<br />
to make the dam watertight and to resist the erosive<br />
effects of waves. The final form of the Marib dam was<br />
reached after the end of the rule of the Kingdom of Sheba.<br />
From 115 B.C. onwards the ruling people in Southern Arabia<br />
were the Himyarites and the next major reconstruction appears<br />
to be a Himyarite work. This reconstruction led to a<br />
new 14 m dam with elaborate water works at both ends.<br />
Like any irrigation scheme, Marib faced an ever increasing<br />
threat from silt. The seasonal floods brought each year<br />
about 2.5 million m 3 of silt which was either held behind the<br />
dam or spread over the irrigated land. As a result, the level<br />
of the irrigated land rose about 1 cm a year or about 1 m<br />
each century. The great dam functioned for about a thousand<br />
years, during which time the level of the two gardens<br />
must have risen by about 10 metres. Upstream of the dam a<br />
mass of sediment piled up as well. A considerable amount is<br />
nowadays still found at the northern sluice system. The Sabaeans<br />
and their successors raised the levels of the sluice<br />
gates, north and south, they built up the overflow weir on<br />
the north sluice and they heightened the main wall, but it<br />
was a struggle they could not win. It is estimated that the<br />
fields could be flooded to a depth of 60 cm and the total<br />
area irrigated amounted to around 9600 hectares. The total<br />
population was probably between 30 000 and 50 000. The<br />
fields were situated at a short distance from the two sluices.<br />
At the north side the fields extended at a distance of 3 km<br />
from the wadi. The pattern of those fields was still clearly<br />
visible on the aerial photographs of the area taken in 1974.<br />
Southern sluice system<br />
The southern sluice system was known as ‘Marbat el-Dimm’.<br />
It is a smaller and less complicated structure than the north<br />
but was in much better condition in 1987. The spillway was<br />
an overfall located about 7 metres below the top of the<br />
dam, the spillway width was 3.5 m.<br />
Northern sluice system<br />
The northern system of sluices included an overfall spillway<br />
and a channel outlet. The channel outlet was located between<br />
the spillway and the earth dam, and it contained one<br />
great wall over 140 m long, about 9 m thick and from 5 to 9<br />
m high. This system conducted water from the northern end<br />
of the dam through a single 1 000 m long and 12 m wide<br />
canal to a rectangular structure that divided the water entering<br />
into twelve different streams.<br />
At the dam, the discharge flowing into the canal was controlled<br />
by two gates. The overfall gates were 2.5 m wide, and<br />
the maximum gate openings were 1 m and 4 m below the<br />
dam crest. In the initial section of the canal, the canal walls<br />
widened to form a basin of about 23 m wide and 65 m long<br />
(essentially the length of the northern wall) which acted as a<br />
settling basin for heavier material carried by the wadi. The<br />
1000 m long canal had earth walls that were covered with a<br />
cemented stone lining on the inside (i.e. water side). The<br />
cross-sections of the canal and of the settling basin were<br />
approximately rectangular.<br />
The spillway was a 40 m wide overfall with a broad unlined<br />
rock crest. The crest elevation of the overflow spillway was<br />
located 3 m below the height of the dam and the spillway<br />
was not gated.<br />
<strong>Dam</strong> <strong>edition</strong> | Double Issue 2007/2008 | 70
Ingeokring <strong>News</strong><strong>letter</strong><br />
End of the ancient Marib dam<br />
Silt, as already mentioned above, presented an evergrowing<br />
threat to the functioning of the entire irrigation<br />
scheme. The dam suffered numerous breaches caused by<br />
overtopping and maintenance works were substantial. At<br />
the same time economic and political factors weakened<br />
society’s ability to respond to the growing natural challenges.<br />
Fig. 2 Ancient Marib dam from south sluice system flow channel.<br />
After the wind patterns in the Indian Ocean and in the Red<br />
Sea became better known and understood, transport over<br />
sea became a preferred alternative for the route over land in<br />
the first century A.D. The economic as well as political power<br />
ebbed from Marib. With the diminishing power of the local<br />
leaders the necessary ability for a proper management was<br />
absent. Mobilisation of sufficient work force and capital to<br />
maintain or repair the system became impossible. In 575<br />
A.D. the dam was overtopped and never repaired. Some of<br />
the people remained but most of them emigrated either<br />
north into the Hejaz or eastwards to Oman and the Arabian<br />
Gulf. The final destruction of the dam was a milestone in the<br />
history of the Arabic peninsula. The fame of the Marib dam<br />
was such that its final destruction is recorded in the Koran<br />
(Sura 34 15-17).<br />
The new Marib dam<br />
Introduction<br />
The new dam was funded by Sheikh Zayed, ruler of Abu<br />
Dhabi and president of the United Arab Emirates and by the<br />
Abu Dhabi Fund for Arab Economic Development. Sheikh<br />
Zayed’s ancestors are believed to have lived in Marib and to<br />
have migrated to the Gulf when the ancient dam finally collapsed.<br />
The dam was built by the Turkish contractor Dogus<br />
Construction and Trading from Istanbul. The design, engineering<br />
and supervision were executed by the Swiss company<br />
Electrowatt Engineering Services Ltd., Zurich. Contrary<br />
to the ancient dam the new dam is intended to create a<br />
reservoir that can be drawn all over the year round.<br />
The new dam is situated at a distance of 3 km upstream<br />
from the location of the ancient dam. The foundation stone<br />
of the new dam was laid in October 1984, construction was<br />
achieved according to plan. The dam was inaugurated in<br />
December 1986. It was remarkable that during the construction<br />
there was no flood of any importance, but within<br />
months after closing of the dam a flash flood of 135 million<br />
m 3 filled the reservoir for one third of the maximum capacity<br />
in April 1987.<br />
For hundreds of years following the destruction of the dam<br />
till the 1970’s, spate irrigation was applied along the Wadi As<br />
Sudd downstream of the ancient dam. Based on aerial photo<br />
interpretation it was estimated that the irrigated area was<br />
approximately 2 500 hectares. In the 1970’s groundwater<br />
pumps driven by diesel engines were introduced in the area.<br />
This, in combination with a rapidly increasing use of drilling<br />
rigs, resulted in a considerable increase in drilled wells and<br />
hence in groundwater exploitation in the area.<br />
Fig. 3 Marib <strong>Dam</strong> and reservoir with survey boat (top), seismic reflection<br />
sediment sub-bottom profiler (bottom).<br />
<strong>Dam</strong> <strong>edition</strong> | Double Issue 2007/2008 | 71
Ingeokring <strong>News</strong><strong>letter</strong><br />
<strong>Dam</strong> construction, irrigation scheme and groundwater<br />
abstraction<br />
The new dam is basically a small concrete core that reaches<br />
the bedrock, surrounded by a larger clay core and 3 million<br />
m 3 of earth fill and rocks. It is 38 m high, 763 m long and 227<br />
m wide at the base and 6 m wide at the crest. The reservoir<br />
has a capacity of 396 million m 3 . The dam was designed to<br />
cope with an average annual inflow of 200 million m 3 and it<br />
was estimated that 150 million m 3 will be released per annum<br />
once the irrigation scheme is fully in operation. Outflow<br />
into the Wadi As Sudd downstream of the dam is controlled<br />
by means of a radial gate construction at the end of a<br />
tunnel in the dam. The maximum capacity of the gate is only<br />
35 m 3 /s. Approximately 10 and 14.5 km downstream of the<br />
dam, intake structures have been built in the wadi bed to<br />
divert the released water into the main canals of the irrigation<br />
system. The object of the irrigation project was to irrigate<br />
an overall area of about 6 900 hectare by means of integrated<br />
development of surface water and ground water.<br />
By recharging the aquifer it remains possible to continue the<br />
traditional well irrigation. This well irrigation was the main<br />
source of water during the centuries between the collapse<br />
of the ancient dam and the closing of the new dam in 1985.<br />
Implementing a water resources management plan in the<br />
Marib area turned out to be extremely difficult due to the<br />
special social circumstances. The relations between the different<br />
tribal communities in the area and between the tribes<br />
and governmental authorities were and are still subject to<br />
tension and conflict. Although the construction of canals of<br />
the primary and secondary irrigation network was completed<br />
at the end of 1989, there was no sign of operation of<br />
the scheme at that time. The inhabitants not only continued<br />
well irrigation but increased groundwater abstraction. The<br />
amount of groundwater abstraction was estimated to be 29<br />
million m 3 per year in 1977-1978. Abstraction rate was estimated<br />
to have increased to 136 million m 3 per year in 1987.<br />
In the framework of the WRAY project a further average<br />
increase of extraction of 22 million m 3 per year was observed<br />
in the period 1985-1989. This significant increase in the extraction<br />
of groundwater resulted in a considerable fall in<br />
groundwater level in the area, especially in the period 1985-<br />
1989, the period between the closing of the new dam and<br />
the replenishment of groundwater by releasing water from<br />
the reservoir. The irrigated area by groundwater extraction<br />
had increased to approximately 10 000 hectares in 1989.<br />
When the scheme is in operation, water will be released<br />
from the lake and enter the old wadi bed (Wadi As Sudd)<br />
downstream of the dam. It is anticipated that half of the<br />
water released from the lake will infiltrate into the wadi bed<br />
and recharge the underlying aquifer, the other half will be<br />
diverted at the two mentioned intake structures. From these<br />
intake structures a network of primary canals was constructed<br />
in the period 1986-1989. Two main canals reach<br />
approx. 18 km from the second structure towards the northeast.<br />
Fig. 5 Exploratory drilling of aquifers in Marib region.<br />
Reliable recent information concerning the period 1989-<br />
2007 could not be obtained, but by studying modern satellite<br />
images it may be concluded that the total irrigated area<br />
has extended further. It may be assumed as well that the<br />
main source of water is still the extraction of groundwater<br />
through private wells of farmers.<br />
Observations on the reservoir in the period 1986-1989<br />
Fig. 4 Geo-electric survey of aquifer in Marib Region.<br />
As already mentioned, the mean annual inflow in the lake<br />
was 104 million m 3 in the observed period. The Marib <strong>Dam</strong><br />
and irrigation project was designed by Electrowatt for an<br />
average recharge into the reservoir of 196 million m 3 per<br />
year. This estimated amount exceeded the annual flow observed<br />
in the period 1985-1990. The year to year variation of<br />
stream flow was large, varying from 135 million m 3 to 87<br />
million m 3 a year. The mean annual reservoir evaporation<br />
was 2 093 mm, i.e. 34.9 million m 3 . This is a considerable and<br />
concerning loss.<br />
<strong>Dam</strong> <strong>edition</strong> | Double Issue 2007/2008 | 72
Ingeokring <strong>News</strong><strong>letter</strong><br />
In the period observed (April 1986-May 1989) only 122.5<br />
million m 3 was released to replenish the aquifer. This is only<br />
27% of the designed release capacity.<br />
The WRAY project paid special attention to the sedimentation<br />
rate in the Marib reservoir. This in view of the fact that<br />
evaporation of this shallow reservoir will increase with increasing<br />
surface of the lake caused not only by inflow of<br />
water, but by influx of sediment as well. Thickness and location<br />
of recent sedimentation was mapped by application of<br />
a shallow sub-bottom profiler. Data obtained on the lake in<br />
February/March 1989 revealed that the total volume of sediment<br />
accumulated in the lake was 4.5 million m 3 over an<br />
estimated survey area of 8.2 km 2 . This means that the storage<br />
of the reservoir was reduced by 1.12% in its first three<br />
years of impounding and that the average sediment transport/supply<br />
into the reservoir is approximately 1.5 million<br />
m 3 /year. Based on these observations storage capacity reduction<br />
would not be an immediate problem.<br />
Literature<br />
Chanson, H. (2004). A study of the Marib dam and its sluice<br />
system (115 B.C.-575 A.D.). The Hydraulics of Open Channel<br />
Flow: An Introduction. Butterworth Heinemann, Oxford.<br />
Maurenbrecher, P.M. (1991). Water resources assessment in<br />
the Republic of Yemen. Report on presentation (for the<br />
Mijnbouwkundige Vereeniging, Delft) by ir. F.C. Dufour,<br />
Ingeokring Nieuwsbrief, lente-zomer editie, pp. 41-43.<br />
Schmidt, J. (1987). Die sabäische Wasserwirtschaft von<br />
Marib. Jemen. 3000 Jahre Kunst und Kultur des glücklichen<br />
Arabien. Pinguin-Verlag, Innsbruck/Umschau-Verlag, Frankfurt<br />
am Main.<br />
Tatham, D. (1987). The two gardens. A daytripper’s guide to the<br />
antiquities of Marib. Private publication, Sana’a.<br />
Uil, H. & F.C. Dufour (1990). Water resources Wadi Adhanah<br />
and Marib area. Main report WRAY 15, Ministry of oil and<br />
mineral resources-General department of water resources<br />
studies & TNO-DGV Institute of applied geoscience, Sana’a &<br />
Delft.<br />
Fig. 6 Levelling at run-off measuring station, Wadi Adhanah.<br />
However, tremendous amounts of sediment deposited in<br />
the valleys of the Wadi Dhana catchment area may be funnelled<br />
into the reservoir should a really high flash flood occur.<br />
The observation period was characterised by floods<br />
which were mainly low, except for the flow of April 1987<br />
which was moderate. Consequently, based on the observed<br />
rainfall/runoff amounts for the observed period, the reduction<br />
of the storage capacity of the Marib reservoir would<br />
only be 15% after 40 years, which should not cause immediate<br />
concern. However, for a more realistic prediction of the<br />
reduction in storage capacity, medium and high floods (for<br />
which sediment loads of 2% and 5% to 14% respectively are<br />
assumed) should be included. One high flood period could<br />
reduce the reservoir capacity by 6 to 17 million m 3 , assuming<br />
sediment loads of 5% to 14%. Different storage reduction<br />
models based on medium and high flood sequences predict<br />
a storage reduction between 15% and 35% within 30 years.<br />
<strong>Dam</strong> <strong>edition</strong> | Double Issue 2007/2008 | 73
<strong>Dam</strong> <strong>edition</strong> | Double Issue 2007/2008 | 74<br />
Ingeokring <strong>News</strong><strong>letter</strong>
Ingeokring <strong>News</strong><strong>letter</strong><br />
Excursie GeoCentrifuge (GeoDelft), Delft<br />
Leon van Paassen<br />
Op 7 juni 2007 organiseerde de Ingeokring een excursie<br />
naar de GeoCentrifuge bij GeoDelft. De GeoCentrifuge van<br />
GeoDelft is een van ‘s werelds krachtigste centrifuges voor<br />
het uitvoeren van onderzoek voor ontwerp en uitvoering<br />
van uitdagende civieltechnische werken op slappe grond.<br />
Deze werken zijn vaak uitdagend door hun schaal en/of<br />
complexiteit. Bij de kenmerkende onderzoeksvragen zijn<br />
grond en constructie beide van belang. Proeven zijn uitgevoerd<br />
voor grootschalige bouwwerken zoals bruggen, tunnels,<br />
kadeconstructies, dijklichamen onder statische en/of<br />
dynamische belastingen, etc.<br />
Kenmerkend voor de centrifuge is dat het onderzoek wordt<br />
uitgevoerd onder een kunstmatig verhoogd zwaartekrachtveld<br />
op kleiner verschaalde modellen van de werkelijkheid.<br />
Deze ‘kunstmatige verhoging’ is nodig om de fysische processen<br />
die de interactie tussen grond, grondwater en de<br />
constructie bepalen, waarheidsgetrouw te modelleren. De<br />
krachten die hierbij worden opgewekt zijn enorm. Zo kan<br />
een model met een massa van maximaal 2 000 kg onder een<br />
kunstmatig krachtveld van 300 keer groter dan de zwaartekracht<br />
worden onderzocht. Het zal duidelijk zijn dat dit veel<br />
eist van de onderzoeksfaciliteit, het model en de modelleur.<br />
Onder water storten van klei - Voorbeeld van een winnend<br />
prijsvraag geocentrifuge-onderzoek<br />
Vera van Beek<br />
Het onderwater storten van kleibrokken wordt in de praktijk<br />
uitgevoerd ten behoeve van de vorming van een waterdichte<br />
laag. Het wordt vaak toegepast in het voorland van dijken<br />
of voor het aanbrengen van een onderlaag voor een stortgebied.<br />
Het is echter nooit onderzocht in hoeverre de gestorte kleibrokken<br />
daadwerkelijk een ondoorlatende laag vormen. Als<br />
vuistregel wordt aangehouden om kleibrokken van circa 15<br />
cm te storten, met een totale dikte van circa 2 m. Er wordt<br />
aangenomen dat de kleibrokken onder invloed van water<br />
en/of hun eigen gewicht tot een ondoorlatende laag samenvoegen.<br />
Ook wordt in sommige situaties getracht om de<br />
kleibrokken samen te drukken met behulp van een kraanbak<br />
of slee.<br />
Aan de excursie was een prijsvraag voor studenten verbonden.<br />
Zij kregen de uitdaging om te komen met een onderzoeksvoorstel<br />
voor een (kleinschalige) proef in de GeoCentrifuge.<br />
Het beste voorstel zou door de studenten zelf, met<br />
hulp en begeleiding van (onder meer) GeoDelft, daadwerkelijk<br />
worden uitgevoerd. Op het moment van dit schrijven<br />
staat deze prijsvraag nog steeds open.<br />
Om een idee te krijgen wat uitvoering van een dergelijke<br />
proef inhoudt kregen we een presentatie over de centrifuge<br />
en een voorbeeld project door Paul Schaminee en Vera van<br />
Beek van GeoDelft, gevolgd door een rondleiding langs de<br />
centrifuge en bijbehorende testfaciliteiten.<br />
Fig. 1 De opstelling gereedgemaakt voor de eerste proevenserie, klei in<br />
(blauw gekleurd) water, lucht en (rood gekleurde) olie.<br />
Om de vraag te kunnen beantwoorden of kleibrokken een<br />
ondoorlatende laag vormen, is gekeken naar maatgevende<br />
mechanismen die een rol spelen bij de vorming van de laag;<br />
de verweking van klei ten gevolge van de interactie met<br />
water, zoals slaking en dispersie, en het samendrukken van<br />
de kleibrokken onder hun eigen gewicht. Het is onbekend in<br />
welke mate deze processen een rol spelen. Ook is onduidelijk<br />
of het belasten van klei de doorlatendheid verlaagt. Deze<br />
variabelen zijn onderzocht in een korte kijkproef in de geocentrifuge.<br />
<strong>Dam</strong> <strong>edition</strong> | Double Issue 2007/2008 | 75
Ingeokring <strong>News</strong><strong>letter</strong><br />
In de praktijk duren de genoemde processen enkele maanden.<br />
In de geocentrifuge worden de processen versneld<br />
door de vergrote zwaartekracht. Hierdoor kan binnen enkele<br />
uren getest worden wat de verandering in doorlatendheid<br />
is.<br />
De opstelling bestaat uit een drietal kolommen (Fig. 1) waarin<br />
op schaal de situatie van gestorte kleibrokken is nagebootst.<br />
In de eerste testserie zijn kleibrokken gestort in respectievelijk<br />
water, lucht en olie, om de processen die onder<br />
invloed van water plaatsvinden (slaking, dispersie) te kunnen<br />
onderscheiden van de processen die niet beïnvloed<br />
worden door de aanwezigheid van water (deformatie). De<br />
doorlatendheid is vervolgens vergeleken door middel van<br />
een doorstroomtest. De kleibollen in water bleken de meest<br />
ondoorlatende laag te vormen. De intrede van het water in<br />
de kleibollen zorgt voor het uiteenvallen van de klei. In de<br />
kolommen met olie en lucht kon geen water intreden, waardoor<br />
er geen slaking van de klei optrad, alleen samendrukking.<br />
De kleilagen in deze kolommen waren dan ook aanzienlijk<br />
meer doorlatend.<br />
In de eerste test was Speswhite klei (geproduceerd uit kleipoeder)<br />
gebruikt, welke in dispersiegedrag niet geheel overeenkomt<br />
met natuurlijke klei. In de tweede test is daarom<br />
gekozen om natuurlijke kleien met verschillende eigenschappen<br />
te gebruiken. Hoewel het deformatie-, slaking- en<br />
dispersiegedrag van de verschillende kleisoorten verschillend<br />
bleek te zijn, is er geen verschil in doorlatendheid waargenomen<br />
tussen de drie kolommen. Geen van de kleien<br />
resulteerde in een slecht doorlatende laag, zoals waargenomen<br />
in de eerste test.<br />
Fig. 2 De onderkant van de kleilaag na uitvoeren van de proef. Het is<br />
duidelijk te zien dat het blauwe water in de klei gedrongen is. Bij de klei<br />
in lucht en olie is er nog ruimte aanwezig tussen de kleibrokken.<br />
De invloed van dynamische belasting, zoals die in de praktijk<br />
wordt toegepast, is in de derde proef gesimuleerd door het<br />
plaatsen van een statische belasting op de klei (natuurlijke<br />
klei). De klei in de drie kolommen werd belast met 0, 10 en<br />
30 kPa. Uit de doorlatendheidstest is gebleken dat belasting<br />
van de klei de doorlatendheid sterk beïnvloedt. Terwijl de<br />
resultaten bij de onbelaste klei identiek waren aan de resultaten<br />
in de vorige proef, was de met 10 kPa belaste klei een<br />
stuk minder doorlatend. De met 30 kPa belaste klei liet zelfs<br />
helemaal geen water meer door.<br />
Als conclusie kan gesteld worden dat de doorlatendheid<br />
bewerkstelligd wordt door een combinatie van deformatie<br />
en slaking. Het belasten van klei om de doorlatendheid te<br />
verkleinen is doeltreffend.<br />
<strong>Dam</strong> <strong>edition</strong> | Double Issue 2007/2008 | 76
Ingeokring <strong>News</strong><strong>letter</strong><br />
Book review:<br />
Carbonate Sediments and Rocks. A Manual for Earth Scientists and Engineers,<br />
Colin Braithwaite<br />
Peter Verhoef, Royal Boskalis Westminster nv<br />
This book is written to fulfil the need felt for an undergraduate<br />
text on carbonate rocks for geologists and earth scientists<br />
working within the field of geotechnical and applied<br />
engineering. The author believes that it might also be useful<br />
for engineers and non-specialists working in the petroleum<br />
and minerals industries. However, I think that most engineers<br />
or non-specialists would find it hard to work through<br />
this book since a lot of basic and also more advanced knowledge<br />
of geology is assumed. Yet, for geologists or engineering<br />
geologists this book of only 164 pages contains a lot of<br />
information.<br />
To learn something from this book, you do have to read the<br />
complete text of these chapters. It is not possible to divert to<br />
the colour plates in the middle of the book or to the graphs,<br />
tables or illustrations, scan some text, and grasp what is<br />
going on. But not to worry, the chapters are short and the<br />
writing is concise and economic. The author succeeds in<br />
sharing his decade’s long experience of working and researching<br />
carbonate rocks. For me, the main importance of<br />
this book lies in the chapters outlining carbonate geology.<br />
The applied chapters, from 13 onwards, are less illuminating<br />
for practicing engineering geologists.<br />
The subjects treated can best be indicated by listing the<br />
chapters of the book:<br />
• The Mineralogy and Compositions of Carbonate Rocks<br />
and Sediments<br />
• Characteristics of Carbonate Sediments<br />
• Marine Carbonate Environments<br />
• Evaporites Associated with Carbonates<br />
• Continental Carbonate Environments<br />
• Classification of Carbonate sediments and Rocks<br />
• Carbonate Diagenesis: from Sediment to Rock<br />
• Dolomites<br />
• Calcrete<br />
• Limestones, Dolomites and Karst<br />
• Karst Hydrogeology<br />
• Engineering Properties of Carbonate Sediments and<br />
Rocks<br />
• Methods of Extraction of Carbonate Sediments and<br />
Rocks<br />
• Engineering Case Histories: The Hazards of Karst<br />
• Hydrocarbons, Mineral Deposits and Carbonates<br />
• Carbonates and Conservation<br />
Grain size fractions resulting from mechanical breakdown and biological<br />
breakdown (bio-erosion) in reef systems (Figure 2.13 of the book).<br />
<strong>Dam</strong> <strong>edition</strong> | Double Issue 2007/2008 | 77
Ingeokring <strong>News</strong><strong>letter</strong><br />
The main difference with other sedimentary materials is that<br />
most carbonate grains originate within the basin of deposition<br />
and many show little influence of transport. In the book,<br />
the Bahama Banks are chosen to illustrate the development<br />
of a present-day marine carbonate environment. A clear<br />
picture of the development of beaches, tidal margins, restricted<br />
shelves and lagoons, open shelves, oolite shoals,<br />
grapestone and hardgrounds and reef systems is given.<br />
Attention is given to the origin of the carbonate. Carbonate<br />
mud may, for example, originate from direct precipitation in<br />
the form of aragonite needles, or be biogenic. Shallow platforms,<br />
such as the Bahama Banks, act as carbonate factories,<br />
generating an excess of sediment that is swept off during<br />
storms to be deposited in deeper water. The established<br />
rates of production in some reef environments are up to 13<br />
kg/m2/yr. It is striking that most of the sand grains are not<br />
generated by erosion due to wave action, but by bioerosion.<br />
Biological breakdown occurs through the action of<br />
sponge, sea-urchins and fish grazing on coral. Parrot fish<br />
produce 0.5 kg/m2/yr of particles ranging from mud to fine<br />
sand. A large individual can take as much as 82 mg coral in a<br />
single bite. Boring echinoderm produce sand-size fragments<br />
with production estimates of more than 5 kg/m2/yr. Bioerosion<br />
generates, thus, a significant proportion of the sediment<br />
and is far more important than conventional erosion<br />
by physical processes. Roughly half of the carbonate produced<br />
in framework areas of coral reefs on St. Croix in the<br />
Caribbean is remobilised by bio-erosion and 75% of this is<br />
sand.<br />
marine waters often need a local trigger to cause precipitation.<br />
I learned that each environment needs a closer examination<br />
to understand history and process of cementation.<br />
Throughout the book, carbonate environments from all over<br />
the world are discussed. Many of them are relevant for the<br />
field I work in, which is dredging and coastal engineering.<br />
Much of the information that is new for me comes from the<br />
results of petrographic study of the soils and rocks. Nowadays<br />
there is a much better understanding of the processes<br />
of nucleation and crystallisation, calcitisation<br />
(transformation to crystalline calcite involving a liquid phase<br />
at the grain boundaries) and recrystallisation (solid state<br />
transformation) that are involved. Braithwaite effortlessly<br />
succeeds to bring this information across in the various carbonate<br />
environments discussed. The author illustrates with<br />
well chosen examples how he thinks the rocks have formed.<br />
I find that from these descriptions often a good picture of<br />
the engineering situation of a particular carbonate type can<br />
be obtained. It is also good to know that some of these, and<br />
particularly reef areas, have a complex and often unpredictable<br />
distribution of massive, cemented and uncemented<br />
parts. Better understanding of the way beach rocks, aeolianites,<br />
calcrete and all those other forms of carbonate<br />
rocks are formed indeed will help us to better model and<br />
foresee their engineering behaviour.<br />
I do welcome this book.<br />
One of the guiding geochemical principles to understand<br />
the origin of carbonate sediments that Braithwaite reiterates<br />
throughout the book, is the role of CO 2 . The solubility of<br />
calcium carbonate in de-ionised water is comparable to<br />
quartz; increased solubility in natural waters is due to the<br />
presence of dissolved CO 2 . This has to do with the forming<br />
of carbonic acid H + -<br />
+ HCO 3 in the water. The well known<br />
anomalous behaviour of calcium carbonate to dissolve in<br />
colder water has to do with the ability to dissolve more CO 2<br />
in colder water, thereby generating more carbonic acid.<br />
What struck me is that this principle also seems to work at<br />
micro-scale. The growth of tufa (travertine) at the site where<br />
underground streams emerge from cave systems in karst<br />
areas, for example, is related to the presence of plants, algae,<br />
cyanobacteria and bacteria. The extraction of CO 2 from the<br />
water during photosynthesis causes a localised increase in<br />
alkalinity and results in precipitation of calcium carbonate. I<br />
used to think that only the exposure to the oxygen in the air<br />
atmosphere, when the saturated waters emerge from the<br />
underground are enough to cause precipitation. But apparently<br />
in many cases more is needed. Also supersaturated<br />
164 pages with colour plates in the middle of the book<br />
Whittles Publishing, Caithness, Scotland; 2005<br />
ISBN 1-870325-39-7<br />
£ 40,-<br />
<strong>Dam</strong> <strong>edition</strong> | Double Issue 2007/2008 | 78
Ingeokring <strong>News</strong><strong>letter</strong><br />
GeoGolf<br />
Robert Hack<br />
On August 30, 2007 a new episode of GeoGolf was played.<br />
Nine geotechnical engineers and engineering geologists did<br />
their utmost best to show that they do not only control the<br />
ground, but also the behaviour of a stupid ball on the<br />
ground. The match was played on the Rijswijkse Golfclub.<br />
The weather was good except for the last ten minutes when<br />
it started to rain and playing in the last flight, the author got<br />
soaked. The competition was fierce and after 18 holes Martin<br />
Kroezen showed the best control over the bouncing golf<br />
ball and won. Runner-up was Bas Hemmen. An extensive<br />
dinner gave the opportunity to discuss the peculiarities of<br />
the game of golf and the profession in which ground can<br />
also behave seemingly quite erratic. The next episode of<br />
GeoGolf will likely be played on the Hooge Bergsche near<br />
Rotterdam. Any golf-playing geotechnical engineer, engineering<br />
geologist or those otherwise involved with geotechnics<br />
are very welcome to join and should contact Bas Hemmen<br />
at GeoDelft (b.r.hemmen@geodelft.nl) or Robert Hack<br />
at ITC (hack@itc.nl).<br />
Dirk Luger as match referee handing over the first price to Martin<br />
Kroezen with an approving Floris Schokking.<br />
GeoGolf dinner. Clockwise from bottom left: Michiel Maurenbrecher,<br />
Bas Hemmen, Martin Kroezen, Robert Hack, Jos Maccabiani, Dirk Luger,<br />
Anke Rusch and Joost Wentink.<br />
<strong>Dam</strong> <strong>edition</strong> | Double Issue 2007/2008 | 79
Ingeokring <strong>News</strong><strong>letter</strong><br />
Thesis abstracts<br />
Plaxis Soft Soil Creep: de toepassing van een isotroop<br />
kruipmodel op de anisotrope ondergrond<br />
Rens Servais<br />
In met name West-Nederland bestaat de ondergrond voornamelijk<br />
uit slappe klei- en veenlagen. Bij het aanbrengen<br />
van een maaiveldbelasting zullen er in deze slappe grondsoorten<br />
verticale en horizontale vervormingen optreden.<br />
Voor het berekenen van de vervormingen zijn verschillende<br />
modellen beschikbaar. Het 3-dimensionale SSC model is<br />
echter het eerste materiaalmodel in Plaxis waarin kruip is<br />
geïntroduceerd. Dit model is gebaseerd op het 1-<br />
dimensionale a,b,c-Isotachenmodel. Uit praktijkervaring<br />
blijkt dat bij de aanbevolen omrekening van de a,b,c-<br />
Isotachen in SSC samendrukkingsparameters de zetting van<br />
het a,b,c-Isotachenmodel niet in overeenstemming is met<br />
de zetting volgend uit een 1D SSC berekening. Dit is de<br />
belangrijkste reden dat dit onderzoek is opgesteld. Er is onderzoek<br />
gedaan naar de oorzaak van dit verschil, wat vervolgens<br />
is gevalideerd aan de hand van een samendrukkingsproef<br />
en een case. Verder is het SSC model beschreven en<br />
gevalideerd aan 2D vervormingen. Het algemene doel van<br />
dit onderzoek is het verbeteren van de praktische toepasbaarheid<br />
van het SSC model.<br />
Uit modeltechnisch onderzoek blijkt dat de zetting van het<br />
SSC- en a,b,c-Isotachenmodel bij een 1D berekening exact<br />
met elkaar overeen moeten komen onder de voorwaarde<br />
dat de verhouding horizontale/verticale spanning constant<br />
is. Bij een niet constante verhouding ontstaan er verschillen<br />
die normaliter te verwaarlozen zijn. De simulatie van een<br />
samendrukkingsproef bevestigt dit, de No-Recess case<br />
echter niet. De oorzaak hiervan is het op een andere wijze in<br />
rekening brengen van onderwater zakken (bij de samendrukkingsproef<br />
speelt onderwater zakken geen rol). In Plaxis<br />
(SSC) is onderwater zakken correct geïmplementeerd, MSettle<br />
(a,b,c-Isotachenmodel) benaderd onderwater zakken. De<br />
verschillen tussen de modellen ontstaan dus t.g.v. de implementatie<br />
in verschillende rekenprogramma’s.<br />
Bij het beschrijven van het SSC model voor 2D vervormingen<br />
blijkt de K 0 -afhankelijke M parameter een belangrijke<br />
nc<br />
modelparameter. Aandacht is daarom besteed aan de<br />
bepaling van deze parameter. Een K 0 -C.R.S. proef geeft realistischer<br />
waarden voor M(K 0 ) dan de vuistregel van Jaky.<br />
nc<br />
Verder heeft de geometriekeuze (axisymmetrisch of plane<br />
strain) en de bepaling van de doorlatendheid significante<br />
invloed op de resultaten. Bij de No-Recess case is de anisotrope<br />
ondergrond gemodelleerd met het isotrope SSC<br />
model. De gevonden horizontale vervormingen sluiten bij<br />
een juiste parameter- (doorlatendheid en M) en geometriekeuze<br />
(axisymmetrisch of plane strain) goed aan bij<br />
de gemeten vervormingen. Voor de zettingen geldt dit<br />
echter niet. Het model overschat de zettingen vooral in het<br />
begin van de ophoogfase. Niettemin lijkt het model de horizontale<br />
en verticale kruip én horizontale/verticale vervormingsverhouding<br />
goed in te schatten. Bij de gekozen parameters<br />
is de anisotrope ondergrond daarmee goed met het<br />
isotrope SSC model te simuleren.<br />
Evaluation of parameters influencing pressure arching<br />
over shallow room-and-pillar mines<br />
Elles Bader<br />
Pressure arching is a well known phenomenon in underground<br />
excavations around the world. However, most information<br />
on arching is empirical and little has been published<br />
on the subject.<br />
In this study, a numerical analysis using FLAC was performed<br />
to investigate the arching effect over room-and-pillar mines.<br />
The effectiveness of pressure arches was investigated by<br />
varying parameters such as total mine span, thickness of<br />
roof layers, thickness of soil overburden, stiffness and<br />
strength of pillars, and roof rock properties. The material<br />
properties used in this analysis are based on experimental<br />
data obtained from the underground limestone quarries in<br />
South Limburg, the Netherlands.<br />
From these numerical simulations, an overview of how various<br />
parameters affect the arching phenomenon was derived.<br />
By assessing these parameters, relationships were<br />
found which make it possible to predict the amount of arching<br />
that occurs and subsequently assess the large scale stability<br />
of the mine system. The width of the excavation and<br />
thickness of the rock overburden are most important for this<br />
assessment.<br />
The results of this numerical analysis increase the knowledge<br />
on arching, which is an important step towards a better<br />
understanding of the stability of all underground structures.<br />
<strong>Dam</strong> <strong>edition</strong> | Double Issue 2007/2008 | 80
Ingeokring <strong>News</strong><strong>letter</strong><br />
Parameters standard<br />
Circumstances Dip PCS average (8)<br />
Processes<br />
Gravity<br />
Dip PCS high (9)<br />
Dip PCS low (5)<br />
Parameters low<br />
Parameters<br />
standard<br />
1.70 1.44 1.95 1.67<br />
Dyke elastic infill 1.63 1.34 NA NA<br />
Dyke ‘magma’ infill see text see text - -<br />
Dyke no infill 1.27 1.07 - -<br />
Pore pressures riftzone see text see text - -<br />
Future Growth + 200m 1.64 1.40 - -<br />
Future Growth + 400m 1.55 1.32 - -<br />
Future Growth + 600m 1.46 1.23 - -<br />
Future Growth + 800m 1.41 1.19 - -<br />
Future Growth + 1000m 1.33 1.12 - -<br />
Massive flank collapse at La Palma: numerical slope stability<br />
models of the Cumbre Vieja volcano<br />
Janneke van Berlo<br />
In 1999, Steven Ward and Simon Day launched a scientific<br />
article which discussed possible tsunami effects in the USA<br />
as a result of a massive flank collapse of the Cumbre Vieja<br />
volcano at La Palma. One problem of their hypothesis is that<br />
the slope instability has not been investigated in a quantitative<br />
way. The research question therefore aims to partially<br />
solve this problem: “Under what boundary conditions could<br />
the Western flank of the Cumbre Vieja volcano start sliding and<br />
at what recurrent times would such mass movement occur?”<br />
Methodology concentrates on integrally modelling three<br />
model attributes (geometry, material and processes) in a<br />
FEM computer model. The table below shows the modelling<br />
results: calculated Factors of Safety for various worst case<br />
scenarios. ‘PCS’ stands for Post Collapse Sequence: a plane<br />
of weakness below the volcano. Magmastatic dyke pressure<br />
at the back of the possible slide volume with magma infill<br />
and excess pore pressures due to the heating of pore water<br />
resulted in vertical failure mechanisms rather than lateral<br />
flank collapses. This is true if the pore pressures are limited<br />
to the rift zone of the volcano.<br />
In conclusion, two mechanisms, dyke intrusion and future<br />
growth, bring the volcano dangerously close to a failure<br />
situation. However, it is important to note that this only occurs<br />
under the input of very conservative parameters and in<br />
a 2D model situation where friction of the sidewalls of the<br />
landslide mass is not taken into account. Additional mecha-<br />
Calculated Factors of Safety for various scenarios in a most dangerous<br />
volcanic cross section.<br />
nisms, like pore pressures occurring inside the PCS, may<br />
further enhance instability and should be investigated in<br />
further research.<br />
Disregarding the uninvestigated mechanisms in the volcano,<br />
the results indicate that overall flank failure at least<br />
requires a combination of thoroughly weakened rock- and<br />
soil mass and steeper flanks than in the current configuration.<br />
This supplements the conclusion: to reach substantial<br />
growth over the full width of the landslide mass necessary<br />
to trigger failure, a time span in the order of 10 000 years will<br />
be required.<br />
Comparing discontinuity surface roughness derived<br />
from 3D terrestrial laser scan data with traditional fieldbased<br />
methods<br />
Ephrem Kinfe Tesfamariam, ITC<br />
Discontinuity surface roughness estimation is very important<br />
in determining the hydro-mechanical properties of rock<br />
masses. The normal ways of roughness estimation have<br />
been made traditionally by visual and simple instrumental<br />
field observations. These methods may require physical<br />
access to the exposed rock faces. This may expose field personnel<br />
to hazardous situations because the measurements<br />
have to be carried out below steep rock faces, in a quarry or<br />
tunnel. The higher parts of a steep exposed rock face are<br />
often difficult to reach. These traditional methods are also<br />
time consuming and subjective. This thesis describes a new<br />
method by which 3D point cloud data obtained by laser<br />
scanning can be used to model and determine discontinuity<br />
surface roughness in an automated way with high detail,<br />
high accuracy, and no human bias. The laser scan technique<br />
is also much faster and safer than the traditional field-based<br />
methods, since no direct physical access is needed to the<br />
rock face.<br />
In order to determine the surface roughness from the 3D<br />
laser scan point cloud data, two point cloud data sets with<br />
an average spatial resolution of 1 cm and 6 cm are used.<br />
These point data sets are interpolated as a 3D virtual surface<br />
model using a scattered data interpolation technique. To<br />
extract the 3D surface roughness from the 3D virtual surface<br />
model, the mean orientation of circular windows with diameters<br />
of 5, 10, 20 and 40 cm were computed. The largescale<br />
directional roughness is also extracted by cropping<br />
and fitting narrow strips using curve fitting techniques.<br />
The results revealed that laser scan data can be used to<br />
model and estimate rock surface roughness. The extracted<br />
directional large-scale roughness profiles are comparable<br />
<strong>Dam</strong> <strong>edition</strong> | Double Issue 2007/2008 | 81
Ingeokring <strong>News</strong><strong>letter</strong><br />
and can be used in a rock mass index classification system.<br />
These can also be used to estimate roughness using the<br />
standard reference roughness determination profiles. However,<br />
it is difficult to compare the field-based disc orientations<br />
with the circular windows mean orientation of the<br />
laser scan data. This is due to the low resolution point cloud<br />
data set and possible shifting of the exact location of the<br />
sample grid. The field-based instrument error and the dead<br />
zone due to inclination of undulations with respect to the<br />
scanner position have also appreciable influence on the<br />
possible relation of these methods.<br />
The investigation on the formulation of a new design<br />
code for MV-piles<br />
Roeland van Hof<br />
This thesis investigates whether the current design code for<br />
MV-piles is still valid or needs to be updated, as these days<br />
piles used are much larger than when the current code was<br />
formulated. In order to check if the current code is still valid,<br />
the α t -factor in the formula below was calculated for 47<br />
piles, using the bearing capacity derived from the pile loadtests.<br />
FPile = qc<br />
.L.O.<br />
α<br />
av t<br />
Risks in the production of geothermal energy in clayey<br />
soils as existing in the Netherlands<br />
Rene van Hinthum<br />
Geothermal energy is energy derived from the natural heat<br />
of the earth. It is a sustainable form of energy and it is being<br />
used more and more all over the world. In the Netherlands<br />
there is still no electricity generation from geothermal energy.<br />
But if we look at the several successful pilot plants that<br />
are running at the moment in countries surrounding us like<br />
Germany and France, it is very likely that it will be only a<br />
matter of time until the Netherlands will start to generate<br />
electricity from the heat of the earth. The scope of this research<br />
is to investigate the problems that can arise during<br />
the production of geothermal energy in clayey soil such as<br />
in the Netherlands. It is a known fact that by heating clay<br />
volume changes can occur and excess pore pressures can<br />
develop. This could be very damaging to structures built on<br />
this heated clay, if no remedial measures are taken in advance.<br />
In this thesis, first the backgrounds of geothermal energy<br />
are given and the possibilities for the use of this energy in<br />
the Netherlands are described. Then some background on<br />
heat transfer in soils is described. Next, possible changes in<br />
soil parameters due to heating will be reviewed. In the next<br />
chapter calculations of the driving force of all changes in the<br />
soil, the heat flow from the hot water conductors, are made.<br />
After that, we take a look at the expansion behaviour of clay<br />
and the risks and hazards that this could give. For this purpose,<br />
the calculations of the heat flow are used as input for<br />
the expansion calculations. At the end of the thesis the author<br />
gives some useful recommendations for further research<br />
on this topic. One of the recommendations is to<br />
make a commercially usable program to be able to assess<br />
the risks in advance and to be in time to take remedial measures,<br />
which can save the producing company a lot of money<br />
and troubles.<br />
In which:<br />
F Pile = bearing capacity<br />
q cav = average cone resistance over the length where<br />
shaft resistance is mobilised<br />
L = active length of pile<br />
O = circumference of pile<br />
α t = coefficient for shaft friction = 1.4%<br />
From the analysis of the dataset it followed that the current<br />
design code does not fit this dataset, since no constant<br />
value of 1.4% for the α t -factor was found. Instead of a constant<br />
value for the α t -factor, a negative relation between the<br />
circumference and the α t -factor was found. This leads to an<br />
overestimation for the piles with large circumferences and<br />
thus to dangerous situations. Therefore, various modifications<br />
of the current design code were investigated in order<br />
to give a better prediction for the larger piles as well.<br />
The following method gave the best predictions for the<br />
dataset:<br />
FPile<br />
= qc<br />
.CV. αt<br />
= q<br />
av c av<br />
.L.(2.W + 0.38.H).(0.025)<br />
This formula differs from the old one on the following two<br />
aspects:<br />
• CV = calculation value for the circumference of the pile<br />
(W = width of the pile, H = height of the pile)<br />
• α t = 2.5%<br />
The final conclusion of this thesis is to use the lowest value<br />
for the bearing capacity that is predicted with either the<br />
formula above or the existing formula. The differences in<br />
correctly predicted bearing capacities between both methods<br />
were too small to replace the current formula by the<br />
new one. But since the new formula does not overpredict<br />
<strong>Dam</strong> <strong>edition</strong> | Double Issue 2007/2008 | 82
Ingeokring <strong>News</strong><strong>letter</strong><br />
the bearing capacity of the larger piles, this will lead to safer<br />
design of MV-piles.<br />
Influence of spatial correlation length on predicted settlements<br />
of a road embankment<br />
Spyridon Kalamatas<br />
In the common geotechnical engineering practice the shallow<br />
subsurface is often modelled in several layers by assigning<br />
average material properties to each of these layers. However,<br />
the reality is quite different. Soil properties are characterised<br />
by spatial variability within each homogeneous<br />
lithological unit. This variability can be taken into account by<br />
incorporating the value of the spatial correlation length on<br />
the simulation results.<br />
The spatial correlation length describes the distance over<br />
which a random variable tends to be correlated in the underlying<br />
Gaussian field. A large value of spatial correlation<br />
length describes a smoothly varying field, while a small<br />
value implies a ragged field. The objectives of this graduation<br />
project are to extract the value of the spatial correlation<br />
length for a specific case study and to investigate its influence<br />
in the settlement calculations of a road embankment.<br />
The study area deals with the A2 highway connecting Amsterdam<br />
and Utrecht. A representative section of 8.5 km was<br />
analysed and data was gathered from 248 Cone Penetration<br />
Tests, 35 boreholes and a geophysical survey of 2.5 km<br />
length (Consoli Test). The project consists of 4 major sections.<br />
Firstly, the methodology used for processing of the dataset<br />
is given (CPT, borelogs and geophysical outcomes). Further,<br />
a literature review is performed and three different techniques<br />
for the quantification of the spatial variability are<br />
presented (Moving Average Window technique, Autocorrelation<br />
function, and Semivariogram function). Based on the<br />
evaluation of these techniques the Semivariogram technique<br />
was selected for the extraction of the spatial correlation<br />
length. By implementing the Semivariogram function in<br />
every lithological unit, 50 different 3D lithological maps of<br />
the Holocene deposits were made. By importing that<br />
lithological information in the settlement calculations (Finite<br />
Element Method), 300 simulations were performed along<br />
and across the road axis for three representative locations.<br />
The methodology of creating a lithological random field is<br />
followed. Furthermore, the outcomes of the realisation technique<br />
are compared with the outcomes of the classical approach<br />
which is used in the common civil/geotechnical engineering<br />
practice.<br />
The Intrinsic Compression Line of Tertiary clays<br />
Yun Yao Hu<br />
Geotechnical information on Tertiary clays is limited in the<br />
Netherlands despite their widespread distribution in the<br />
subsurface. This is because the clays have limited access due<br />
to depth and due to outcrops at only a few locations where<br />
they can be sampled at an even further limited number of<br />
clay pits. Hence most of the information on these clays is<br />
based on more extensive investigation in Belgium (Boom<br />
and Ieper Clays) and the United Kingdom (London Clay,<br />
Barton Clay). Outcrops of Tertiary clays occur at Winterswijk,<br />
South Limburg and Zeeuws-Vlaanderen. Clay pits suitable<br />
for sampling only exist in Winterswijk and South Limburg.<br />
The strategy of the research is based on these ‘sampling’<br />
constraints and examines basic Winterswijk Rupel Clay geotechnical<br />
properties for comparison with that of Mol, other<br />
locations in Belgium and from the Westerschelde in Zeeland<br />
(from the Westerschelde tunnel). Use is made of a testing/investigative<br />
approach set out by Burland (1990) in his<br />
Rankine lecture to the British Geotechnical Association to<br />
obtain relevant consolidation parameters for comparison.<br />
The first step is to obtain, to quote Burland, “the compressibility<br />
and strength characteristics of reconstituted clays so as<br />
to obtain a basic frame of reference for interpreting the corresponding<br />
characteristics of natural sedimentary clays. The<br />
properties of reconstituted clays are termed ‘intrinsic’ properties<br />
since they are inherent to the soil and independent of<br />
the natural state.” The concept is simple but involves a significant<br />
amount of time, as is the case with most consolidation<br />
tests on clays. The method requires determination of<br />
the ICL, ‘Intrinsic Compression Line’. The ICL is based on<br />
reconstituted clay at a moisture content of between that of<br />
its liquid limit and 1.5 times the liquid limit, followed by onedimensional<br />
consolidation. The plot of void ratio to log pressure<br />
represents the ICL. The ICL is then compared with compression<br />
curves of undisturbed samples. This research reviews<br />
the geology of Tertiary clays in the Netherlands and<br />
provides the results of the ICL determination with comparisons<br />
from tests done on undisturbed samples, showing<br />
(according to Burland) that the clays are all overconsolidated,<br />
the degree of consolidation being greater in<br />
Winterswijk. This suggests that processes such as glaciation,<br />
desiccation and tectonics must have had a significant influence<br />
on the Winterswijk clay as the Belgian/Westerschelde<br />
clays would have been subject to greater sedimentary loading.<br />
<strong>Dam</strong> <strong>edition</strong> | Double Issue 2007/2008 | 83
Ingeokring <strong>News</strong><strong>letter</strong><br />
Weblinks<br />
General information on dams:<br />
www.pbs.org/wgbh/buildingbig/dam/index.html<br />
www.nationalgeographic.com/resources/ngo/<br />
education/geoguide/dams/index.html<br />
www.hydropower-dams.com/<br />
www.ronterpening.com/extras/tropic_ex.htm<br />
www.guinnessworldrecords.com/records/<br />
science_and_technology/structures/<br />
highest_concrete_dam.aspx<br />
npdp.stanford.edu/damhigh.html<br />
www.usbr.gov/lc/hooverdam/History/essays/<br />
biggest.html<br />
en.structurae.de/structures/data/index.cfm?<br />
ID=s0003701<br />
Organisations:<br />
ICOLD: www.icold-cigb.net<br />
NETHCOLD: www.nethcold.org<br />
IAEG: www.iaeg.info<br />
ISSMGE: www.issmge.org<br />
ISRM: www.isrm.net<br />
KNGMG: www.kngmg.nl<br />
Ingeokring: www.ingeokring.nl<br />
De Ondergrondse: www.ondergrondse.nl<br />
Geoportals:<br />
dinolks01.nitg.tno.nl/dinoLks/DINOLoket.jsp<br />
www.geobrain.nl<br />
Information on specific dams/subjects:<br />
Hoover <strong>Dam</strong> under construction: www.eng.auburn.edu/<br />
users/zechwes/pictures.html<br />
www.geodatabank.nl<br />
www.geoloketten.nl<br />
Diablo <strong>Dam</strong> under construction: nwdadb.wsulibs.wsu.edu/findaid/ark:/80444/xv97136<br />
Diablo <strong>Dam</strong> geology: www2.nature.nps.gov/GEOLOGY/<br />
usgsnps/noca/nocaft4.html<br />
Grand Coulee <strong>Dam</strong>: users.owt.com/chubbard/gcdam/<br />
Teton <strong>Dam</strong> failure: web.umr.edu/~rogersda/teton_dam/<br />
USACE website about Risk Analysis for <strong>Dam</strong> Safety:<br />
www.wes.army.mil/ITL/damsafe/<br />
Ice dams in Chile: www.engineering360.nl/index.php?<br />
option=com_content&task=view&id=5696&Itemid=30<br />
Tailing dams: www.tailings.info/stava.htm<br />
<strong>Dam</strong> <strong>edition</strong> | Double Issue 2007/2008 | 84
Notes for the authors<br />
• The manuscript may be written in both Dutch or English and should be sent to the editorial board (address provided on the inside<br />
front cover).<br />
• Authors are free in choosing the subject of their contribution with the following restraints:<br />
- The subject is related to engineering geology and to the specific theme of the <strong>News</strong><strong>letter</strong><br />
- The manuscript is not a commercial advertisement (announcements are allowed)<br />
• Layout<br />
- The article should be written in MS Word or in plain Text, without any formatting or layout-codes. Articles should be send to<br />
the <strong>News</strong><strong>letter</strong> editors in digital format by e-mail (e-mail address provided at the inside of the front cover)<br />
- Figures, drawings, and pictures should be produced in one of the common image formats: GIF, TIFF, JPEG, EMF<br />
- Figures, drawings, pictures and tables should be submitted separately; named and numbered in a logical order according to<br />
their placement in the main text. Submissions should be both in digital format or as high quality printed hard copies. The<br />
print size should be selected by considering possible reduction for the final version<br />
- Each article must include the author(s) name(s), affiliations and address, and a short abstract of preferably less than 100<br />
words<br />
Advertising in the <strong>News</strong><strong>letter</strong><br />
The <strong>News</strong><strong>letter</strong> is distributed to the 200 members of the Ingeokring and several companies and institutes, active in the field of applied<br />
earth sciences. The <strong>News</strong><strong>letter</strong> offers the possibility to advertise and bring your company to readers’ notice.<br />
Advertisements can be either in black/white or in colour, A4 or A5 size. Tariffs are listed below:<br />
Size Black/white Colour<br />
A4 € 200 (2 issues) € 450 (2 issues)<br />
A5 € 125 (2 issues) € 250 (2 issues)<br />
Advertisements should be sent to the <strong>News</strong><strong>letter</strong> editor (address provided at the inside of the front cover), preferably in high resolution<br />
digital image format (one of the common image formats: GIF, TIFF, JPEG, EMF, no PDF please).
Next issue: Geophysics<br />
Printing of this issue was sponsored by: