Bibliometric Analysis Asia-Pacific Research Area ... - JuSER
Bibliometric Analysis Asia-Pacific Research Area ... - JuSER
Bibliometric Analysis Asia-Pacific Research Area ... - JuSER
- No tags were found...

You also want an ePaper? Increase the reach of your titles
YUMPU automatically turns print PDFs into web optimized ePapers that Google loves.
Central Library<br />
1. Publication <strong>Analysis</strong> on a Country Basis<br />
1.1 An International Comparison of Publication Activity<br />
The first chapter of this analysis focuses on the publication activity of all of the countries. We will<br />
try to provide an answer to the question of which of the countries analysed from the <strong>Asia</strong>-<strong>Pacific</strong><br />
research area 1 has undergone an above-average development over the past number of years.<br />
For this purpose, the charts and graphs that follow will take a look at the total publication output<br />
of these countries (without breaking the results down according to discipline), as will the<br />
development of cooperations in these countries as represented by the number of copublications.<br />
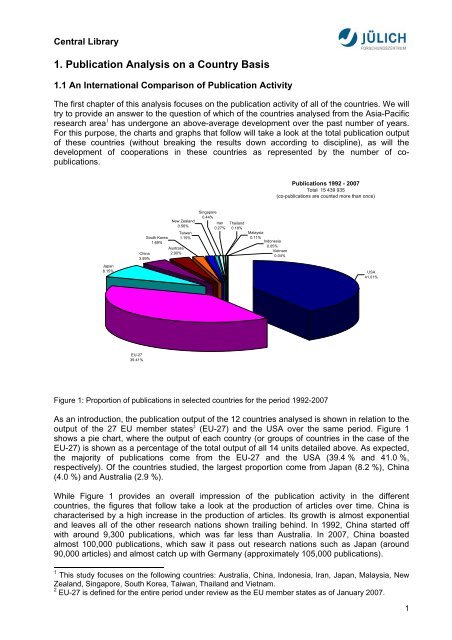
Publications 1992 - 2007<br />
Total 15 439 935<br />
(co-publications are counted more than once)<br />
Japan<br />
8.15%<br />
China<br />
3.99%<br />
South Korea<br />
1.69%<br />
New Zealand<br />
0.56%<br />
Australia<br />
2.90%<br />
Taiwan<br />
1.19%<br />
Singapore<br />
0.44%<br />
Iran<br />
0.27%<br />
Thailand<br />
0.18%<br />
Malaysia<br />
0.11%<br />
Indonesia<br />
0.05%<br />
Vietnam<br />
0.04%<br />
USA<br />
41.01%<br />
EU-27<br />
39.41%<br />
Figure 1: Proportion of publications in selected countries for the period 1992-2007<br />
As an introduction, the publication output of the 12 countries analysed is shown in relation to the<br />
output of the 27 EU member states 2 (EU-27) and the USA over the same period. Figure 1<br />
shows a pie chart, where the output of each country (or groups of countries in the case of the<br />
EU-27) is shown as a percentage of the total output of all 14 units detailed above. As expected,<br />
the majority of publications come from the EU-27 and the USA (39.4 % and 41.0 %,<br />
respectively). Of the countries studied, the largest proportion come from Japan (8.2 %), China<br />
(4.0 %) and Australia (2.9 %).<br />
While Figure 1 provides an overall impression of the publication activity in the different<br />
countries, the figures that follow take a look at the production of articles over time. China is<br />
characterised by a high increase in the production of articles. Its growth is almost exponential<br />
and leaves all of the other research nations shown trailing behind. In 1992, China started off<br />
with around 9,300 publications, which was far less than Australia. In 2007, China boasted<br />
almost 100,000 publications, which saw it pass out research nations such as Japan (around<br />
90,000 articles) and almost catch up with Germany (approximately 105,000 publications).<br />
1 This study focuses on the following countries: Australia, China, Indonesia, Iran, Japan, Malaysia, New<br />
Zealand, Singapore, South Korea, Taiwan, Thailand and Vietnam.<br />
2 EU-27 is defined for the entire period under review as the EU member states as of January 2007.<br />
1