download
download
download
- No tags were found...

You also want an ePaper? Increase the reach of your titles
YUMPU automatically turns print PDFs into web optimized ePapers that Google loves.
P o w e r f u l , A u t o m a t e d , I n t e g r a t e d , F l e x i b l e<br />
2 1<br />
3<br />
4<br />
Powerful<br />
Automated<br />
Integrated<br />
Flexible<br />
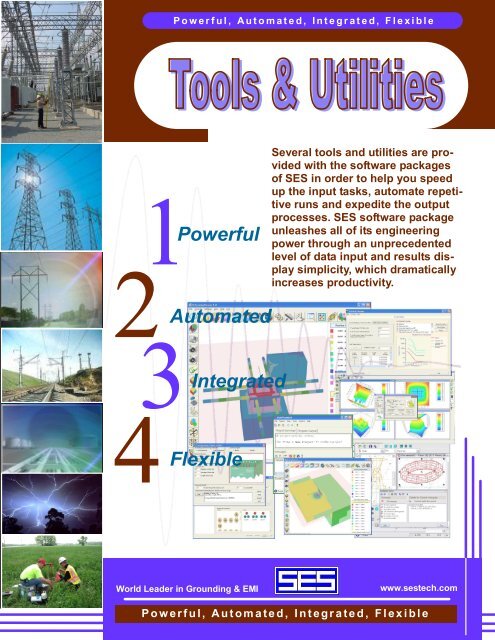
Several tools and utilities are provided<br />
with the software packages<br />
of SES in order to help you speed<br />
up the input tasks, automate repetitive<br />
runs and expedite the output<br />
processes. SES software package<br />
unleashes all of its engineering<br />
power through an unprecedented<br />
level of data input and results display<br />
simplicity, which dramatically<br />
increases productivity.<br />
World Leader in Grounding & EMI<br />
www.sestech.com<br />
P o w e r f u l , A u t o m a t e d , I n t e g r a t e d , F l e x i b l e
An ObjectBased Graphical<br />
Environment CAD System for the<br />
Development of Arbitrary Networks of<br />
Conductors<br />
SES software includes a unique combination of input/<br />
output processors that will satisfy the most demanding<br />
users. It unleashes all of its engineering power<br />
through an unprecedented level of data input simplicity,<br />
which dramatically increases productivity. Everyone<br />
likes the look and feel of a Windowsbased interface,<br />
but these processors are meant for those with an<br />
electrical engineering soul... Just describe your system,<br />
and let it show you features you never knew existed.<br />
The specification of the data defining conductor networks takes<br />
up most of the time involved in preparing input files. With this in<br />
mind, SES has designed SESCAD, a graphical utility for the development<br />
of conductor networks. SESCAD allows you to view or<br />
edit threedimensional networks consisting of straight conductor<br />
segments. This CAD program uses an objectoriented approach<br />
to network development. Elementary objects (conductors and<br />
observation profiles) can be created by simply drawing them or<br />
by entering data in dialogs boxes. Composite objects can be<br />
formed by grouping existing objects together. They can be<br />
viewed from any direction, in a variety of ways. The objects can<br />
be selected, copied, pasted, deleted, etc., in the standard way for<br />
Windows applications. A rich set of tools is available to manipulate<br />
them.<br />
Toolboxes are available to automate certain tasks that could otherwise be highly timeconsuming. These include rotating,<br />
translating and scaling an object or a duplicate of the object, aligning and distributing objects, and examining the<br />
network for various defects such as overlapping conductors or undesirable gaps. You can even create an entire rightofway<br />
in a few clicks on dedicated window interfaces.<br />
Power Tools are also available. They can be used to<br />
force two conductors to meet at a given point, to stretch<br />
a conductor until it meets another one or to make sure<br />
that no gaps are present in the network, etc.<br />
All operations carried out on objects can be easily undone.<br />
Several options are available to customize the behavior<br />
of the tools. The network can be viewed from any<br />
position using either a parallel projection view, a plan<br />
view, or a perspective view. It is possible to zoom in on a<br />
portion of the network by a factor of as much as 1 million,<br />
and to go back to previous zoom levels.<br />
The program can import and export DXF compatible files<br />
from all major CAD systems.<br />
SESCAD can exchange data automatically with the Input<br />
Toolbox and can therefore supplement the data entry capabilities of that program. Most of the program's functions are<br />
directly accessible from the Toolbars or from dedicated menus or windows. All relevant data entry fields are linked to<br />
contextsensitive help topics. Extensive online help is available for every screen in the program.<br />
www.sestech.com<br />
World Leader in Grounding & EMI
An Advanced Graphics and report<br />
output processor with input<br />
processing capabilities<br />
GRServer can display, plot, and print configuration and computation results obtained using any SES<br />
software package. GRServer also has the capability to view the input files, run the engineering modules<br />
to populate the computation databases and view output files. In addition, it may be used to view<br />
multiple Windows graphics files in its convenient multiwindow environment.<br />
GRServer generates reports and plots with ease.<br />
The plots which are created in each of the display<br />
windows are also created as thumbnails (plot<br />
icons) on the sidebar. The thumbnails are used<br />
as references to the individual plot windows;<br />
clicking on a thumbnail highlights the corresponding<br />
plot window. GRServer's multiwindow interface<br />
allows the creation of as many plots as can<br />
be loaded into memory.<br />
GrServer's Main Screen<br />
The main window allows access to all of the functions<br />
which are used for creating reports and<br />
plots from the engineering computation database;<br />
its multidocument structure makes it an efficient<br />
means to compare results and draw conclusions.<br />
The window menu has six distinct components as shown here. The toolbar provides easy access to the most used<br />
features that can also be found in the menu bar. The six program buttons on the left sidebar are for loading the engineering<br />
computation databases for the programs other than the currently opened one. Clicking on any of these enabled<br />
buttons will automatically load the corresponding database. The plot icons (in the right sidebar) are the thumbnails<br />
of the plots created in the plot window space. Since the plot icon sidebar is scrollable, there is no limitation on the<br />
number of icons it can contain. Clicking on a plot icon activates the plot window associated with the icon. A popup<br />
menu shows up when rightclicking on a plot icon. It allows for the printing, saving, and deleting the plots.<br />
A Few Typical Features<br />
Options Window: The Options window is the entry point for generating configuration<br />
and computation plots.<br />
Advanced Features: The 3D computations setup window offers many 3D plots.<br />
They include options such as displaying a floor and/or ceiling projection of the<br />
graph surface, displaying contour lines and/or spot zones, spotfill styles, etc.<br />
Zooming In and Out: Zooming to an area is as simple as dragging a mouse<br />
over the area boundaries. If necessary a more accurate boundary window can<br />
be edited to insure that the required area is defined with great precision.<br />
Previewing and Printing: The PrintPreview window allows the user to move<br />
and scale the plot to desired specifications. In addition, it allows the user to import<br />
reports generated by the report facilities in GRServer.<br />
3D settings: X/Ymesh, Colored SpotFill, Shading Effect, Legend, Spot Zones<br />
and Contour Ceiling Projection.<br />
Saving to a File or Clipboard: Clicking on the Save or Save As menu items from the File menu or from the plot icon<br />
sidebar popup menu saves the current plot to the designated file. Also, you can copy it to the Windows Clipboard.<br />
Updating the Computation Results: The input file may be modified, printed, and saved from within the builtin editor.<br />
The user may rerun the corresponding case immediately to create an updated computation results database.<br />
Using the Zoom Server to Define Zoom Regions: Zoom regions (for the configuration and computation modes) are<br />
defined in the Search Zone Vertices grid in the Zoom Options or in the Zoom & Report tab. The zoom coordinates<br />
may be entered either manually or by visually selecting a zoom region from the conductor network plot.<br />
www.sestech.com<br />
World Leader in Grounding & EMI
A powerful 3D graphics rendition software that allows you to visualize the complete<br />
system including the entire network and surrounding soil structure. Furthermore,<br />
computation results are displayed right on the system components.<br />
SESsystemViewer is an invaluable graphics rendition<br />
software tool that can display the complete<br />
system configuration as specified by the user realistically<br />
as observed in a 3D environment from a<br />
moving platform.<br />
It has the capability to display the system configuration<br />
specified by the MultiGround, MultiGroundZ or Multi<br />
Fields software packages. Furthermore, all computation<br />
results pertaining to the system configuration can be<br />
displayed right on the system component itself in vivid<br />
spot colors that reflect the intensity of the displayed<br />
quantity (such as leakage and longitudinal currents,<br />
ground potential rises (GPR), etc.).<br />
The main graphics computation engine of SESsystem<br />
Viewer is driven by the OpenGL industry standard protocol.<br />
The interface consists essentially of a convenient<br />
single window environment that is segmented in five<br />
regions, namely:<br />
· A 3D display region<br />
· A legend zone that labels the computed charge density levels of the finite<br />
soil volumes patches<br />
· A legend zone that labels the relevant specified or computed reference quantity<br />
for all conductors of the system<br />
· A menu bar that offers various useful options, features and action shortcuts<br />
· Vertical and horizontal toolbar regions populated with clearly identifiable buttons that duplicate most of the<br />
menu items and provide convenient feature and action shortcuts<br />
It is possible to display the conductor network, soil model structure and reference Cartesian axes alone or simultaneously.<br />
This is quite convenient when it is necessary to determine if the conductors are above or below<br />
ground and where the buried conductors are located with respect to the various soil regions (soil layers or soil<br />
finite volumes). Conductors can be displayed as lines of various thicknesses or cylinders with a radius equal<br />
to a multiple of the specified one. One can load the information contained in the input file or in the computation<br />
database selectively. Information from multiple sessions can be superposed (appended) if desired.<br />
Finite soil volume patches can be displayed as vertices<br />
(points), wire frames or solid surfaces. Conductor data such<br />
as radius, material type, coating type or energization type can<br />
be displayed in various colors for easy rendition. Computation<br />
results that can be displayed in various color intensities include<br />
the leakage currents, longitudinal currents at the origin<br />
or end of a conductor segment, the GPR of its metal, that of<br />
its coating or the coating stress voltage.<br />
It is possible to specify the location of the observer as well as<br />
the steps or increments of the pan and rotation movements.<br />
The X, Y or Z coordinates can be scaled arbitrarily to help<br />
better visualize flat objects. Finally, it is possible to reassign<br />
various 3D navigation controls to the mouse left and right buttons<br />
and to the cursors.<br />
www.sestech.com<br />
World Leader in Grounding & EMI
A Graphics Input / Output Processor<br />
to visualize Circuit Models Created<br />
by SES Software Packages<br />
GRSPLITS is a graphics input / output processor that displays the circuit model created by SES software<br />
packages that use the SPLITS or FCDIST computation engines (such as RightOfWay or Multi<br />
Lines). This tool greatly simplifies the task of manipulating, visualizing and checking the components<br />
of a SPLITS or FCDIST circuit or their computation results.<br />
The entire circuit or only the parts of interest can be plotted. This<br />
means that it is possible to plot only the central site or one or more<br />
terminals or some specified sections (spans) for a given terminal.<br />
Up to four terminals can be displayed simultaneously. The numerical<br />
values of the longitudinal and shunt impedances can be printed<br />
for each section.<br />
The interconnections between the various phases of a given section<br />
are also displayed when their impedance is below a specified<br />
threshold value. Identical sections are replaced by a single section,<br />
followed by dashed lines if desired. Computation results, such as<br />
shunt voltages and series or shunt currents can be displayed at the<br />
Central Station, at Terminals and for a range of sections as required.<br />
Plots can be produced in most popular formats.<br />
The program analyzes the contents of the input file and displays the results in the Terminals frame. The user may select<br />
which terminals and sections to display. The Plot Style and the Text display (Show Text) options can be set accordingly<br />
in the Settings menu. If desired, the graphical settings can be adjusted in the Settings menu and the display of<br />
interconnections can be turned on or off by choosing an appropriate Interconnection Threshold. Once all the options<br />
are configured, the circuit plot can be produced by selecting the Plot Circuit in the Plot menu. The following is a short<br />
description of the most interesting options available in the program.<br />
Plot Style Options: This option selects which parts of the circuit are to be displayed. Five options are available: All,<br />
Central Site and Terminals Only, Central Site Only, Sections Only and Terminals Only.<br />
Show Text Options: Selects what kind of circuit data are to<br />
be displayed on the plot. Up to five types of data can be simultaneously<br />
displayed. Line Impedances, Shunt impedances,<br />
Source Voltages, Connection Impedances and Bus<br />
Name.<br />
Terminals: Define which terminals and sections will be displayed.<br />
Any combination of up to four terminals can be selected.<br />
Interconnection Threshold: This option on the program's<br />
main screen is used to control which mutual connection impedances<br />
between the lines of the circuit (interconnections)<br />
are shown. The connection impedances below this threshold<br />
will be indicated by a line connecting the corresponding<br />
wires.<br />
Graphical Settings: The Graphical Settings dialog, which<br />
can be accessed from the Set Graphical Factors item from<br />
the Settings menu, can be used to control the appearance of the generated plot. The following options are available:<br />
Color, Output Device, Character Height and Rescaling Factor.<br />
Input File Editor: This item which is invoked by selecting the Edit Input Data File item under the Edit menu on the program's<br />
main screen, can be used to view or modify the currently loaded input file. The editing capabilities of that window<br />
are those of a standard, Notepadlike, editor, and are available through the usual keyboard shortcuts.<br />
www.sestech.com<br />
World Leader in Grounding & EMI
Automated Transposition of<br />
Phase Conductors and Crossbonding<br />
of Cable Sheaths for<br />
MultiPhase Circuits<br />
TransposIT is a software utility that automates the analysis of the optimum transposition or<br />
crossbonding scenario on a power system network. Currently, the automation is implemented<br />
on the data specification only. Future implementation will provide automation to the<br />
algorithm used to determine the optimum transposition based on a set of criteria defined by<br />
the user.<br />
This utility, works on a circuit data defined by<br />
the SPLITS computation module. Therefore, it<br />
is useful to the MultiLines and RightofWay<br />
software packages.<br />
Overview of TransposIT<br />
It is well known that substantial current<br />
unbalance can develop within and between<br />
the circuits of a transmission line<br />
when the phases are not regularly transposed,<br />
even when the loads are balanced.<br />
Studying the effects of the characteristics<br />
of such transpositions (their<br />
location, direction of rotation, etc…) in<br />
order to arrive at an optimal configuration<br />
is a tedious task, requiring manual<br />
modification of the network model at<br />
every transposition location. Moreover,<br />
a huge number of different transposition<br />
scenarios may have to be examined.<br />
The TransposIT utility was created to simplify this task. This utility takes a reference SPLITS file as input<br />
and produces on output a different SPLITS file, with transpositions applied at userdefined locations, on<br />
userspecified circuits. The program’s interface allows you to specify the transpositions either visually<br />
through a graphical interface, using windows screens through a tabular approach, or using a command input<br />
file. Either way, the transpositions<br />
are immediately displayed visually:<br />
this makes it easier to confirm that the<br />
transpositions really have the desired<br />
characteristics. All three modes of<br />
input are fully synchronized.<br />
Note that TransposIT can also be<br />
used to carry out crossbonding of<br />
cable sheaths as easily as for phase<br />
transpositions. In fact, any operations<br />
that require changing regularly the<br />
physical position of conductors in order<br />
to meet certain mutual coupling<br />
criteria can be done easily using this<br />
software utility.<br />
www.sestech.com<br />
World Leader in Grounding & EMI
A Powerful Batch Processor that Automates the Submission<br />
of Repetitive Computer Runs or Tasks<br />
Often it is necessary to examine a large number of scenarios. These cases, which have similar input data, require<br />
multiple runs of the engineering modules. It is therefore desirable and efficient to stack all of these runs<br />
together and let the computer do the work unattended (batch processing). The results are examined later interactively<br />
or using automated procedures. That's exactly what SESBAT does: batch processing.<br />
SESBatch is a utility that allows you to run cases consecutively by submitting a series<br />
of unattended runs, to execute perhaps overnight or over the weekend. The<br />
SESBatch utility is quite straightforward to use. A typical SESBatch session consists<br />
of the following steps:<br />
· Define the programs to be run. The simplest way to do this is usually to browse<br />
for the input files defining the runs using the builtin file browser.<br />
· Optionally define a starting time for the first program in the list; if none is<br />
specified, the first program starts as soon the Launch button is clicked. Subsequent<br />
programs start as soon as the previous one terminates.<br />
· Click on the Launch button. The runs will start at the selected time. SES<br />
Batch will prompt you when all runs have completed and produce a log file<br />
listing all the runs along with their starting and ending times.<br />
The session information gathered in the first two steps can be saved to a<br />
workspace file and restored at a later time. Dedicated tabs offer new and<br />
improved functionalities. For example, the Current Run tab displays the progress of<br />
the program that is currently running in the batch while the Finished Runs tab displays<br />
the status of each run in the batch that has been completed.<br />
A program can be added to the batch while the batch is in progress and commonlyused utilities can be accessed from the Tools menu.<br />
GRAREP Is a Graphics, Report and Text<br />
Viewer for all SES Software Packages<br />
GraRep is a software tool that can be used to display and print existing graphics, reports or text files. It allows<br />
you to zoom in on a selected portion of a picture, scale a picture up or down, view any number of pictures, customize<br />
the printing of plots, and view and print reports, messages and text. GraRep is used internally by SES<br />
software to display computation results graphically or in report form. The program can also be used in<br />
"standalone" mode. The following describes some of GraRep’s salient features.<br />
The main user interface of the program consists of three tabs. The View Plots tab is devoted to the display of graphics files. The other<br />
two tabs (View Reports and View Messages) are used to display text.<br />
The View Plots tab is separated into two major areas: the main viewing<br />
area, and the Picture Button queue (at the right edge of the window). When<br />
a picture is first loaded, it is displayed in the main viewing area and a Picture<br />
Button showing a smaller version of the picture is created<br />
and added to the queue. Pictures can be deleted, saved or<br />
copied at any time. Furthermore, pictures can be moved<br />
scaled or zoomed using simple mouse movements and clicks.<br />
The View Report and View Messages tabs look<br />
exactly the same. Their functionality is, however,<br />
somewhat different. Both can open, display, and<br />
save text files. The difference is that when a file is<br />
open in the View Report tab, its content either replaces<br />
what was displayed in the viewer or appends<br />
to it after inserting a "Report #" tag. Several<br />
toolbar buttons provide convenient access to several<br />
useful shortcuts and Options.<br />
www.sestech.com<br />
World Leader in Grounding & EMI
A Powerful Script Interpreter that<br />
adds Programming Capabilities to<br />
SES Input Files<br />
Often it is necessary to examine the effects of one or several parameters of a problem on the computation<br />
results. In this case a parametric analysis that relies on the results of a large number of<br />
cases is required. The creation of these cases, which have similar input data, can be quite timeconsuming<br />
and errorprone if carried out manually. It is therefore desirable and efficient to create all<br />
these cases using automated procedures. That's exactly what SESScript does: Create, based on a<br />
template file, the appropriate input files for batch processing.<br />
The use of parametric analysis is becoming increasingly frequent in<br />
R&D and engineering studies. In such studies, a system is modeled and<br />
simulated for several values of one or more parameters, usually to find<br />
the optimal combination of those parameters according to some technical<br />
or economic criteria.<br />
SES software packages already include some builtin capabilities for<br />
parametric analyses but it is difficult to make the software capable of<br />
performing parametric analyses for all possible combinations of parameters<br />
that could be of interest in practice.<br />
This is where SESScript steps in. This utility is a script interpreter that<br />
adds programming capabilities to SES input files. This program can<br />
generate hundreds of files from a single input file containing a mixture of<br />
the SES SICL command language and scripting code. Using this program<br />
requires some computer programming skills and is therefore not entirely<br />
straightforward. Nevertheless, those of you who are familiar with programming<br />
may find it a useful, time saving tool.<br />
Overview<br />
The main screen of SESScript is the central point of the of the program. You<br />
can use it to initiate all of the operations in the program, such as loading a<br />
script file or a previously saved session file, defining parameters for the script,<br />
setting options for the program or processing the script. The functions available<br />
in the program are regrouped in the menu bar and the toolbar. In addition, you<br />
can define the values of the parameters that are to be used when processing<br />
the script as well as the name of the files that should be generated directly from<br />
this screen. The typical use of the SESScript program involves a few steps:<br />
Creating a script file. This file can contain any text, and should normally contain<br />
special instructions that are to be interpreted by SESScript.<br />
Loading the file in SESScript. At this point, the program analyzes the file for<br />
any instructions it might contain.<br />
Specifying any relevant parameters. The script file may contain several<br />
unspecified parameters. SESScript offers you to replace those parameters<br />
with specific values.<br />
Processing the script file. The processing can generate a large<br />
number of files, with typically different values of the parameters in<br />
each of the files.<br />
There are options to control the syntax of the script language<br />
(Macro Language Syntax), and to control whether or not a debug<br />
script file is created whenever a script file is processed. You can<br />
also specify symbol substitutions that should be carried out in the<br />
original script file before processing it.<br />
www.sestech.com<br />
World Leader in Grounding & EMI
A Software Tool that Automates the Selection<br />
of Soil Structures that Apply<br />
During Winter or EarlySpring Seasons<br />
In regions where the top layer soil can freeze during winter or<br />
dry out during summer it is necessary to assess the effects of<br />
shallow depth resistivity variations on the grounding design.<br />
The recent internationally approved IEC<br />
standard 619361 entitled Power Installations<br />
Exceeding 1 kV ac – Part 1: Common<br />
Rules, states clearly in Section 10.3.1<br />
General Clause b:<br />
Determine the (grounding) zone of interest.<br />
If not a global earthing system<br />
(meaning an urban zone), then determine<br />
the soil characteristics of the<br />
zone of interest, taking into account<br />
the seasonal variation of the soil parameters.<br />
This requirement means that the designer<br />
of a grounding system has the<br />
obligation to determine if seasonal soil<br />
resistivity variations have an impact<br />
on the grounding performance.<br />
Overview of SoilModelManager<br />
It is well known that soil resistivity increases dramatically when the temperature drops below zero<br />
degrees Celsius. The resistivity can increase by a factor of 51000 times the “summer” value, depending<br />
on the temperature, soil material type, moisture content, salinity etc. What resistivity scaling<br />
factors should be used for the various top soil layers that are affected by the temperature in a given<br />
geographical region when soil freezes? Some have argued that a factor of 5 to 6 would be an adequate<br />
average. Others prefer to use a value on the order of 20 or more. The best approach is not to<br />
try to use an average value but to<br />
emulate the real distribution of resistivity<br />
with depth as a function of the temperature<br />
at that depth.<br />
This is what SoilModelManager does,<br />
taking into account the unfrozen<br />
(summer) soil model and other relevant<br />
information such as meteorological data<br />
as provided by the user. It uses resistivity<br />
scaling factor curves corresponding to<br />
the soil type under study to automatically<br />
generate the appropriate soil models for<br />
the winter and early–spring seasons,<br />
based on the unfrozen soil model.<br />
www.sestech.com<br />
World Leader in Grounding & EMI
A Software Tool that Automates the Transfer of Leakage Currents<br />
Computed by RightofWay or MultiLines to a Conductive<br />
Analysis Software Such as MultiGroundZ or MultiFields<br />
In some specific cases, it is desirable to examine the effects of inductive and conductive<br />
interference effects separately. In such cases, SESCETU becomes the ideal tool to automatically<br />
transfer the computed currents discharged by grounded structures to the conductive<br />
interference software package.<br />
SESCETU (Current Energization Transfer Utility) is an interference analysis utility that automates the transfer of<br />
leakage currents computed by the SPLITS computation module of RightofWay or MultiLines to a conductive<br />
analysis software such as MultiGroundZ and MultiFields that use the MALZ or HIFREQ computation modules. This<br />
is useful, for example in order to carry out the conductive interference analysis<br />
required to obtain the total (i.e., inductive and conductive) interference levels.<br />
These leakage currents usually correspond to transmission line tower currents or<br />
substation ground currents injected into soil during fault conditions in substations<br />
or along the transmission lines.<br />
The induced potentials computed by SPLITS represent the inductive component<br />
of the potential impressed on the victim circuits (pipelines, rail tracks, telecommunication<br />
lines, etc.) during normal or fault conditions. During normal conditions<br />
or In the absence of nearby energized buried metallic structures, the local<br />
soil potential will be near that of remote soil (i.e., zero) and the stress voltages<br />
of the victim circuits will simply be equal to the induced potentials. In most<br />
cases, the victim circuit is near grounding systems such as electric substations,<br />
power plants, transmission line structures and distribution poles. Therefore, a<br />
conductive component also exists due to the energization of the surrounding soil by<br />
the current leaking from these grounding systems. Consequently, it is necessary to<br />
calculate the conductive component of the victim circuit. The total interference levels<br />
are then determined by combining the inductive component computed by SPLITS<br />
with the conductive component obtained from MALZ or HIFREQ.<br />
In order to determine the conductive components of the interference, it is necessary<br />
to transfer the known fault current distribution from the SPLITS computation<br />
results to MALZ or HIFREQ. This can be done by extracting manually the required<br />
leakage currents from the inductive computation results (a lengthy operation that<br />
is prone to errors) or automatically and reliably using the SESCETU utility.<br />
A software tool that extracts data directly from the frequency<br />
to time domain conversion software database files and display<br />
it in various graphical forms, including 2D and 3D animations<br />
FFT21Data is a utility that extracts data directly from FFTSES’ database<br />
files and exports it in a spreadsheetcompatible format. It can<br />
also display this data in graphical form, and create animation plots of<br />
the data.<br />
FFT21Data extracts (or displays) the data as a<br />
function of space (i.e., point number, profile number<br />
or conductor segment number). The data can<br />
be examined at a specified instant in time; alternatively,<br />
the maximum (minimum) value that the data<br />
takes at all times can be examined. This functionality<br />
complements what is already<br />
available in SES software.<br />
By combining plots taken at several<br />
instants of time, the utility can<br />
also display animated 2D and 3D<br />
plots, showing the time evolution<br />
of the computation results along a<br />
specified range of computation<br />
points or conductor segments.<br />
www.sestech.com<br />
World Leader in Grounding & EMI
The AutoTransient tool automates the "mechanical" parts of an analysis of transient<br />
phenomena with MultiFields. It runs the required computation modules (HIFREQ and FFTSES)<br />
in turn, using the computation frequencies recommended by FFTSES to run HIFREQ, until<br />
userdefined termination criteria are met. It also builds the FFTSES computation databases<br />
from the resulting HIFREQ databases. Using the FFT21Data<br />
tool, it can create 2D and 3D timedomain animation plots.<br />
Technical Highlights<br />
¨<br />
¨<br />
¨<br />
¨<br />
¨<br />
The AutoTransient program carries out the standard steps of a HIFREQFFTSES<br />
transient study automatically. Starting from template FFTSES and HIFREQ files<br />
(generated with the CDEGS Input Toolbox, or any other editor), the program runs the<br />
Forward FFTSES and finds the first set of recommended computation frequencies.<br />
After running HIFREQ at those frequencies and building the FFTSES Input Databases,<br />
the program runs the Inverse FFTSES and deduces the next set of recommended<br />
frequencies. This last step is repeated until the termination criteria are met.<br />
You can choose to stop the program once there are no more recommended<br />
frequencies, when a specified amount of time has elapsed, or when a specified<br />
number of cycles of the above procedure have been carried out.<br />
When running HIFREQ, you can choose to run all recommended frequencies, or to<br />
run only one frequency at a time. This last method, which would be very cumbersome<br />
to do manually, gives a lot of flexibility since many electrical properties (resistivities,<br />
permeabilities, etc…) can be varied as a function of frequency. The program allows<br />
you to specify frequencydependent soil characteristics through a simple dialog. With<br />
a little bit of programming effort, you can specify a frequencydependence for any<br />
nongeometrical quantity defined in the HIFREQ template file.<br />
The program performs basic data crossvalidation between HIFREQ and FFTSES, to<br />
help avoid the most common data entry problems in a transient analysis.<br />
You can interrupt the analysis at any time, then restart it where you left off.<br />
www.sestech.com<br />
World Leader in Grounding & EMI
A Software Tool that Computes the Minimum Conductor<br />
Size, Maximum Fault Current Rating or<br />
Temperature Rise During a Fault that Discharges<br />
Currents in Conductors Buried in the Soil<br />
The Ampacity software tool computes the following quantities:<br />
· Minimum conductor size;<br />
· Ampacity (i.e., maximum fault current rating);<br />
· Temperature rise during a fault (computed in terms of the<br />
final temperature after the fault).<br />
Depending on users’ choice one of these three values is computed<br />
each time the calculation is launched. When one value<br />
is to be calculated, the other two values become required input<br />
data. The input form reflects this by graying out the quantity<br />
being computed and allowing the other two to be specified.<br />
The computations are based on the following assumptions:<br />
¨ The heating process is adiabatic;<br />
¨ The thermal capacity per unit of each conductor remains<br />
constant during the heating process as is usually<br />
the case for fault durations a few seconds or less.<br />
The basic equation used in this module is the detailed<br />
equation provided in ANSI/IEEE Standard 80 for the calculation<br />
of ampacity for symmetrical currents. To account<br />
for asymmetrical current characteristics (i.e., dc offset), the symmetrical current is increased in accordance<br />
with the decrement factor presented in the same standard.<br />
A Grounding System Estimator<br />
The SES Grounding System Estimator<br />
(SESGSE) is a simple tool which allows you to<br />
quickly determine the resistance of classical<br />
types of grounding systems or the appropriate<br />
size of the grounding system required to<br />
achieve a specified grounding resistance value.<br />
A uniform soil model is assumed. For non<br />
uniform soils, use the Estimator or Predictor<br />
mode options of the AutoGroundDesign<br />
software package.<br />
SEGSE mainly consists of six groups:<br />
¨ Grounding System Design Objective defines the<br />
types of computations required<br />
¨ System Selection allows you to select the type<br />
of grounding system<br />
¨ System Parameters defines the fundamental<br />
parameters of the grounding system<br />
¨ Expected Results defines the desired grounding<br />
resistance and the accuracy to be met<br />
¨ Computations Results display the results of<br />
the requested computations<br />
¨ System of Units specifies which system of<br />
units is to be used for input and output<br />
www.sestech.com<br />
World Leader in Grounding & EMI