SPIDER® Rock protection system - Geobrugg AG
SPIDER® Rock protection system - Geobrugg AG
SPIDER® Rock protection system - Geobrugg AG

Create successful ePaper yourself
Turn your PDF publications into a flip-book with our unique Google optimized e-Paper software.
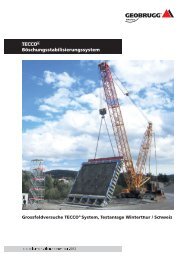
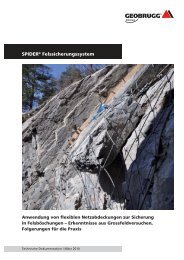
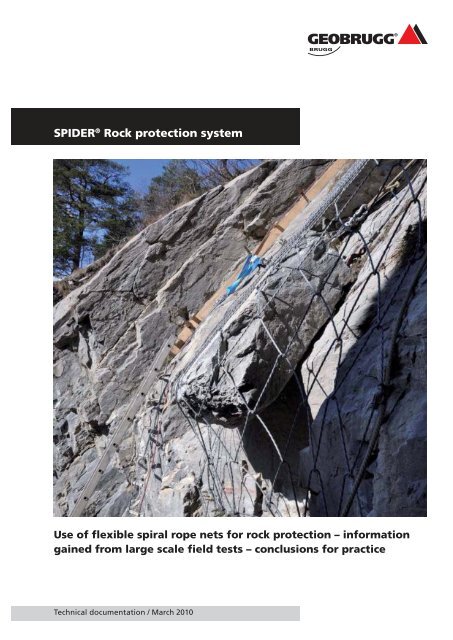
SPIDER ® <strong>Rock</strong> <strong>protection</strong> <strong>system</strong><br />
Use of fl exible spiral rope nets for rock <strong>protection</strong> – information<br />
gained from large scale fi eld tests – conclusions for practice<br />
Technical documentation / March 2010
SPIDER ® <strong>Rock</strong> <strong>protection</strong> <strong>system</strong> / Technical documentation / March 2010<br />
Use of fl exible spiral rope nets for rock <strong>protection</strong><br />
– information gained from large scale fi eld tests,<br />
conclusions for practice<br />
2<br />
Daniel Flum Rüegger+Flum <strong>AG</strong>, St. Gallen, Switzerland<br />
Armin Roduner <strong>Geobrugg</strong> <strong>AG</strong>, Protection <strong>system</strong>s,<br />
Romanshorn, Switzerland<br />
Daniela Engl AlpS – GmbH, Innsbruck, Austria<br />
ABSTRACT<br />
Flexible rope nets have been used in alpine regions for some decades for<br />
protecting rock slopes against unstable boulders or critical rock masses. The<br />
confi guration of the <strong>protection</strong> measure was often based on the years‘ of<br />
experience of individual specialists. There was a lack of adequate dimensioning<br />
concepts or extremely simplifi ed models were used. To better understand<br />
the supporting behavior of fl exible rope nets and their interaction with nails<br />
or extruded piles, to thoroughly analyze the force distribution and investigate<br />
the infl uence of dynamic infl uences, comprehensive large scale fi eld tests<br />
were carried out in Felsberg near Chur, Switzerland. This paper summarizes<br />
the information gained and conclusions drawn for the practical application<br />
of fl exible rope nets anchored by nails or extruded piles.<br />
INTRODUCTION<br />
Flexible rope net <strong>system</strong>s frequently open up interesting and cost effective<br />
application possibilities. Often used in the past or still in use are square or<br />
rectangular nets of stranded ropes with a diameter of normally 8 – 10 mm,<br />
joined at the crossing points with cross clamps or wire coils. Sometimes a<br />
thicker rope running along the periphery is used to strengthen the boundary<br />
zone. A representative example of this <strong>system</strong> is the PENTIFIX ® <strong>system</strong>. The<br />
nail pattern is determined by the size and geometry of the panels. This renders<br />
project specifi c adaptation and optimizing of the nailing diffi cult. Originally<br />
such <strong>system</strong>s were used for protecting creeping slopes. Deformation of the<br />
<strong>protection</strong> <strong>system</strong> was taken for granted. In addition to large area applications<br />
fl exible rope nets are often used to protect individual critical boulders which<br />
can endanger persons or infrastructure objects.
Based on material technology innovations it was possible to replace stranded<br />
ropes with their 0.8 –1.0 mm thick individual wires by statically equivalent<br />
spiral ropes with a wire diameter of 3.0 – 4.0 mm. Moreover the manufacturing<br />
process was optimized to the degree that nets can now be produced on<br />
machines in rolls. This has decisively infl uenced the application: Previously the<br />
panels were separately installed and fi xed to nails distributed in the corner<br />
zone of the net. Now 3.5 m wide nets can be placed rationally and fl atly in<br />
rolls up to a length of 20 m and with a weight of 190 kg. These are force-locked<br />
together at the sides by shackles, with minimum slip. The nets can be optimally<br />
stretched over the rock surface using simple spike plates.<br />
Along with corrosion <strong>protection</strong> which has likewise undergone improvement,<br />
probably the most important new feature is the freedom of choice in the<br />
positions of the anchors. This permits optimal adaptation of the nailing to<br />
the project specifi c circumstances which has a positive infl uence of the supporting<br />
behavior. This step was an essential milestone in the history of rope<br />
nets.<br />
Due to the freedom of choice in the arrangement of the nailing, e.g. surrounding<br />
a critical block, this can be optimally secured via a back anchored net.<br />
Here, optimal means using the least number of anchoring points, securing<br />
the block so that it can only move in its position to the degree permitted by<br />
the project requirements. Assuming the block cannot be directly stabilized<br />
via a dowel or an anchor.<br />
Representative of this new kind of rock <strong>protection</strong> <strong>system</strong> satisfying the re-<br />
quirement for a free choice of nail arrangement is the SPIDER ® rock <strong>protection</strong><br />
<strong>system</strong>. The spiral rope used for this application consists of three twisted<br />
together high-tensile steel wires, each 4 mm in diameter, with a yield stress<br />
of at least 1,770 N/mm2 . This spiral rope is fi rst crisscrossed to form the spiral<br />
shape and then twisted together to form a net. The ends of the spiral cables<br />
are tied to one an-other to permit the full transmission of force to the adjoining<br />
panels.<br />
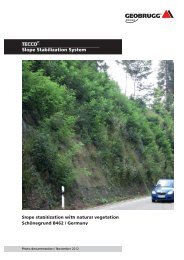
The following photos are intended to provide a brief overview of the application<br />
possibilities of the SPIDER ® rock <strong>protection</strong> <strong>system</strong>.<br />
There follows a detailed description of the test concept of the large scale fi eld<br />
test, the performed tests and the determining infl uencing variables. Finally<br />
the knowledge thus gained and the fi nal conclusions are summarized. The<br />
large scale fi eld tests were carried out in the framework of a joint research<br />
project of <strong>Geobrugg</strong> <strong>AG</strong>, Rüegger+Flum <strong>AG</strong>, alpS-Zentrum für Naturgefahren<br />
und Risikomanagement and the University of Innsbruck.<br />
Fig. 1: Taubenlochschlucht near Biel,<br />
Switzerland<br />
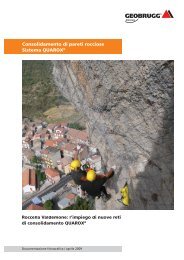
Fig. 2: Gondo, Switzerland<br />
3
SPIDER ® <strong>Rock</strong> <strong>protection</strong> <strong>system</strong> / Technical documentation / March 2010<br />
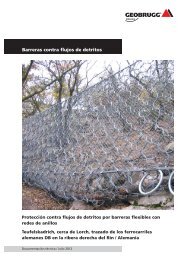
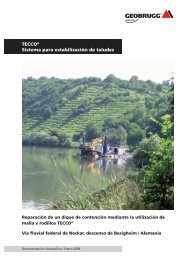
Fig. 3: Blow-out niche as test terrain<br />
Fig. 4: Anchorage arrangement<br />
Fig. 5: General view of the Calanda<br />
massif, west of Chur, Switzerland with<br />
the test location<br />
4<br />
TEST CONCEPT<br />
The objectives of the large scale fi eld tests were to investigate under the<br />
most realistic conditions the supporting behavior of the rock <strong>protection</strong><br />
<strong>system</strong>, the interaction between the <strong>system</strong> components and the direction,<br />
also the level of the forces transferred from the unstable block via the net<br />
into the individual anchorage points in a 1:1 scale under different boundary<br />
conditions.<br />
For this purpose an ideal site was found at the foot of the Calanda massif<br />
in the district of Felsberg west of Chur, Grisons, Switzerland, which was accessible<br />
to transport vehicles and satisfi ed the work safety requirements.<br />
Thanks to the support of the local community and a local contractor, the<br />
test installation was speedily erected and the necessary auxiliary equipment<br />
made available without problems.<br />
This comprised a U-shaped blow-out niche, open at the bottom. The sliding<br />
surface slopes forward at an angle of approx. 55°, therefore away from the<br />
Rheintal. In this area the banking thickness of the solid limestone is approximately<br />
0.40 m and corresponds to the thickness of the blown-out slab.<br />
The carbonate formation belongs to the Helvetian blanket and was steeply<br />
inclined through the mountain folding process.<br />
The width of the niche is approximately 2.5 m at the top widening to approximately<br />
4.0 m towards the bottom. The length viewed in the line of dip<br />
measures approximately 3.5 m. The lower area of the test site is formed<br />
more or less vertical over a height of approximately 2.5 m.<br />
Directly above the test site a light-weight fence was erected as a work<br />
<strong>protection</strong> from dislodged small stones, for example by rock goats or by<br />
weathering.<br />
Three nails type GEWI with D = 28 mm were installed above, below and at<br />
both sides of the niche for the point anchorage of the net. In addition two<br />
anchors were installed at the side in the niche itself. This arrangement permitted<br />
tests, taking into account different anchor confi gurations.<br />
Test location
It was also possible to mount a stranded rope with a diameter D = 14 mm<br />
laterally both top and bottom against spiral rope anchors with D = 14.5 mm.<br />
The anchorage length of the nails was 1.0 – 1.5 m and that of the spiral rope<br />
anchor 1.5 m. The nails in each group were approximately 1.0 m apart. Figure<br />
6 shows the anchorage arrangement.<br />
Fig. 8: Positioning the test block<br />
Fig. 6: Arrangement of the anchorages<br />
Fig. 10: Setting up the test installation Fig. 11: Overall view of the test <strong>system</strong><br />
without the inclusion of a boundary<br />
rope<br />
5
SPIDER ® <strong>Rock</strong> <strong>protection</strong> <strong>system</strong> / Technical documentation / March 2010<br />
Fig. 10: Test to investigate the infl uence<br />
of the boundary rope on the supporting<br />
behavior and the forces<br />
Fig.11: Hemp rope for releasing the<br />
block<br />
Fig. 12: Measuring the direction and<br />
inclination of the force measuring cells<br />
using a geologist’s compass and an<br />
inclinometer<br />
6<br />
To permit the performance of the tests under the most natural conditions, a<br />
more or less cubical test block from the neighboring stone quarry was used,<br />
whose roughness corresponded to the rock in the area of the test site. Its<br />
weight was 1160 kg. Two lengths of reinforcing bar bent to form loops were<br />
cemented in to the top edge of the test block. These enabled the block to be<br />
suspended and brought into position using a crane rope (Habegger).<br />
The block displacement was measured via a cable pull potentiometer with a<br />
maximum measuring length of 1500 mm.<br />
Specially developed aluminum force measuring plates were used to measure<br />
the forces transferred via the net to the various anchorage points. In this way<br />
it was possible to adapt these optimally to the test conditions.<br />
With large scale fi eld tests the main problem is to record all relevant infl u-<br />
ences but avoid as far as possible unavoidable constraints which are not quan-<br />
tifi able using measuring techniques. Therefore on the basis of many years’<br />
test experience, the anchorages, including the geometry of the niche were<br />
selected so that these could be defl ected and loaded more or less freely and<br />
without constraints. In addition to the electronic recording of the forces, the<br />
direction vectors of the force measuring cells were measured before and after<br />
the test. This enabled the reaction of the net and the boundary ropes on the<br />
anchorages to be determined as realistically as possible. Another test comprised<br />
suddenly causing the block to slip. This was achieved using a hemp rope<br />
which thanks to the friction through twice encircling the suspension, was able<br />
to be released manually.<br />
As a basis for the back calculation the anchor points were calibrated with an<br />
accuracy of +/- 5 cm. The following fi gure shows the spatial position of the<br />
anchorages. A marks the suspension point. Points 13 – 16 represent the positions<br />
of the spiral anchors.
FRICTION TESTS<br />
Before starting with the actual tests using a rope net, friction tests were carried<br />
out as a basis for the subsequent analysis of the forces. The friction angle between<br />
the test block and the sliding surface was able to be determined by making a<br />
distinction between static and sliding friction. The force necessary to hold the<br />
block in place was measured in order to determine the static friction. To measure<br />
the sliding friction the block was lowered in a linear fashion by means of a cable<br />
crane (Habegger) over a length of approximately 0.20 - 0.25 m and the force was<br />
measured dependent upon time and displacement (cf. fi g. 19). The force fl uctuations<br />
are due to the lever movement necessary for actuating the Habegger.<br />
The dark staircase line describes the displacement of the block over time and the<br />
grey line shows the force in the cable over time. The curves up to the start at 17<br />
sec. result from the relieving of load via the chain hoist. The results from the fric-<br />
tion tests were as follows: for the static friction, a friction angle of ϕ = 28 – 29°<br />
H<br />
and for the sliding friction, a friction angle of ϕ = 24 – 25°.<br />
G<br />
Fig. 13: Central perspective side view<br />
showing the spatial position of the<br />
anchor<br />
Fig. 14: Friction tests<br />
Fig. 15: Result of a friction test for<br />
measuring the sliding friction. The dark<br />
staircase line describes the displacement<br />
of the block over time and the<br />
grey line shows the force in the cable<br />
over time. The curves up to the start at<br />
17 sec. result from the relieving of load<br />
via the chain hoist.<br />
7
SPIDER ® <strong>Rock</strong> <strong>protection</strong> <strong>system</strong> / Technical documentation / March 2010<br />
Fig. 16: Overview and confi guration I<br />
Fig. 17: Confi guration II (left) and III<br />
(right)<br />
Fig. 18: Confi guration IV (left) and V<br />
(right)<br />
Fig. 19: Confi guration VI (left) and VII<br />
(right)<br />
8<br />
LARGE SCALE FIELD TESTS<br />
A total of 29 tests were performed. 7 different anchorage confi gurations were<br />
taken into account.
Since a discussion of the test results for all confi gurations would be outside<br />
the scope of this paper, the description and analysis is restricted to two examples.<br />
The following were covered: test 7 with consideration for confi guration<br />
I and test 20 with consideration for confi guration V.<br />
Test 7<br />
The following representation shows the spatial orientation of the force vectors<br />
in the anchorages, both before and after the test. The direction of these<br />
vectors is determining for the equilibrium analysis taking into account their<br />
values.<br />
The progress of the forces over time was able to be recorded with adequate<br />
accuracy using a measuring frequency of 25 Hz. A distinction is made between<br />
the load immediately upon impact (peak) and the subsequent forces (residual<br />
value) when the block is once again at rest.<br />
In test 7 for example the maximum force in anchorage 11 (force in the middle<br />
at the bottom, see fi gure 16) is 11.2 kN which then falls to 9.1 kN. The acceleration<br />
of the block, also the rigidity of the <strong>system</strong> with the braking process<br />
has a direct infl uence. The more the block can accelerate, the greater the<br />
dynamic effects.<br />
The measuring device permitted the measurement of a maximum of 8 channels<br />
in parallel. So it was possible to measure another 7 forces in addition to<br />
the position pick-up. As a result of this, connection of the force measuring<br />
cell at anchorage 1 was not possible with test 7. In Table 1 those values were<br />
interpolated as appropriate around the block, taking into account the force<br />
distribution.<br />
Fig. 20: Test 6 confi guration I<br />
Fig. 21: Spatial orientation of the force<br />
vectors<br />
Fig. 22: Measured forces in the<br />
anchorages<br />
9
SPIDER ® <strong>Rock</strong> <strong>protection</strong> <strong>system</strong> / Technical documentation / March 2010<br />
Fig. 23: Max. and residual forces<br />
in test 7<br />
Tab. 1: Dynamic effects, residual forces<br />
and relationships in test 7<br />
10<br />
top 1 2 3 1+2+3<br />
dynamic [kN] 5.5<br />
5.8<br />
5.2<br />
16.6<br />
residual [kN] 4.6<br />
4.9<br />
4.1<br />
13.6<br />
bottom 10 11 12 10+11+12<br />
dynamic [kN] 2.7<br />
11.2<br />
0.6<br />
14.5<br />
residual [kN] 2.2<br />
9.1<br />
0.3<br />
11.6<br />
side 5 8 Ø<br />
dynamic [kN]<br />
5.1<br />
4.2<br />
4.7<br />
residual [kN]<br />
4.2<br />
3.6<br />
3.9<br />
force relationship: bottom - top η<br />
dynamic<br />
0.87<br />
residual<br />
0.85<br />
force relationship: side - top ζ<br />
dynamic<br />
0.28<br />
residual<br />
0.29<br />
dynamic - residual relations κDR top<br />
1.22<br />
bottom<br />
1.25<br />
side<br />
1.20<br />
The maximum forces under dynamic actions are essentially dependent on the<br />
acceleration or deceleration during the braking process. The velocity or deceleration<br />
was determined by diverting the displacement over time once or<br />
twice. For example the following maximum values resulted from test 7:<br />
maximum velocity = 1.12 m/s<br />
maximum acceleration = +3.19 m/s 2<br />
maximal delay = –6.58 m/s 2<br />
A comparison of the forces from the dynamic action and the relevant maximum<br />
residual forces with the forces determined purely statically on the basis<br />
of the RUVOLUM ® ROCK concept [1], taking into account a three-dimensional<br />
equilibrium consideration, yields the factors stated in the following<br />
table.
forces from static back calculation kN<br />
total force to be transferred upwards<br />
9.2<br />
total force to be transferred downwards<br />
7.8<br />
total force to be transferred sideways<br />
2.8<br />
dynamic – static relationships κDS top<br />
1.8<br />
bottom<br />
1.85<br />
side<br />
1.69<br />
residual – static relationships κRS top<br />
1.48<br />
bottom<br />
1.48<br />
side<br />
1.41<br />
This example shows that through the dynamic infl uence, the maximum<br />
forces occurring in reality are signifi cantly greater than those estimated<br />
purely statically. For instance the result obtained in test 7 is a factor of κ DS<br />
= 1.69 – 1.85.<br />
Also clear is that the remaining residual forces in the <strong>system</strong> are still approximately<br />
higher by a factor of κ = 1.41 – 1.48 than those statically de-<br />
RS<br />
termined. This is explained by the fact that through sliding into the net the<br />
boulder also becomes wedged against the subsoil. The <strong>system</strong> is not elastic<br />
enough to enable the boulder to spring back suffi ciently and to relieve the<br />
net once again. Through this constraint the boulder is protected from sliding<br />
down further due to the mobilization of additional friction.<br />
Test 20<br />
Test 20 is based on confi guration V. 14 mm stranded ropes are braced laterally<br />
at the top and bottom against the spiral anchors D = 14.5 mm (anchorage<br />
points No. 13 – 16). At the top and bottom the net, together with the boundary<br />
ropes is suspended at two anchors. The net is also held by two anchors at<br />
the side. The side edges are not additionally reinforced via boundary ropes.<br />
The following photos show the situation at the start and end of the test. The<br />
rigidity of the protective measure and the associated load transfer are essentially<br />
infl uenced through the arrangement of the supporting ropes.<br />
In contrast to test 7, in test 20 certain forces are also transferred via the top<br />
and bottom supporting rope. This renders an analysis of the force transfer<br />
more complex.<br />
Tab. 2: Statically determined forces and<br />
relationships<br />
11
SPIDER ® <strong>Rock</strong> <strong>protection</strong> <strong>system</strong> / Technical documentation / March 2010<br />
Fig. 24: Test 20 at start of test<br />
Fig. 25: At the end of test, defl ection of<br />
the bottom boundary rope<br />
Fig. 26: Spatial orientation of the force<br />
vectors<br />
Fig. 27: Measured forces in the anchorages<br />
12
Represented in Table 3 are the forces from the maximum dynamic action<br />
(peaks) together with the corresponding residual values. The forces S u and S o<br />
mentioned in Figure 27 correspond to the forces in the top and bottom bound-<br />
ary ropes. The force in anchorage 5 was set on the basis of the results from<br />
the other tests at 50% of the force in anchorage 4. These tests with boundary<br />
ropes exhibited a more or less symmetrical supporting behavior. For this<br />
reason the forces in the side anchorages 7 and 8 were selected identical to<br />
the values in anchorages 4 und 5.<br />
top anchorages 1 3 1+3<br />
dynamic [kN]<br />
9.2<br />
8.8<br />
18.0<br />
residual [kN]<br />
3.3<br />
3.6<br />
6.9<br />
bottom anchorages 10 12 10+12<br />
dynamic [kN]<br />
5.9<br />
3.4<br />
9.3<br />
residual [kN]<br />
2.7<br />
1.7<br />
4.4<br />
side anchorages 4 / 7 5 / 8 4+5/7+8<br />
dynamic [kN]<br />
7.4<br />
3.7<br />
11.1<br />
residual [kN]<br />
2.4<br />
1.2<br />
3.6<br />
boundary ropes top bottom<br />
dynamic<br />
6.5<br />
15.0<br />
residual<br />
2.3<br />
6.1<br />
force relationships bottom : top η<br />
dynamic<br />
0.52<br />
residual<br />
0.64<br />
force relationships side : top ζ<br />
dynamic<br />
0.61<br />
residual<br />
0.52<br />
dynamic - residual relationships κ DR<br />
top anchorages 2.63<br />
bottom anchorages 2.13<br />
side anchorages 3.09<br />
top boundary rope 2.77<br />
bottom boundary rope 2.45<br />
Fig. 28: Max. and residual forces in<br />
graph form<br />
Tab. 3: Dynamic actions, residual forces<br />
13
SPIDER ® <strong>Rock</strong> <strong>protection</strong> <strong>system</strong> / Technical documentation / March 2010<br />
Tab. 4: Statically determined forces and<br />
relationships<br />
14<br />
Compared with test 7 the acceleration path was approximately twice as long<br />
at 1050 mm. This directly infl uenced the maximum velocity and the accel-<br />
eration. The following maximum values were measured in test 20:<br />
• maximum velocity = 2.30 m/s<br />
• maximum acceleration =+6.42 m/s 2<br />
• maximum delay = –15.67 m/s 2<br />
The acceleration in test 20 was higher by a factor of 2.0 compared to test 7<br />
and the delay was even greater by a factor of 2.4. Through the arrangement<br />
of the boundary ropes the <strong>protection</strong> <strong>system</strong> had a more rigid action. The<br />
fact that in test 20 the 2 side anchorages contributed certainly also had a<br />
stiffening infl uence. The relationship of the upwardly transferred forces to<br />
the total forces directed downwards falls to η = 0.52 - 0.64. On the other<br />
hand the side anchorages gain infl uence with ζ = 0.52 – 0.61.<br />
If the forces from the static back calculation are compared with the measured<br />
dynamic maximum values the resulting relationship is κ = 2.3 – 2.7. An<br />
DS<br />
interesting point is that the κ relationships are almost 1.0. This means that<br />
RS<br />
through the arrangement of the supporting ropes the boulder is less clamped<br />
and the <strong>system</strong> behavior is signifi cantly more elastic. In this case the residual<br />
forces can be estimated with suffi cient accuracy with a simple equilibrium<br />
consideration.<br />
forces from static back calculation kN<br />
total force to be transferred upwards<br />
6.8<br />
total force to be transferred downwards<br />
4.1<br />
total force to be transferred sideways<br />
4.1<br />
dynamic – static relationships κDS top<br />
2.6<br />
bottom<br />
2.3<br />
side<br />
2.7<br />
residual – static relationships κRS top<br />
1.0<br />
bottom<br />
1.1<br />
side<br />
0.9
KNOWLEDGE GAINED AND CONCLUSIONS<br />
FOR PRACTICE<br />
Spiral rope nets, fabricated like mesh cover, provide new possibilities for securing<br />
unstable boulders prone to come loose on steep slopes due to their<br />
high longitudinal and transverse tensile strength and their high knot strength,<br />
which is important if the anchorage is subjected to a point force.<br />
The forces measured in before made model experiments scaled 1:3.5 in reallife<br />
scenarios were congruent with the results derived from the simple twodimensional<br />
theoretical model.<br />
The large scale fi eld tests showed the practical suitability of rope nets such<br />
as e.g. the SPIDER ® rock <strong>protection</strong> nets. Further, a range of tests enabled<br />
the direction and amount of the force vectors to be determined dependent<br />
on the arrangement of the anchorages. The acceleration distance of the<br />
boulder played an important role here. The tests yielded the following information<br />
and conclusions for practice:<br />
If a critical boulder is calculated purely statically on the basis of an<br />
equilibrium consideration the forces in the anchorages can sometimes<br />
be massively underestimated. As shown from the tests, the forces<br />
from the dynamic infl uence exceed the statically determined forces<br />
by a factor of 1.5 – 2.5 or more. Consequently a dynamic factor κ is D<br />
to be taken into account when dimensioning fl exible rock <strong>protection</strong><br />
<strong>system</strong>s.<br />
In principle the forces are more likely to be transferred upwards. The<br />
size of the relationship η of the upward forces to the downward<br />
forces depends on the nature of the meshing of the boulder with the<br />
rope net and whether boundary ropes are installed.<br />
The large scale fi eld tests have shown that when using a large mesh<br />
net for securing individual boulders, boundary ropes are to be fi tted<br />
to the top and bottom and where possible also at the sides. This can<br />
essentially improve the supporting behavior of the <strong>system</strong>.<br />
The dimensioning of fl exible rock <strong>protection</strong> <strong>system</strong>s can be carried<br />
out using a simple model based on the equilibrium consideration. It is<br />
obligatory for the individual relationship factors and above all the<br />
dynamic effects to be adapted to the local and project specifi c<br />
circumstances.<br />
LITERATURE<br />
[1] Rüegger, R.; Flum, D.: Eine neue Generation von Spiralseilnetzen zur Sicherung von Felsbö-<br />
schungen – Versuche, Bemessung, Anwendungsbeispiele. Technical Academy Esslingen, 6th<br />
Colloquium: Bauen in Boden und Fels, January 2008, Ostfi ldern, Germany<br />
15
<strong>Geobrugg</strong> protects people and infrastructures from the<br />
forces of nature<br />
It is the task of our engineers and partners to analyze the problem<br />
together with you in detail and then, together with local consultants,<br />
to present solutions. Painstaking planning is not the only thing<br />
you can expect from us, however; since we have our own production<br />
plants on three continents, we can offer not only short delivery paths<br />
and times, but also optimal local customer service. With a view towards<br />
a trouble-free execution, we deliver preassembled and clearly<br />
identifi ed <strong>system</strong> components right to the construction site. There<br />
we provide support, if desired, including technical support – from<br />
installation right on up until acceptance of the structure.<br />
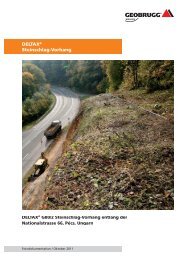
<strong>Rock</strong>fall barriers<br />
<strong>Rock</strong>fall drapes<br />
Slope stabilization <strong>system</strong>s<br />
Debris fl ow barriers<br />
Avalanche prevention structures<br />
Open pit rockfall barriers<br />
Special applications<br />
<strong>Geobrugg</strong> <strong>AG</strong><br />
Geohazard Solutions<br />
Aachstrasse 11 CH-8590 Romanshorn<br />
Phone +41 71 466 81 55 Fax +41 71 466 81 50<br />
www.geobrugg.com info@geobrugg.com<br />
A company of the BRUGG Group ISO 9001 certifi ed<br />
1.402.23.EN.1002