SMALL DAMS
SMALL DAMS - Comité Français des Barrages et Réservoirs
SMALL DAMS - Comité Français des Barrages et Réservoirs
- No tags were found...

You also want an ePaper? Increase the reach of your titles
YUMPU automatically turns print PDFs into web optimized ePapers that Google loves.
Chapter II<br />
STATISTICAL RAINFALL AND RUNOFF DISTRIBUTIONS<br />
Figure 2 (p. 35) shows rainfall and runoff on the vertical scale versus the standardised<br />
GUMBEL u.<br />
The concave shape of the two curves is explained by the fact that events of very short<br />
return periods are plotted. The asymptotic rainfall distribution appears if we limit<br />
ourselves to the 27 most severe events (one event per year). It is not unusual for the<br />
most severe event (September 13th, 1968) to lie some distance off the curve.<br />
Since there is considerable sampling uncertainty in a 27 value sample, the computations<br />
were run on the 150 most severe rainfall events observed for each of the durations<br />
considered in determining the asymptote slopes, proportional to the standard deviations.<br />
For this example, the fitting method would appear to overestimate the frequency of<br />
the highest values. This is attributable to the sampling alone, and application of this<br />
fitting method to samples of other rainfall durations yields estimates that are either<br />
entirely consistent, or underestimated (points concave downwards). Results are listed<br />
in table 4.<br />
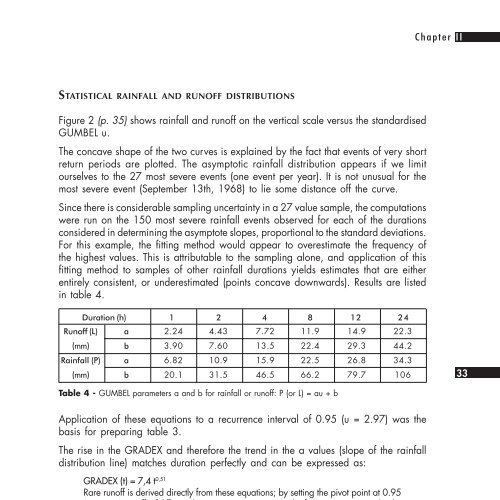
Duration (h) 1 2 4 8 12 24<br />
Runoff (L) a 2.24 4.43 7.72 11.9 14.9 22.3<br />
(mm) b 3.90 7.60 13.5 22.4 29.3 44.2<br />
Rainfall (P) a 6.82 10.9 15.9 22.5 26.8 34.3<br />
(mm) b 20.1 31.5 46.5 66.2 79.7 106<br />
33<br />
Table 4 - GUMBEL parameters a and b for rainfall or runoff: P (or L) = au + b<br />
Application of these equations to a recurrence interval of 0.95 (u = 2.97) was the<br />
basis for preparing table 3.<br />
The rise in the GRADEX and therefore the trend in the a values (slope of the rainfall<br />
distribution line) matches duration perfectly and can be expressed as:<br />
GRADEX (t) = 7,4 t 0,51<br />
Rare runoff is derived directly from these equations; by setting the pivot point at 0.95<br />
(u = 2.97), runoffs of different duration at recurrence intervals of 0.999 are estimated at the<br />
values shown in table 5.<br />
Duration 1 2 4 8 12 24<br />
(hours)<br />
Runoff 37.2 63.3 98.6 146 179 245<br />
(mm)<br />
Table 5 - Estimation of runoff at recurrence interval 0.999