

BEUTEL GOODMAN MANAGED FUNDS
Annual Financial Report - Beutel, Goodman & Company Ltd.
Annual Financial Report - Beutel, Goodman & Company Ltd.

You also want an ePaper? Increase the reach of your titles
YUMPU automatically turns print PDFs into web optimized ePapers that Google loves.
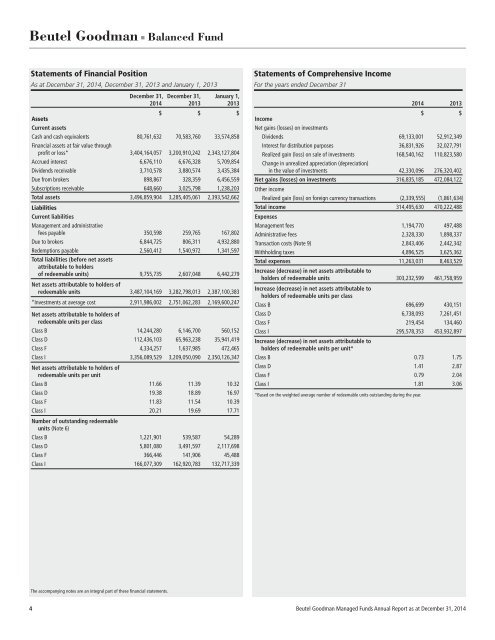
Beutel Goodman ■ Balanced Fund<br />
Statements of Financial Position<br />
As at December 31, 2014, December 31, 2013 and January 1, 2013<br />
December 31, December 31, January 1,<br />
2014 2013 2013<br />
$ $ $<br />
Assets<br />
Current assets<br />
Cash and cash equivalents 80,761,632 70,583,760 33,574,858<br />
Financial assets at fair value through<br />
profit or loss* 3,404,164,057 3,200,910,242 2,343,127,804<br />
Accrued interest 6,676,110 6,676,328 5,709,854<br />
Dividends receivable 3,710,578 3,880,574 3,435,384<br />
Due from brokers 898,867 328,359 6,456,559<br />
Subscriptions receivable 648,660 3,025,798 1,238,203<br />
Total assets 3,496,859,904 3,285,405,061 2,393,542,662<br />
Liabilities<br />
Current liabilities<br />
Management and administrative<br />
fees payable 350,598 259,765 167,802<br />
Due to brokers 6,844,725 806,311 4,932,880<br />
Redemptions payable 2,560,412 1,540,972 1,341,597<br />
Total liabilities (before net assets<br />
attributable to holders<br />
of redeemable units) 9,755,735 2,607,048 6,442,279<br />
Net assets attributable to holders of<br />
redeemable units 3,487,104,169 3,282,798,013 2,387,100,383<br />
*Investments at average cost 2,911,986,002 2,751,062,283 2,169,600,247<br />
Net assets attributable to holders of<br />
redeemable units per class<br />
Class B 14,244,280 6,146,700 560,152<br />
Class D 112,436,103 65,963,238 35,941,419<br />
Class F 4,334,257 1,637,985 472,465<br />
Class I 3,356,089,529 3,209,050,090 2,350,126,347<br />
Net assets attributable to holders of<br />
redeemable units per unit<br />
Class B 11.66 11.39 10.32<br />
Class D 19.38 18.89 16.97<br />
Class F 11.83 11.54 10.39<br />
Class I 20.21 19.69 17.71<br />
Number of outstanding redeemable<br />
units (Note 6)<br />
Class B 1,221,901 539,587 54,289<br />
Class D 5,801,080 3,491,597 2,117,698<br />
Class F 366,446 141,906 45,488<br />
Class I 166,077,309 162,920,783 132,717,339<br />
Statements of Comprehensive Income<br />
For the years ended December 31<br />
Income<br />
Net gains (losses) on investments<br />
2014 2013<br />
$ $<br />
Dividends 69,133,001 52,912,349<br />
Interest for distribution purposes 36,831,926 32,027,791<br />
Realized gain (loss) on sale of investments 168,540,162 110,823,580<br />
Change in unrealized appreciation (depreciation)<br />
in the value of investments 42,330,096 276,320,402<br />
Net gains (losses) on investments 316,835,185 472,084,122<br />
Other income<br />
Realized gain (loss) on foreign currency transactions (2,339,555) (1,861,634)<br />
Total income 314,495,630 470,222,488<br />
Expenses<br />
Management fees 1,194,770 497,488<br />
Administrative fees 2,328,330 1,898,337<br />
Transaction costs (Note 9) 2,843,406 2,442,342<br />
Withholding taxes 4,896,525 3,625,362<br />
Total expenses 11,263,031 8,463,529<br />
Increase (decrease) in net assets attributable to<br />
holders of redeemable units 303,232,599 461,758,959<br />
Increase (decrease) in net assets attributable to<br />
holders of redeemable units per class<br />
Class B 696,699 430,151<br />
Class D 6,738,093 7,261,451<br />
Class F 219,454 134,460<br />
Class I 295,578,353 453,932,897<br />
Increase (decrease) in net assets attributable to<br />
holders of redeemable units per unit*<br />
Class B 0.73 1.75<br />
Class D 1.41 2.87<br />
Class F 0.79 2.04<br />
Class I 1.81 3.06<br />
*Based on the weighted average number of redeemable units outstanding during the year.<br />
The accompanying notes are an integral part of these financial statements.<br />
4 Beutel Goodman Managed Funds Annual Report as at December 31, 2014