

Cardiff
Liveable city report 2015 Final
Liveable city report 2015 Final

Create successful ePaper yourself
Turn your PDF publications into a flip-book with our unique Google optimized e-Paper software.
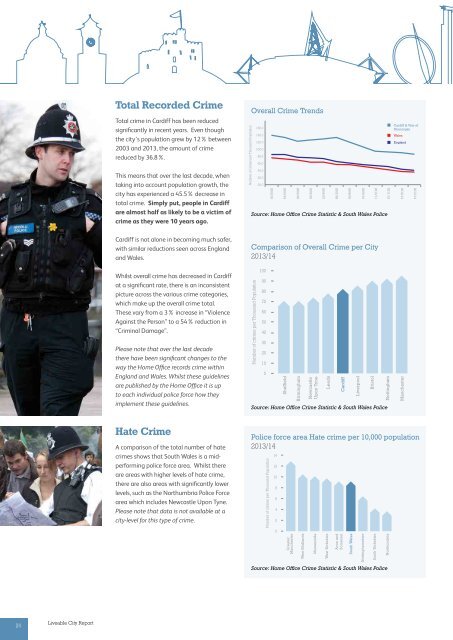
Total Recorded Crime<br />
Total crime in <strong>Cardiff</strong> has been reduced<br />
significantly in recent years. Even though<br />
the city’s population grew by 12% between<br />
2003 and 2013, the amount of crime<br />
reduced by 36.8%.<br />
This means that over the last decade, when<br />
taking into account population growth, the<br />
city has experienced a 45.5% decrease in<br />
total crime. Simply put, people in <strong>Cardiff</strong><br />
are almost half as likely to be a victim of<br />
crime as they were 10 years ago.<br />
Overall Crime Trends<br />
Source: Home Office Crime Statistic & South Wales Police<br />
<strong>Cardiff</strong> is not alone in becoming much safer,<br />
with similar reductions seen across England<br />
and Wales.<br />
Comparison of Overall Crime per City<br />
2013/14<br />
Whilst overall crime has decreased in <strong>Cardiff</strong><br />
at a significant rate, there is an inconsistent<br />
picture across the various crime categories,<br />
which make up the overall crime total.<br />
These vary from a 3% increase in “Violence<br />
Against the Person” to a 54% reduction in<br />
“Criminal Damage”.<br />
Please note that over the last decade<br />
there have been significant changes to the<br />
way the Home Office records crime within<br />
England and Wales. Whilst these guidelines<br />
are published by the Home Office it is up<br />
to each individual police force how they<br />
implement these guidelines.<br />
Source: Home Office Crime Statistic & South Wales Police<br />
Hate Crime<br />
A comparison of the total number of hate<br />
crimes shows that South Wales is a midperforming<br />
police force area. Whilst there<br />
are areas with higher levels of hate crime,<br />
there are also areas with significantly lower<br />
levels, such as the Northumbria Police Force<br />
area which includes Newcastle Upon Tyne.<br />
Please note that data is not available at a<br />
city-level for this type of crime.<br />
Police force area Hate crime per 10,000 population<br />
2013/14<br />
Source: Home Office Crime Statistic & South Wales Police<br />
24<br />
Liveable City Report