Annual Report
annual-report-2015
annual-report-2015

You also want an ePaper? Increase the reach of your titles
YUMPU automatically turns print PDFs into web optimized ePapers that Google loves.
G.6.<br />
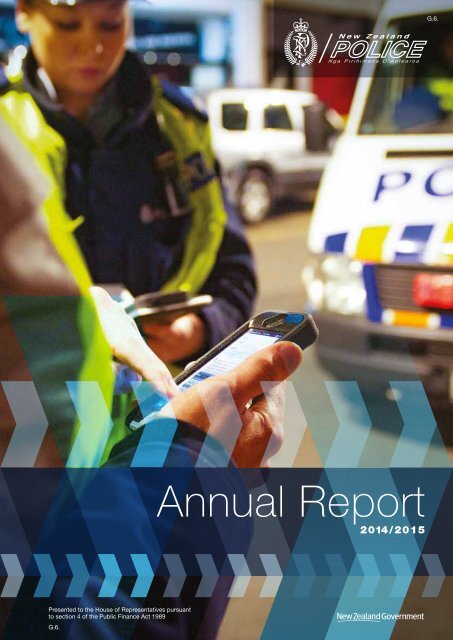
<strong>Annual</strong> <strong>Report</strong><br />
2014/2015<br />
Presented to the House of Representatives pursuant<br />
to section 4 of the Public Finance Act 1989<br />
G.6.
CROWN COPYRIGHT ©<br />
ISSN [1176-2497] (PDF)<br />
ISSN [1178-1823] (HTML)<br />
This work is licensed under the Creative Commons Attribution 3.0 New Zealand licence. In essence, you are free to copy, distribute and adapt the work,<br />
as long as you attribute the work to the Crown and abide by the other licence terms.<br />
To view a copy of this licence, visit http://creativecommons.org/licenses/by/3.0/nz/.<br />
Please note that no departmental or governmental emblem, logo or Coat of Arms may be used in any way which infringes any provision of the Flags, Emblems,<br />
and Names Protection Act 1981. Attribution to the Crown should be in written form and not by reproduction of any such emblem, logo or Coat of Arms.
CONTENTS<br />
Commissioner’s Foreword 2<br />
1. What We Set Out to Achieve 5<br />
2. Statement of Responsibility 34<br />
3. Performance Information Supporting the Appropriation 35<br />
4. Financial Statements 59<br />
5. Audit <strong>Report</strong> 92<br />
6. Prospective Financial Statements 94<br />
Appendix 1: Policing Excellence: the Future 98<br />
Appendix 2: How We Meet Government Priorities 105<br />
Appendix 3: How We Work With Others 111<br />
Appendix 4: Commission of Inquiry Change Management Progress <strong>Report</strong> 114<br />
Appendix 5: Profile of Our People 136<br />
Appendix 6: Information Required by Statute 148<br />
This <strong>Annual</strong> <strong>Report</strong> satisfies our statutory requirements under<br />
section 45 of the Public Finance Act 1989 and section 101 of the Policing Act 2008.<br />
ANNUAL REPORT 2014 2015<br />
1
COMMISSIONER’S FOREWORD<br />
Welcome to the Police <strong>Annual</strong> <strong>Report</strong> for the year ended 30 June 2015. I am proud to say that<br />
Police had another challenging and successful year. Our staff have made a significant contribution<br />
to ensuring that New Zealand is a safe place to live, work and conduct business. I would like to<br />
take this opportunity to thank our partners, and people in communities up and down the country,<br />
who work with us day in, day out, to ensure that New Zealanders can be safe and feel safe.<br />
This year the world’s eyes were on us as we delivered a number of major operations to protect<br />
New Zealanders, visitors and the country’s reputation. We provided visible, accessible policing<br />
services to two major international sporting events: the Cricket World Cup and the FIFA Under-20<br />
World Cup, ensured the commemorations of the 100th anniversary of the Gallipoli landings passed<br />
off safely and facilitated an official Royal visit.<br />
With the end of Policing Excellence in June 2014, came a year of consolidation to June 2015.<br />
Throughout the year we have maintained the performance gains achieved through Policing<br />
Excellence. We have continued to deliver against the<br />
Government’s Better Public Services targets, which<br />
have seen further reductions in the total crime rate<br />
and the youth crime rate, and excellent progress in<br />
reducing assaults on children. Our efforts to tackle<br />
violence in families have seen more people having the<br />
courage to come forward and report family violence,<br />
so that in conjunction with other government agencies<br />
and Non-Governmental Organisations (NGOs), we<br />
can reduce the harm caused by family violence.<br />
Policing Excellence set a very high bar for whatever<br />
came after it. The results were hard won, and we<br />
have gained the maximum benefit from the initiatives<br />
it contained. Over the course of Policing Excellence<br />
we saw crime fall, but at the same time demand for<br />
our services increased significantly. We received more<br />
calls for service for non-crime issues, such as people<br />
suffering from acute mental health issues, attempted<br />
suicides and missing people. We spent more time<br />
responding to family violence which now accounts for<br />
41% of our time spent on frontline response.<br />
Advances in technology have helped us deliver better<br />
services to New Zealanders by spending more time in<br />
local communities and less in the station, where they<br />
can make the biggest difference in preventing crime.<br />
We are sharing the results of our world-leading<br />
innovation globally, creating commercial partnerships<br />
to develop and find international markets for Policedeveloped<br />
applications that will return revenue and<br />
resources and enable us to further invest in our<br />
mobility capability.<br />
However, technological advances are also being used<br />
by criminals, making our investigations more complex.<br />
Policing Excellence<br />
Our strategic change programme,<br />
Policing Excellence, ended on<br />
30 June 2014, and resulted in a<br />
major transformation in the way that<br />
policing is delivered in New Zealand.<br />
At its outset we set ourselves the<br />
following targets:<br />
––<br />
a 13% reduction in recorded crime<br />
(20.1% achieved)<br />
––<br />
a 19% reduction in Police (nontraffic)<br />
apprehensions resolved by<br />
prosecution (41.3% achieved)<br />
––<br />
a 4 percentage point increase in<br />
expenditure on preventative activities<br />
(5.8% achieved)<br />
––<br />
increased public trust and confidence<br />
(now at 78%)<br />
––<br />
increased satisfaction with Police<br />
services (now at 84%)<br />
––<br />
an increase in feelings of safety<br />
––<br />
an increase in the proportion of our<br />
staff that are actively engaged.<br />
Over the course of Policing Excellence<br />
we delivered or exceeded each of<br />
these targets.<br />
2
Cyber crime is increasing and forcing us to rethink how we conceptualise crime, and how we work<br />
with intelligence and law enforcement agencies at home and overseas.<br />
At the same time, issues that caused us concern at the outset of Policing Excellence have not<br />
gone away. Māori remain over-represented at every stage of the criminal justice system. I am<br />
particularly concerned that last year almost two thirds of child offenders appearing in the family<br />
court were Māori. The Turning of the Tide strategy developed by our Māori Focus Forum has<br />
meant we have made an excellent start in addressing this problem, but there is still much more<br />
we need to do.<br />
We asked our staff and partners to reflect on these challenges in designing the next phase of our<br />
transformation journey. The result of 39 workshops, involving over 600 people, generating more<br />
than 4,400 ideas was the blueprint for Policing Excellence: the Future. Through Policing Excellence:<br />
the Future we will focus on the following four key themes:<br />
––<br />
Safer Families<br />
––<br />
Iwi Partnerships<br />
––<br />
Evidence Based Policing<br />
––<br />
Service Delivery Model.<br />
Police proposes to address the four key themes through a number of initiatives, which once<br />
delivered will make New Zealand safer and reverse trends in family harm and Māori overrepresentation,<br />
through frontline staff delivering interventions underpinned by evidence, and<br />
supported by streamlined and technology enabled support services.<br />
Whilst Policing Excellence largely involved Police making changes to its processes and systems,<br />
Policing Excellence: the Future may require investment in Police. We are not alone in dealing<br />
with these challenges. We recognise that resources and interventions from other Justice and<br />
Social Sector agencies and NGOs need to be better aligned and coordinated to address deepseated<br />
‘system’ challenges. Police’s commitment to the cross government Family Violence and<br />
Sexual Violence Work Programme is a good example of the collaborative approach required to<br />
make a difference.<br />
I strongly believe that public trust and confidence in Police is vital in a functioning democracy<br />
underpinned by the rule of law. It is the basis of policing by consent. That is why I set a target of<br />
achieving 80% trust and confidence by 30 June 2017. In support of that target we added two new<br />
values (Valuing Diversity and Empathy) during 2015. Through all Police employees living our values<br />
every day we will engender the trust and confidence of everyone we come into contact with.<br />
The full list of our values is:<br />
––<br />
Professionalism<br />
––<br />
Respect<br />
––<br />
Integrity<br />
––<br />
Commitment to Māori and Treaty<br />
––<br />
Empathy<br />
––<br />
Valuing Diversity<br />
In conclusion, I believe that we made further strides towards delivering ‘safer communities<br />
together’ in 2014/15, and the plans we developed ensure that we will continue to do so.<br />
Mike Bush<br />
Commissioner of Police<br />
ANNUAL REPORT 2014 2015<br />
3
2014/2015 IN SUMMARY<br />
1,840,078<br />
calls answered<br />
791,662<br />
emergency calls<br />
147,535<br />
emergency events responded to<br />
645,787<br />
non-emergency events responded to<br />
99,127<br />
cases prosecuted<br />
115,992<br />
offenders brought to justice<br />
105,285<br />
victims supported<br />
261,442<br />
victimisations recorded<br />
11,980<br />
Police employees<br />
9,048<br />
constabulary staff and<br />
2,932<br />
support staff<br />
139,987<br />
foot patrols undertaken<br />
$1.5 billion<br />
Received from Government in 2014/15<br />
4
1. WHAT WE SET OUT TO ACHIEVE<br />
Police’s Priorities<br />
We outlined what we sought to achieve during the year in the 2014/15 Statement of Intent.<br />
The diagram below sets out the priorities we set ourselves, and that we will now use to<br />
assess our performance.<br />
Vision<br />
New Zealand Police has the trust and confidence of all;<br />
and people are safe and feel safe:<br />
Safer Communities Together<br />
Outcomes<br />
Protected<br />
Communities<br />
Improved<br />
road safety<br />
Less Crime<br />
More valued<br />
services<br />
People receive<br />
appropriate<br />
response<br />
New Zealand<br />
security interests<br />
are strengthened<br />
Less harm from<br />
crashes<br />
Less harm from<br />
crime<br />
The law is upheld<br />
through appropriate<br />
actions<br />
Trust and<br />
confidence in Police<br />
is maintained<br />
The public is<br />
satisfied with<br />
Police service<br />
Order is maintained<br />
Impacts<br />
People are<br />
protected from<br />
incidents that<br />
endanger their<br />
safety<br />
Communities are<br />
supported to resolve<br />
safety issues<br />
Key strategies<br />
for the<br />
medium-term<br />
National Operating Strategy: Prevention First,<br />
Road Policing Programme, The Turning of the Tide<br />
and other complementary strategies<br />
This section of the <strong>Annual</strong> <strong>Report</strong> outlines:<br />
––<br />
why our outcomes and impacts are important<br />
––<br />
what new initiatives or changes we introduced, or operations we carried out in 2014/15 to<br />
make a positive difference to our outcomes<br />
––<br />
how we performed against the performance measures for each outcome and impact.<br />
ANNUAL REPORT 2014 2015<br />
5
PRIORITY ONE:<br />
PROTECTED COMMUNITIES<br />
People receive appropriate Police response<br />
In 2014/15<br />
for every<br />
10,000<br />
population,<br />
there were…<br />
0.29<br />
cyclists killed or<br />
seriously injured<br />
301.4<br />
repeat victimisations<br />
12<br />
offences against children<br />
14.3<br />
offences against vulnerable adults<br />
0.72<br />
pedestrians killed<br />
or seriously injured<br />
Police responded to…<br />
4,245<br />
repeat mental<br />
health calls<br />
202,661<br />
repeat family<br />
incident calls<br />
46,783<br />
repeat<br />
emergency calls<br />
916<br />
noise control calls<br />
92%<br />
Successful search<br />
and rescue<br />
operations<br />
99.8%<br />
Successful missing<br />
person operations<br />
Maintain order and support communities<br />
3,022<br />
2,668<br />
2,922<br />
8% 8%<br />
78%<br />
78% 80% 80% 78%<br />
6% 6%<br />
68% 69% 69% 69% 69%<br />
2012/13 2013/14 2014/15<br />
Prosecutions relating to<br />
offences involving firearms<br />
2011/12 2012/13 2013/14 2014/15<br />
Breaches of Police Safety<br />
Orders<br />
2010/11 2011/12 2012/13 2013/14 2014/15<br />
Survey respondents who agree ‘Police is<br />
responsive to the needs of my community’<br />
and agree ‘Police are involved in activities in<br />
my community’<br />
6
Priority one: Protected Communities<br />
We know that most crime is carried out against a very small proportion of the population. The<br />
2015 New Zealand Crime and Safety Survey estimates that 3% of the population experiences<br />
53% of crime 1 . By working with partner organisations Police sought to reduce the level of repeat<br />
victimisation. Many of those amongst this small group are victims of family violence, which is why<br />
Safer Families is one of the key themes of Policing Excellence: the Future.<br />
Last year saw an increase in the number of repeat victimisations. The measure of repeat<br />
victimisation is very sensitive to reporting and recording levels.<br />
The priority we have given to providing excellent services to victims has meant that victims are<br />
more likely to disclose what has happened to them. This increase in reporting is largely due to our<br />
national operating strategy, Prevention First, putting victims at the centre of everything we do, and<br />
our adoption of ‘Empathy’ as one of our core values.<br />
From June 2014 we significantly improved the quality of our data, so that we have far more reliable<br />
information about victims. This change ensured we correctly captured victim information, and was<br />
introduced ahead of publishing monthly Recorded Crime Victimisation Statistics 2 .<br />
Number of repeat victimisations recorded per 10,000 population<br />
400<br />
300<br />
200<br />
100<br />
0<br />
2010/11 2011/12 2012/13 2013/14 2014/15<br />
We will track our progress in achieving the outcome of Protecting Communities through monitoring<br />
changes in results under the five impact areas of:<br />
––<br />
people receive appropriate Police response<br />
––<br />
New Zealand security interests are strengthened<br />
––<br />
people are protected from incidents that endanger their safety<br />
––<br />
order is maintained<br />
––<br />
communities are supported to resolve safety issues.<br />
1 The New Zealand Crime and Safety Survey (NZCASS) 2014, Ministry of Justice.<br />
2 More information about the introduction of the new Recorded Crime Victimisation Statistics can be found under the<br />
impact ‘Trust and confidence in Police is maintained’.<br />
ANNUAL REPORT 2014 2015<br />
7
People receive appropriate Police response<br />
If people are faced with an emergency situation we want to ensure that they can contact us quickly<br />
and easily, so that we can provide the right response. We prioritise people’s safety over the other<br />
demands on our resources, particularly people who are most vulnerable (for example, children,<br />
the elderly and those experiencing acute mental health difficulties). When we attend emergency<br />
situations we will often make a referral to a partner agency to prevent a reoccurrence, for example<br />
when attending someone suffering from acute mental distress we will refer them through to an<br />
appropriate health provider.<br />
What we did<br />
OnDuty<br />
Police added to the range of functions that can be carried out on the mobile devices issued to all<br />
frontline staff as part of Policing Excellence. At the beginning of the year an application which helps<br />
frontline officers keep on top of their RIOD (Real Time Intelligence for Operational Deployment)<br />
tasks while out in the community was rolled out. The new OnDuty application gives access to the<br />
MyTasks function, which allows RIOD tasks to be assigned to a specific officer via their mobility<br />
devices by District Command Centres, Sergeants and managers.<br />
Staff can view and update their tasks on their iPhone, reducing paperwork and minimising time<br />
spent at Police stations – in line with the Police priority to enable visible, effective and efficient<br />
policing through mobility.<br />
Mental Health<br />
Since the mid-1990s the number of Police incidents involving someone suffering from acute mental<br />
distress has increased three and a half times and the number of incidents involving threatened or<br />
attempted suicide has increased eight times, even when growth in the population is taken into<br />
account.<br />
71% of missing people reported to Police are current mental health patients (including dementia,<br />
which due to the aging population suggests this demand for Police services is only going to<br />
increase). This means that on an average day Police deal with over 100 people suffering from<br />
mental distress or who are suicidal.<br />
Police has established a project to address this growth in demand for its services. The independent<br />
governance group for the project is chaired by Dame Margaret Bazley and the Ministry of Health’s<br />
Director for Mental Health is a member. Good progress has been made on improving Police<br />
training so that people suffering mental distress receive an appropriate and sensitive response.<br />
Police is working with the Ministry of Health and the Independent Police Conduct Authority to<br />
develop a set of proposals to provide a better response to these issues.<br />
8
How we did<br />
Measure 2010/11 2011/12 2012/13 2013/14 2014/15<br />
Number of repeat victimisations recorded 258.3 253.3 232.1 237.6 301.4<br />
per 10,000 population [1]<br />
Number of repeat calls for service:<br />
• Emergency<br />
• Family incidents<br />
• Mental health issues<br />
New measure for 2014/15 46,783<br />
202,661<br />
4,245<br />
Percentage of people rescued as a result of<br />
search and rescue deployments<br />
Percentage of missing people cases<br />
resolved<br />
New measure for 2014/15<br />
New measure for 2014/15<br />
92%<br />
99.8%<br />
Notes<br />
[1] Repeat victimisations are defined as an individual who has been victimised more than once in the previous 12 months.<br />
New Zealand security interests are strengthened<br />
Police undertakes a critical role in protecting New Zealand’s national security interests. The greater<br />
ease of international travel, fast and affordable internet access, and a vast array of social media<br />
tools and applications means that the exchange of ideas and the promotion of violent extremism<br />
or terrorist ideologies has never been easier. New Zealand’s geographic isolation is no longer an<br />
effective defence against threats to its national security.<br />
While New Zealand’s current national threat level assessment is low, Police does all it can to ensure<br />
New Zealand is not used as a safe haven from which to plan or facilitate terrorist acts.<br />
Police’s National Security Operating Strategy endeavours to reduce the threat to New Zealand’s<br />
national interests from a very small percentage of people who support the use of violence to<br />
propagate their particular world view, attempt to recruit vulnerable individuals to their cause, and<br />
plan and/or attempt to commit terrorist-related criminal activity.<br />
We seek to:<br />
––<br />
Reduce risk associated with threats to New Zealand’s national security<br />
––<br />
promote Readiness to ensure that, in conjunction with our partners, we are ready to respond<br />
in the event of a threat manifesting<br />
––<br />
Respond to national security threats if they arise<br />
––<br />
support the Recovery of incident sites and affected communities.<br />
Overseas jurisdictions have indicated that support for violent extremism or terrorist ideologies is<br />
often associated with rejection of a cohesive, integrated, multi-faith society that exercises strong<br />
democratic civic values. Engaging communities is vital to ensure that New Zealand communities<br />
have the resilience to reject the values espoused by violent extremist narratives, and consolidate<br />
a sense of belonging to New Zealand and support for our core values.<br />
Although it is difficult to quantify, international studies would support the supposition that much<br />
of the everyday work that Police delivers via the Prevention First operating model, and Police’s<br />
long foundations in neighbourhood and community policing practices can help individuals,<br />
groups and communities in New Zealand become more confident and assured of their place in<br />
New Zealand society.<br />
ANNUAL REPORT 2014 2015<br />
9
Police and partner agencies continue to monitor and investigate potential threats to<br />
national security.<br />
In operational matters, Police was heavily involved in a national counter-terrorism exercise that<br />
helped prepare and test New Zealand’s counter terrorism security arrangements and relationships<br />
ahead of New Zealand hosting the ICC Cricket World Cup and the FIFA U20 World Cup in 2015.<br />
The exercise involved a considerable investment of Police resources to ensure that Police and<br />
partners were adequately prepared for any potential national security incident.<br />
What we did<br />
Cyber Crime<br />
Whilst overall crime rates have fallen, some categories of crime remain a concern. Cyber crime has<br />
continued to increase, and Police’s response has increased accordingly. Last year Police published<br />
the Prevention First: National Cyber Crime Operating Strategy. The focus of the strategy is cyber<br />
crime – offences that can only be committed using or against a computer – and high-end cyberenabled<br />
crime, where more traditional offending is facilitated by a computer. The role of overseeing<br />
the implementation of the strategy sits with the National Cyber Crime Centre.<br />
To ensure all frontline responders can deal appropriately with situations involving cyber elements<br />
the National Cyber Crime Centre has developed national training. The Centre also launched an<br />
intranet page, so that staff can find answers to common questions and guidance on where to go<br />
to find out more.<br />
The Centre takes a leading role in resolving hacking, phishing 3 or denial of service attacks or<br />
unmasking offenders trying to electronically hide their identities. Staff work closely with the<br />
Electronic Crime Laboratory – the other arm of Police’s Electronic Crime Group – where recovered<br />
electronic devices are examined.<br />
The Centre is divided into investigative and prevention teams, supporting frontline staff and working<br />
with partner organisations to build New Zealand’s resilience. Nationally around 25 Police officers<br />
are trained as digital first responders (DFRs), with forensic skills and expertise to recognise and<br />
preserve digital or electronic evidence.<br />
The Centre provided support to initiatives of partner agencies, not least the Department of<br />
the Prime Minister and Cabinet’s (DPMC) refresh of the National Cyber Security Strategy<br />
and development of a National Cyber Crime Plan. The Centre has also provided input into<br />
DPMC’s project to improve the coherence of New Zealand’s institutional framework<br />
addressing cyber security.<br />
G20<br />
November 2014 saw Police’s largest overseas deployment to date with 212 Police employees<br />
deployed to help police the G20 summit in Brisbane. 100 were deployed on route security and<br />
75 on venue security. Venues included hotels used by world leaders, including Russian<br />
President Vladimir Putin. Other members had motorcade duties, or supported intelligence or<br />
media liaison roles.<br />
The summit also resulted in increased demand for Police’s services in New Zealand with a number<br />
of world leaders, including German Chancellor Angela Merkel, Canadian Prime Minister Stephen<br />
Harper and Chinese President Xi Jinping, making official visits.<br />
3 Phishing is the attempt to acquire sensitive information such as usernames, passwords, and credit card details (and<br />
sometimes, indirectly, money), often for malicious reasons, by masquerading as a trustworthy entity in an electronic<br />
communication.<br />
10
Operation Concord<br />
In March 2015 Police announced a significant investigation – Operation Concord – into blackmail<br />
threats received by Fonterra and Federated Farmers. Anonymous letters threatened to contaminate<br />
infant and other formula with 1080 poison unless New Zealand stopped using 1080 for pest<br />
control by the end of March 2015.<br />
Police worked closely with the Ministry for Primary Industries and other government agencies<br />
to investigate this matter thoroughly. The economic implications of the threat had the potential<br />
to undermine national security given the importance of the dairy industry to the New Zealand<br />
economy.<br />
In the build up to the announcement Police worked with partners to increase the security of the<br />
supply chain, increased information to consumers, and worked closely with supermarkets to<br />
reduce the level of risk associated with the threat.<br />
Natural Disasters<br />
New Zealand has adopted an ‘all hazards’ approach to national security, which includes the<br />
response to natural disasters. Whilst there were no incidents that triggered a national response<br />
during 2014/15, there were two storms that caused significant damage and disruption at a<br />
regional level.<br />
––<br />
In July 2014 Northland was devastated by a storm, which saw trees and power lines felled,<br />
homes damaged, evacuations, floods, slips, potholes and widespread road closures. The<br />
District Command Centre (DCC) went into 24-hour operation as the storm approached to<br />
ensure staff could respond without compromising their normal duties. DCC staff held twicedaily<br />
phone conferences with local councils, Civil Defence, emergency service partners, power<br />
companies and Northland Health.<br />
––<br />
In June 2015 floods swept Central District. States of emergency were declared as a month’s<br />
rain fell in two days in Whanganui-Rangitikei, Manawatu and Taranaki, cutting off the city<br />
of Whanganui and other communities and swamping homes and businesses. With local<br />
councils leading, Police Liaison Officers were assigned to emergency operations centres and<br />
the DCC switched to 24-hour mode. There was extensive liaison with agencies including<br />
Ministry of Social Development, Fire and Defence, whose troops helped with cordons. Police<br />
employees were reassigned to help with evacuations and cordons, supported by 22 staff<br />
from other districts<br />
How we did<br />
Measure 2010/11 2011/12 2012/13 2013/14 2014/15<br />
Percentage of respondents concerned<br />
about unauthorised access to or misuse<br />
of personal information (very and/or<br />
extremely concerned)<br />
Percentage of people who are very or<br />
extremely concerned about national<br />
security in relation to war or terror<br />
64% 66% 56% 62% Unavailable [2]<br />
32% 36% 30% 34% Unavailable [2]<br />
Notes<br />
[2] Unisys (the result source) has discontinued surveying people on this measure as they concluded there was little yearon-year<br />
variance in the data. This measure has been removed from the Police performance indicators for the 2015/16<br />
financial year.<br />
ANNUAL REPORT 2014 2015 11
People are protected from incidents that could endanger<br />
their safety<br />
Police has a duty to protect people from harm, which only increases when the people whose<br />
safety is endangered are the most vulnerable in our society. We carry out a number of functions<br />
to protect vulnerable people from harm, including vetting people in positions of responsibility (such<br />
as teachers and caregivers), and managing the licensing of firearms to ensure they are not used<br />
to endanger people’s safety.<br />
As the first responder to most family violence incidents we carry out a risk assessment to<br />
determine the best course of action and ensure that everyone in the household will be safe after<br />
we have left. At times that means we issue a Police Safety Order to provide a cooling down period,<br />
or make an arrest where an offence has been committed. Where children are present we will notify<br />
Child, Youth and Family, so that they can make an informed decision about how best to provide for<br />
the children’s welfare.<br />
What we did<br />
Family Violence<br />
In July 2014, the Prime Minister announced a suite of cross-Government initiatives aimed at addressing<br />
family violence. The implementation of those initiatives, and others relating to sexual violence, is<br />
overseen by a Ministerial Group – co-chaired by the Ministers of Justice and Social Development.<br />
Police has a central role to play in this effort including:<br />
––<br />
A leadership role through Police’s contribution on the senior officials’ sponsors and governance<br />
groups for the cross-government work programme, and through the Commissioner of Police<br />
chairing the Justice Sector Sub-Committee on Family Violence.<br />
––<br />
An internal change programme to assess and improve Police’s response, investigation and<br />
resolution of family violence to deliver better services and support for family violence victims and<br />
their families.<br />
––<br />
Developing operational improvements regarding the disclosure of personal information to third<br />
parties where there is serious risk to a person’s safety from family violence. These improvements<br />
will include updated operational policy, systems and training.<br />
––<br />
Advancing a technology trial to look at capturing video evidence on mobility devices at the<br />
scene of family violence incidents, with the aim of providing better services for victims, increased<br />
efficiencies, and improved quality of information.<br />
––<br />
Leading the development of an improved multi-agency response to reports of family violence<br />
to Police, in partnership with government and non-government agencies.<br />
––<br />
Improved practice initiatives on the ground, including Waikato’s Family Safe Network. This<br />
involves a daily safety assessment meeting of all family violence reports to Police and review<br />
of actions agreed at the meeting.<br />
––<br />
Trialling updated safety alarms for high risk family violence victims.<br />
––<br />
Jointly with the Ministry of Justice, developing and testing an intensive case management<br />
approach for high risk family violence victims.<br />
Delivery of the Children’s Action Plan through participation in Children’s Teams and vetting of<br />
the children’s workforce<br />
Police upgraded its vetting application processes to take into account the increased range of<br />
employing entities required to have workforce checking as a result of Part 3 of the Vulnerable<br />
Children Act 2014, which came into effect on 1 July 2015, and the anticipated increased demand<br />
on its services.<br />
12
Police also held several seminars in every District with representatives from other government<br />
agencies and NGOs to raise awareness of the workforce safety obligations required under the<br />
Vulnerable Children Act.<br />
Cabinet approved the establishment of a child sex offender register and child sex offender risk<br />
management framework. In advance of the legislation taking effect, Police has developed a<br />
Centre for Impact on Sexual Offending, which trials data sharing between Police and the<br />
Department of Corrections.<br />
When children are present at a family violence incident attended by Police, we assess the risk to<br />
those children. Last year Police, in partnership with Child, Youth and Family, examined our use of<br />
the Child Risk Factor tool to assess and improve on its predictability of children at risk.<br />
Police Child Protection Teams have conducted enhanced prevention visits jointly with Child,<br />
Youth and Family since February 2015, in situations where a child abuse investigation has not<br />
identified a specific offence, but a number of risk indicators, such as previous family violence,<br />
gang involvement, alcohol and drug dependency, current Child, Youth and Family involvement<br />
with the child and/or siblings, were present.<br />
How we did<br />
Measure 2010/11 2011/12 2012/13 2013/14 2014/15<br />
Number of offences against children per<br />
10,000 population<br />
Number of offences against vulnerable<br />
adults per 10,000 population<br />
New measure for 2014/15<br />
New measure for 2014/15<br />
12<br />
14.3<br />
Percentage of breaches of Police Safety<br />
Orders<br />
New<br />
measure<br />
for<br />
2011/12<br />
6% 6% 8% 8%<br />
Percentage of respondents concerned<br />
about their overall personal safety over the<br />
next six months (very and/or extremely<br />
concerned)<br />
25% 24% 25% 24% Unavailable<br />
[3]<br />
Number of prosecutions that relate to<br />
offences involving firearms (excluding<br />
administrative offences under the<br />
Arms Act)<br />
New measure for<br />
2012/13<br />
3,022 2,668 2,922 [4]<br />
Measure [5] 2010 2011 2012 2013 2014<br />
Number of pedestrians killed or seriously 0.80 0.78 0.77 0.75 0.72<br />
injured per 10,000 population [6]<br />
Number of cyclists killed or seriously<br />
0.28 0.32 0.28 0.31 0.29<br />
injured per 10,000 population [6]<br />
[3] Unisys (the result source) has discontinued surveying people on this measure as they concluded there was little yearon-year<br />
variance in the data. This measure has been removed from the Police performance indicators for the 2015/16<br />
financial year.<br />
[4] The results reported in this <strong>Annual</strong> <strong>Report</strong> differ from previous years due to a change in the way the data is calculated.<br />
The results reported in this <strong>Annual</strong> <strong>Report</strong> count the number of offenders proceeded against.<br />
[5] Police has endeavoured to use financial year data wherever possible, but some measures are only collected on a<br />
calendar year basis. Where this is the case calendar year information is provided.<br />
[6] Seriously injured is defined as requiring hospitalisation for longer than one day.<br />
ANNUAL REPORT 2014 2015 13
Order is maintained<br />
People should be able to go about their business unaffected by the fear of crime. We seek to<br />
ensure that public spaces are safe and secure, people obey the law and do not create nuisances<br />
for others.<br />
What we did<br />
ANZAC Day – Centennial Commemorations<br />
Hundreds of thousands of New Zealanders attended events to mark the 100th anniversary of the<br />
ANZAC landings at Gallipoli. The solemnity of the huge crowds at ceremonies throughout the day<br />
demonstrated just how important these commemorations are to our sense of nationhood.<br />
Thousands of New Zealanders were at ANZAC Cove, and Police had staff on the Gallipoli<br />
Peninsular to assist in keeping everyone there safe.<br />
Many Police staff, both on and off duty, attended services in New Zealand, and at deployments<br />
overseas, showing great respect not just for those we remember on ANZAC Day but also the<br />
communities they came from and the loved ones they left behind.<br />
A further large contingent of Police employees took part in security operations related to ANZAC<br />
Day, ensuring the commemorations passed off peacefully and those attending were safe.<br />
ICC Cricket World Cup<br />
From the opening in Christchurch to the blistering semi-final in Auckland nearly six weeks later,<br />
Police presented a professional, friendly face to the cricketing world.<br />
This was enabled by two years of planning in conjunction with specialist Police groups, districts<br />
and external partners.<br />
Ensuring that everyone attending the tournament was able to enjoy the cricket in a safe<br />
environment required the input of a wide range of specialists from across Police. The National<br />
Intelligence Centre produced two reports a day before and during the tournament. The ICT<br />
group organised technical arrangements, such as CCTV feeds from grounds to the National<br />
and District Command Centres. Other groups involved included Diplomatic Protection Services,<br />
the National Prevention Centre, specialist search squads, the Armed Offender Squad, National<br />
Criminal Investigations Group, Māori, Pacific and Ethnic Services, Road Policing, Public Affairs,<br />
the Communications Centres, the Police Prosecutions Service and Legal Services.<br />
There was no sign of match-fixing, or repeated pitch invasions. Spectator behaviour was generally<br />
good, with highly engaged Police employees helping the carnival atmosphere.<br />
FIFA Under-20 World Cup<br />
Policing of the FIFA Under-20 World Cup in New Zealand was a triumph of meticulous planning,<br />
expert execution and cooperation with partner agencies.<br />
The operation involved 52 games, 24 teams, in seven Police Districts, and resulted in just three<br />
arrests and 38 evictions by Police and security staff.<br />
Each team had a Police Team Liaison Officer appointed by Districts. If the team changed districts<br />
another Liaison Officer took over, ensuring they always had the benefit of strong local knowledge<br />
wherever they were based.<br />
14
Bay Watch Festival<br />
Police was at the forefront of the response to a riot at the Bay Watch Festival over the New Year<br />
period, which resulted in 83 injuries and 67 arrests.<br />
In recent years disorder had increased at the festival and Police had prepared accordingly, through<br />
the development of Operation Redline. Police was particularly concerned about the approach to<br />
alcohol with the organisers adopting a BYO approach rather than a special liquor license.<br />
Police worked alongside event management and security, managing low-level problems with yellow<br />
(warning) and red (ejection) cards. In total 197 yellows and 125 reds were issued.<br />
Police teams were proactive during the afternoon of 31 December, supporting event security and<br />
arresting troublemakers and the intoxicated. From around 5pm incidents of disorder markedly<br />
increased – then at 6.05pm, the riot began. Fires were lit and explosions were heard, probably<br />
from burning aerosol cans.<br />
There were 45 Police employees on site, and another eight were called in as the disorder<br />
increased. They formed a line, supported by security staff, and began a three-hour sweep of the<br />
campgrounds, moving the campers into a communal area where buses were waiting to take them<br />
to Rhythm and Vines.<br />
Royal visit<br />
In May 2015 Prince Harry arrived in New Zealand for a Royal Tour. The Prince’s visit attracted<br />
even more interest than would normally be the case due to the birth of the Duchess and Duke of<br />
Cambridge’s daughter the weekend before.<br />
A large Police operation was carried out to ensure the safety of the Prince and the large crowds<br />
drawn to his various public engagements. The extensive planning that had gone into the visit<br />
ensured that it was a success with large numbers of New Zealanders having an opportunity to<br />
meet and see the Prince.<br />
How we did<br />
Measure 2010/11 2011/12 2012/13 2013/14 2014/15<br />
Repeat calls for service, noise control:<br />
• Number<br />
• Percentage<br />
New measure for 2014/15 916<br />
19%<br />
Measure 2010 2011 2012 2013 2014<br />
Rating in Political stability and absence<br />
of violence index (where 1 is the highest<br />
possible score)<br />
0.91 0.97 0.97 0.99 0.99<br />
ANNUAL REPORT 2014 2015 15
Communities are supported to resolve safety issues<br />
Professional policing is founded on the notion that the public are the police and the police are the<br />
public. We recognise that the people who know the most about safety problems in their area are<br />
the people who live there, and we seek to support them in developing sustainable solutions to<br />
those problems through a community policing approach.<br />
What we did<br />
Māori Responsiveness Managers<br />
In support of the Turning of the Tide strategy, a Māori Responsiveness Manager was appointed in<br />
each district to lead Police’s work with iwi. The roles play a key part in Police’s efforts to improve<br />
outcomes for Māori, which ultimately improve outcomes for the country as a whole, because Māori<br />
are significantly overrepresented in the criminal justice system.<br />
The Māori Responsiveness Managers hold a senior management role at district leadership level,<br />
but also have a reporting responsibility to the Deputy Chief Executive: Māori. They provide line<br />
management of Iwi Liaison Officers, and in some cases Ethnic and Pacific Liaison Officers, and<br />
are responsible for ensuring district activity aligns with national priorities.<br />
As well as the ability to influence internal practice, a key to the success of the role is an ability to<br />
build and sustain partnerships with Māori leaders, elders, service providers, Māori Wardens and<br />
members of Police’s Māori Advisory Boards.<br />
Smart Client<br />
Police implemented a mapping application, called Smart Client, which enables us to provide<br />
community partners with consistent, good quality information. The programme allows Police<br />
employees to produce a map plotting incidents of certain types of crime in a given area over a<br />
given time. This can be used by community-based organisations such as Community Patrols,<br />
Neighbourhood Support or Māori Wardens to compare on a week-by-week basis and identify<br />
trends as they emerge.<br />
The information provided by Smart Client is limited to certain categories of volume crime, for<br />
example burglary, thefts from shops and from or of vehicles, vehicle interference or damage<br />
to property. Individual properties are not identified and the exact locations of offences are not<br />
specified.<br />
Operation Ping An<br />
Operation Ping An – meaning ‘safety’ – reduced victimisation among Asian shopkeepers in<br />
Counties Manukau, boosted trust and confidence, increased mutual understanding and paved<br />
the way for further prevention work. The operation saw officers fluent in Mandarin, Cantonese<br />
and Korean engage with 257 businesses.<br />
Safety assessments were completed, prevention information and advice was distributed, and<br />
representatives of 42 businesses attended seminars at Ormiston and Otahuhu Police stations<br />
on topics such as Crime Prevention Through Environmental Design (CPTED).<br />
16
How we did<br />
Measure 2010/11 2011/12 2012/13 2013/14 2014/15<br />
Percentage of survey respondents who<br />
agree ‘Police is responsive to the needs of<br />
my community’<br />
Percentage of survey respondents who<br />
agree ‘Police are involved in activities in my<br />
community’<br />
78% 78% 80% 80% 78%<br />
68% 69% 69% 69% 69%<br />
ANNUAL REPORT 2014 2015 17
PRIORITY TWO:<br />
IMPROVED ROAD SAFETY<br />
Less harm from crashes<br />
Last year<br />
for every<br />
10,000<br />
population,<br />
there were…<br />
4 motorcycle-related<br />
Graduated Driver Licensing (GDL)<br />
systems offences<br />
4.4 fatal and serious<br />
injury crashes<br />
1,572<br />
youth-related GDL<br />
offences<br />
5.9 hospitalisations > 1 day<br />
54 alcohol and drug offences<br />
Road and driving behaviour<br />
8,851<br />
repeat calls for<br />
service, traffic<br />
emergency<br />
3%<br />
of vehicles stopped<br />
were in breach of<br />
Road User Charges<br />
93%<br />
rate of child<br />
restraint wearing<br />
416m<br />
kilometres travelled<br />
– level of road use<br />
Fatal and serious injury crashes<br />
reported to New Zealand Transport Agency<br />
2,196<br />
1,976 1,997<br />
1,891 1,991<br />
2010/11 2011/12 2012/13 2013/14 2014/15<br />
0.9<br />
road deaths per<br />
10,000 vehicles<br />
(‘risk on road’)<br />
63<br />
young drivers<br />
aged 15–24<br />
involved in fatal<br />
road crashes<br />
52%<br />
of vehicles<br />
travelling over<br />
urban speed limit<br />
22%<br />
of vehicles<br />
travelling over<br />
open road<br />
speed limit<br />
18
Priority two: Improved Road Safety<br />
Police contributes to the safe and efficient movement of people and goods across New Zealand’s<br />
transport networks. However, the level of road trauma remained unacceptably high. Speed,<br />
drink driving and distraction whilst driving remain key issues of concern, especially for young and<br />
inexperienced drivers.<br />
The number of deaths on New Zealand roads reached an all time low in 2013/14 and increased<br />
slightly in 2014/15, but remains at a historically low level.<br />
Number of fatal and serious injury road crashes recorded per 10,000 population<br />
5.2<br />
5<br />
4.8<br />
4.6<br />
4.4<br />
4.2<br />
4<br />
3.8<br />
2010 2011 2012 2013 2014<br />
We will track our progress in achieving the outcome of Improved Road Safety through monitoring<br />
changes in results under the impact area of:<br />
––<br />
less harm from crashes.<br />
Less Harm from crashes<br />
New Zealand lags behind comparable countries in terms of road safety, and the social harm from<br />
crashes affects families, the wider community and the health system. The harm from crashes also<br />
has an economic impact, which was estimated to be $3.3 billion in 2012.<br />
Police is committed to the direction set out in Safer Journeys, New Zealand’s Road Safety Strategy<br />
2010–2020, and to working in partnership across the road safety sector. Police has aligned its<br />
road policing activities with the strategy and will deliver Police-specific activities set out in the Safer<br />
Journeys Action Plan.<br />
ANNUAL REPORT 2014 2015 19
What we did<br />
Police used a combination of prevention, deterrence and enforcement, along with education and<br />
information, to protect communities and reduce death and trauma on New Zealand roads. Police<br />
worked with neighbourhoods to deliver locally-led prevention programmes on road safety matters,<br />
road safety education. Police also worked with established partners to improve environmental<br />
design and the safety of the road network.<br />
Lower Drink Drive Limit<br />
On 1 December 2014 the limit for drivers over 20 was lowered from 400mcg of alcohol per litre of<br />
breath to 250mcg, and from 80mg of alcohol per 100ml of blood (0.08), to 50mg (0.05). For drivers<br />
under 20, the limit remained zero.<br />
As a result of the changes adult drivers blowing 251–400mcg of alcohol per litre of breath receive<br />
an infringement notice ($200) and 50 demerit points. Those over 400mcg face criminal charges.<br />
Police supported an NZTA advertising campaign, which included bus shelter posters in main<br />
centres, radio ads and information on TV, and by giving drivers leaflets.<br />
Booze Bus Biometrics<br />
Police is now able to electronically scan fingerprints and take digital photographs of suspected<br />
drink-drivers at the roadside with a system known as Booze Bus Biometrics (BBB). This<br />
reduces time travelling to and from a Police station allowing Police to spend more time on<br />
productive duties.<br />
BBB will let Police officers confirm within minutes the identities of people they intend to charge,<br />
comparing biometric data to existing Police records and storing new information for future<br />
reference. It uses existing legislation – all Police constabulary employees are empowered to<br />
obtain alleged offenders’ fingerprints and photographs under section 33 of the Policing Act 2008.<br />
However, they cannot require drivers to go to a Police station for this unless there is good cause to<br />
suspect they have given false particulars.<br />
The system was installed in all 21 Police booze buses. During the month-long trial in Wellington<br />
District 20 drivers were processed, 18 for impaired driving and two for driving while disqualified.<br />
None tried to provide false particulars.<br />
Drivers wanted for other offences can also be identified and processed appropriately by the<br />
system.<br />
20
How we did<br />
Measure 2010 2011 2012 2013 2014<br />
Number of fatal and serious injury road<br />
5.0 4.5 4.5 4.2 4.4<br />
(new measure for 2014/15) [7]<br />
crashes recorded per 10,000 population<br />
Number of hospitalisations (for more than<br />
one day) resulting from road crashes per<br />
10,000 population<br />
6.6 6.1 6.2 6.3 5.9<br />
Number of fatal and serious injury crashes 2,196 1,976 1,997 1,891 1,991<br />
reported to New Zealand Transport Agency [7]<br />
Percentage of ‘risk on road’ (number of road<br />
deaths per 10,000 vehicles)<br />
Number of young drivers (15–24 years)<br />
involved in fatal crashes<br />
New measure for 2014/15<br />
New measure for 2014/15<br />
0.9<br />
63<br />
Percentage of road users travelling over<br />
urban road speed limit [8] New measure for 2014/15<br />
Percentage of road users travelling over<br />
open road speed limit [8] New measure for 2014/15<br />
52%<br />
22%<br />
Rate of child restraint wearing [9] New measure for 2014/15 93%<br />
Maintain levels of road use (reported as<br />
100 million kilometres travelled)<br />
New measure for 2014/15<br />
416<br />
Notes<br />
[7] Seriously injured is defined as requiring hospitalisation for longer than one day<br />
[8] Speed survey data is available at http://www.transport.govt.nz/research/roadsafetysurveys/speedsurveys/2013speeds<br />
urveyresultscarspeeds/<br />
[9] Child restraint data is available at http://www.transport.govt.nz/research/roadsafetysurveys/<br />
safetybeltstatisticsandchildrestraintsurveys/<br />
Measure 2010/11 2011/12 2012/13 2013/14 2014/15<br />
Percentage of all vehicles stopped in breach<br />
of Road User charge rules [by Commercial<br />
Vehicle Investigations Unit (CVIU) staff]<br />
Number of Motorcycle related Graduated<br />
Driver Licensing (GDL) systems offences<br />
detected per 10,000 population<br />
Number of Youth-related GDL Systems<br />
offences detected per 10,000 population<br />
Number of alcohol and drug driving offences<br />
detected per 10,000 population<br />
New measure for<br />
2012/13<br />
New measure for 2013/14<br />
New measure for 2013/14<br />
New measure for 2013/14<br />
3% 3% 3%<br />
4 4<br />
1,449 1,572<br />
52 54<br />
Number of repeat calls for service, traffic<br />
emergency<br />
New measure for 2014/15<br />
8,851<br />
ANNUAL REPORT 2014 2015 21
PRIORITY THREE:<br />
LESS CRIME<br />
Less harm from crime<br />
In 2014/15<br />
for every<br />
10,000<br />
population,<br />
there were…<br />
98<br />
violent crimes<br />
198<br />
youth crimes<br />
22.2<br />
serious assaults<br />
resulting in injury<br />
818<br />
total crimes<br />
The law is upheld through appropriate actions<br />
75%<br />
adult first<br />
time offenders<br />
70%<br />
youth first<br />
time offenders<br />
18%<br />
youth offenders<br />
managed by<br />
Police through<br />
non-court action<br />
who reoffended<br />
23%<br />
proportion of locations<br />
experiencing two or<br />
more occurrences of<br />
crime within last<br />
12 months<br />
644<br />
alcohol related<br />
offences<br />
7,006<br />
traffic offences<br />
identified per<br />
10,000 vehicle<br />
stops (including<br />
breath testing)<br />
28,329<br />
31,203<br />
29,503<br />
25,822<br />
79% 80% 80% 82% 81%<br />
8<br />
8<br />
10<br />
14,750<br />
0<br />
1<br />
2<br />
2010/11<br />
2011/12 2012/13 2013/14 2014/15<br />
Bail breaches detected<br />
30%<br />
Repeat offending<br />
following nonprosecutorial<br />
resolution<br />
2010/11<br />
2011/12 2012/13 2013/14 2014/15<br />
Percentage of prosecuted people<br />
who are convicted<br />
7%<br />
Court hearings<br />
delayed because<br />
summonsed parties<br />
do not appear<br />
2012/13 2013/14 2014/15<br />
Escapes and deaths whilst held<br />
in Police custody<br />
17,322<br />
offenders who received a<br />
non-prosecutorial resolution<br />
(volume offences)<br />
22
Priority three: Less Crime<br />
A primary role of government is to provide for the security of its citizens. Modern policing was<br />
founded on the principle of preventing crime and disorder in contrast to what had gone before,<br />
which could at best be described as law enforcement. We have embraced this aspect of our<br />
tradition through the Prevention First operating strategy. The strategy is aimed at having the right<br />
person in the right place at the right time focusing on the issues of youth, alcohol and drugs,<br />
organised crime and gangs, dysfunctional families and high-risk driving behaviours.<br />
New Zealand crime rate per 10,000 population<br />
1,000<br />
950<br />
900<br />
850<br />
800<br />
750<br />
700<br />
650<br />
600<br />
2010/11 2011/12 2012/13 2013/14 2014/15<br />
We will track our progress in achieving the outcome of Less Crime through monitoring changes<br />
in results under the impact areas of:<br />
––<br />
less harm from crime<br />
––<br />
the law is upheld through appropriate actions.<br />
Less harm from crime<br />
Crime has a corrosive effect on our society as well as causing profound harm and distress to<br />
victims and to the families of victims and offenders. As a result, crime and anti-social behaviour<br />
continues to present significant social and economic costs to society, including the associated<br />
costs of maintaining the justice system. Also when there is a perception that a particular location<br />
is unsafe people can alter the way they live their lives, undermining neighbourhoods and leading to<br />
businesses suffering financially. This is why Police has put prevention at the forefront of everything<br />
we do – and we are seeing the results from doing so. However, whilst the overall crime rate has<br />
been reducing, the seriousness and frequency of recorded crime is still of concern.<br />
ANNUAL REPORT 2014 2015 23
What we did<br />
Youth Crime<br />
Children and young people 4 comprise approximately 10% of the population, yet offending by<br />
children and young people accounts for approximately 20% of Police apprehensions. Māori are<br />
significantly over-represented, particularly amongst those receiving more serious sanctions.<br />
The Youth Crime Action Plan (YCAP) was launched in October 2013 to reduce crime by children<br />
and young people and help those who offend turn their lives around. Police plays a central role<br />
in ensuring the success of the YCAP. Together with the Prevention First: Youth Policing Plan that<br />
was launched in June 2012 the YCAP has contributed to significant reductions in youth crime.<br />
During 2014/15 Police implemented a short risk screening tool, so that decisions on how to<br />
respond to offending by every child and young person apprehended by Police are informed by<br />
their risk of reoffending. We also completed the nationwide roll-out of the Youth Resolution Model,<br />
implemented as part of the Prevention First: Youth Policing Plan, which has contributed to the<br />
Government’s Better Public Services target for youth crime being consistently exceeded.<br />
Police is a strong supporter of the Social Sector Trials, which bring together government agencies,<br />
NGOs and local communities to take a different approach to achieving better outcomes,<br />
particularly for youth, in a number of locations across New Zealand. The Trials have proven to be a<br />
successful model for collaborative working across agencies, bringing the innovation and dynamism<br />
of communities to bear in the delivery of public services.<br />
Whole-of-Government Action Plan to Reduce the Harms Caused by New Zealand Adult Gangs<br />
and Transnational Crime Groups<br />
Adult gangs and transnational crime groups create disproportionate harm in New Zealand. While<br />
overall crime is trending downwards, serious offending by adult gang members is increasing.<br />
Almost half of the serious offences committed by gang members are family violence related.<br />
A high proportion of gang members’ children experience multiple incidents of abuse or neglect<br />
Historical responses to adult gangs and transnational crime groups have produced successful<br />
operations, but these groups have continued to expand and adapt. As a result, in December 2014<br />
Cabinet directed Police to lead the implementation of the Whole-of-Government Action Plan to<br />
Reduce the Harms Caused by New Zealand Adult Gangs and Transnational Crime Groups.<br />
The Action Plan consists of four initiatives, which are:<br />
––<br />
the creation of a multi-agency Gang Intelligence Centre to provide a combined intelligence<br />
picture of gang activity, inform decision making on preventative, investigative and enforcement<br />
interventions, and identify vulnerable children, youth and gang family members for social<br />
service support<br />
––<br />
Start at Home: a programme of social initiatives to support gang members and their families to<br />
turn away from the gang lifestyle, and reduce the likelihood of young people joining gangs<br />
––<br />
establishment of two multi-agency Dedicated Enforcement Taskforces: one to strengthen border<br />
protection to target drug trafficking networks and restrict international gang travel, and one to<br />
strengthen asset recovery efforts and prevent and target financing of crime and profit received<br />
from crime<br />
4 Children and young people are defined in the Children, Young Persons, and Their Families Act 1989 as being under the<br />
age of 17 for the purposes of youth justice. Section 21 of the Crimes Act 1961 states that no child under the age of 10<br />
shall be convicted of any offence. Reading these two pieces of legislation together Police defines children and young<br />
people as being between the ages of 10 and 16 inclusive, for the purposes of youth justice.<br />
24
––<br />
work to ensure that the Legislative Toolkit enables law enforcement agencies to appropriately<br />
target cash acquired illegally, better detect, investigate and prosecute organised crime, monitor<br />
gang offenders on release from prison, and manage risk to keep communities safe.<br />
How we did<br />
Measure 2010/11 2011/12 2012/13 2013/14 2014/15<br />
New Zealand crime rate<br />
(per 10,000 population): [10]<br />
• Violent crime<br />
• Youth crime<br />
• Total crime<br />
109<br />
323<br />
990<br />
102<br />
296<br />
933<br />
100<br />
254<br />
863<br />
96<br />
210<br />
818<br />
98<br />
198<br />
818<br />
Number of serious assaults resulting in injury<br />
per 10,000 of the population<br />
25.4 23.4 21.7 20.5 22.2<br />
Number of offenders re-offending within<br />
12 months<br />
Victimisations where serious violence<br />
occurs:<br />
• Number<br />
• Percentage<br />
Rate of first time offenders: [11]<br />
New measure for 2014/15<br />
New measure for 2014/15<br />
30,524<br />
13,047<br />
5%<br />
• Adult<br />
• Youth<br />
New measure for 2014/15 75%<br />
70%<br />
Youth offenders managed by Police through<br />
non-court action who reoffend: [12]<br />
• Number<br />
• Percentage<br />
New measure for 2014/15<br />
2,666<br />
18%<br />
Number of alcohol-related offences [13] New measure for 2014/15 644<br />
Percentage of controlled purchase<br />
operations breaches detected that resulted<br />
in application for suspension of liquor license<br />
(within one month of detection)<br />
New measure for<br />
2012/13<br />
62% 54% Unavailable<br />
[14]<br />
Number of traffic offences identified per<br />
10,000 vehicle stops (including breath<br />
testing) [15]<br />
not<br />
available<br />
5,605 4,871 5,956 7,006<br />
Proportion of locations experiencing two<br />
or more occurrences of crime within<br />
12 months<br />
24% 24% 23% 23% 23%<br />
Notes<br />
[10] Better Public Services (BPS) Result 7. Source: Ministry of Justice www.justice.govt.nz/justice-sector/better-publicservices-reducing-crime/progress-updates.<br />
[11] A first time offender is defined as an individual who has offended once in the last 12 months.<br />
[12] Youth offenders who reoffend within 12 months.<br />
[13] These are offences specific to alcohol-related legislation, not offending that may have occurred following the<br />
consumption of alcohol.<br />
[14] Changes implemented by the Alcohol Regulatory and Licensing Authority (ARLA) to its database mean that this<br />
information is no longer readily available.<br />
[15] New measure for 2014/15.<br />
ANNUAL REPORT 2014 2015 25
The law is upheld through appropriate actions<br />
When a crime does occur it is vital that in a democratic society there is access to a fair justice<br />
system. Police’s operational independence is enshrined in legislation, so that its response is based<br />
solely on the circumstances at hand.<br />
Through Prevention First Police has placed a strong emphasis on meeting needs of victims, central<br />
to which is bringing offenders to justice. The resolution rate for serious crime remains very high,<br />
and Police is continuing to focus on improving the resolution rate for volume crime. As a result<br />
of the Alternative Resolutions workstream of Policing Excellence, Police resolves an increasing<br />
proportion of less serious crime through the use of warnings and restorative justice approaches.<br />
What we did<br />
Virtual Reality (VR) Photography<br />
Police deployed a new investigative tool, developed by the Auckland Forensic Imaging Unit, which<br />
provides 360 degree VR Photography of crime scenes. The tool uses specialised equipment and<br />
software to piece together a series of images to provide an interactive image encompassing a 360<br />
degree view of a location or scene. The finished movie allows investigative staff to visually lead<br />
others through an entire scene, from the exterior through to the interior.<br />
The process is relatively quick, meaning a VR walk-through can be available to investigators within<br />
hours. While it does not replace scene photography, VR provides a useful tool when used in<br />
conjunction with still imagery, for example in briefings, as a visual walk-through for jury members<br />
and judges and in witness, suspect and victim interviews.<br />
LiveScan<br />
During 2014/15 Police started rolling out exciting new biometric technology. LiveScan is an<br />
extension of Police’s existing finger and palm print system. The new functionality is able to capture<br />
fingerprints and palm prints, prisoner photos, and later scars, marks and tattoos at extremely high<br />
resolution increasing the chances of a match.<br />
It will also result in time savings for frontline staff with both improved functionality and rationalisation<br />
of the photography process. At the moment, staff have to take photographs separately to the<br />
gathering of finger and palm prints. The photographs are then uploaded on to Police systems<br />
from the camera and then added to the database. The new LiveScan technology will mean that<br />
photographs are captured at the same time as finger and palm prints and automatically added to<br />
Police databases.<br />
Operation Stamp<br />
August 2014 saw the culmination of a four-year investigation of a methamphetamine distribution<br />
network. The investigation found evidence of inter-gang co-operation and the increased presence<br />
of the Rebels gang in New Zealand. The final phase of the investigation saw assets worth<br />
$802,211 forfeited.<br />
In the termination of Operation Stamp numerous search warrants coordinated by Central District<br />
were executed across five districts.<br />
Of 31 people arrested, 13 were identified as key figures in the group. Most of the 13 were<br />
imprisoned for methamphetamine-related offending, with total sentences for the main offenders of<br />
around 65 years.<br />
26
For four years the asset recovery investigation examined every possible detail to identify, restrain<br />
and seek forfeiture of as many assets as possible belonging to, or under the control of, offenders<br />
and family members.<br />
Once the appeal process was exhausted, asset investigators around the country could examine<br />
the relevant targets under the Criminal Proceeds Recovery Act and obtain vital information.<br />
Matters have now been resolved against the last of the targets, either by settlement or courtimposed<br />
forfeitures, resulting in the forfeiture of:<br />
––<br />
32 motor vehicles, including 12 motorcycles<br />
––<br />
$398,368 cash<br />
––<br />
$4,900 bonus bonds<br />
How we did<br />
Measure 2010/11 2011/12 2012/13 2013/14 2014/15<br />
Number of bail breaches detected 28,329 31,203 23,503 14,750 [16] 25,822<br />
Percentage of all victimisations investigated New measure for 2014/15 32%<br />
Number of offenders who received a nonprosecutorial<br />
resolution (volume offences)<br />
New measure for 2014/15<br />
17,322<br />
Percentage of repeat offending following<br />
non-prosecutorial resolution [17] New measure for 2014/15<br />
30%<br />
Percentage of court hearings that are<br />
delayed because summonsed parties do<br />
not appear<br />
New measure for 2014/15<br />
7%<br />
Number of prisoner escapes whilst held in<br />
Police custody<br />
New measure<br />
for 2012/13<br />
8 8 10<br />
Number of prisoner deaths whilst held in<br />
Police custody<br />
Nil Nil Nil 1 2<br />
Percentage of prosecuted people who are 79% 80% 80% 82% 81%<br />
convicted [18]<br />
Notes<br />
[16] <strong>Report</strong>ed bail checks were lower than expected in 2013/14 due to a change in recording systems. The reported<br />
volume is based on information recorded through mobility devices. Any radio reported bail checks were omitted from<br />
this figure to avoid duplication.<br />
[17] Reoffending within a 12 month period.<br />
[18] Calendar year data. Source: Ministry of Justice.<br />
ANNUAL REPORT 2014 2015 27
PRIORITY FOUR:<br />
MORE VALUED SERVICES<br />
Trust and confidence in Police is maintained<br />
77% 77% 79% 78% 78%<br />
98% 100%<br />
283<br />
70%<br />
190<br />
127<br />
98<br />
144<br />
2010/11 2011/12 2012/13 2013/14 2014/15<br />
2012/13 2013/14 2014/15<br />
2010/11 2011/12 2012/13 2013/14 2014/15<br />
Percentage of people who expressed<br />
full or quite a lot of trust and<br />
confidence in Police<br />
Conduct investigations that met<br />
Independent Police Conduct<br />
Authority (IPCA) standards, as<br />
independently audited by IPCA<br />
Number of complaints upheld<br />
against Police<br />
The public is satisfied with Police service<br />
89% 90% 91% 89% 89%<br />
82% 82% 83% 84%<br />
82%<br />
83% 85% 87%<br />
84%<br />
2010/11 2011/12 2012/13<br />
2013/14 2014/15<br />
2011/12 2012/13<br />
2013/14 2014/15<br />
Contacts with Police where expectations of service<br />
delivery were met or exceeded, and overall service<br />
delivery satisfaction among members of the public who<br />
had contact with Police<br />
Satisfaction with the Communications Centre response<br />
to calls<br />
96%<br />
100% 100%<br />
79% 78% 77%<br />
77%<br />
67%<br />
2010/11 2011/12 2012/13<br />
2013/14 2014/15<br />
Victim Support offices’ satisfaction with Police services,<br />
in relation to initial response and criminal investigation<br />
2012/13 2013/14 2014/15<br />
District Court Judges’ satisfaction with the overall<br />
performance of Police prosecutors<br />
28
Priority four: More Valued Services<br />
Public trust and confidence in Police is vital in a functioning democracy underpinned by the rule<br />
of law. It is the basis of policing by consent. Without trust and confidence Police could not fulfil its<br />
functions – crime would not be reported, witnesses would not come forward, people would not<br />
pass on information, justice would be denied and enforcing the law would be more difficult. It is<br />
why the Commissioner of Police set a target of achieving 80% trust and confidence by 2017.<br />
Public trust and confidence is a barometer of our organisational health and capability. Over 70% of<br />
Police’s budget is spent on our people – if they are motivated, engaged and delivering services in<br />
accordance with our values we will see increases in public satisfaction with our services and levels<br />
of trust and confidence.<br />
Percentage of people who expressed full or quite a lot of trust and confidence in Police<br />
84%<br />
82%<br />
80%<br />
78%<br />
76%<br />
74%<br />
72%<br />
70%<br />
2010/11 2011/12 2012/13 2013/14 2014/15<br />
We will track our progress in achieving the outcome of More Valued Services through monitoring<br />
changes in results under the impact areas of:<br />
––<br />
trust and confidence in Police is maintained<br />
––<br />
the public is satisfied with Police service.<br />
ANNUAL REPORT 2014 2015 29
Trust and confidence in Police is maintained<br />
Delivering our services in accordance with our values will be critical in making progress towards<br />
our target of 80% trust and confidence by 2017. In particular we will focus on improving the levels<br />
of trust and confidence amongst Māori and young people.<br />
We are privileged to enjoy high levels of trust and confidence compared to other similar<br />
jurisdictions, which we do not take for granted. In 2014/15 we commissioned research into the<br />
drivers of trust and confidence in Police, so that we can further improve our approach.<br />
In conjunction with other government agencies we will continue to work closely with communities,<br />
prioritising the issues that are important to them. We will ensure that feedback mechanisms exist<br />
so that if someone is not happy with Police services they can raise their concerns and have them<br />
investigated.<br />
A key element in promoting trust and confidence is that Police reflects the communities we<br />
serve. In recent years we have made significant efforts to attract, appoint and promote people<br />
from groups traditionally under-represented in Police and we are starting to see progress. More<br />
information about the profile of Police can be found in Appendix 5: Profile of our people.<br />
What we did<br />
Review of Police’s Values<br />
Police’s vision is to have the trust and confidence of all. To enable us to make progress towards it,<br />
we are guided by our core values.<br />
These values inform the way we work, operate and make decisions. Our values reflect what is<br />
important to us and the communities we serve.<br />
In 2014/15 we added the values Empathy and Valuing Diversity to the existing four. These new<br />
values will be central to increasing levels of trust and confidence. It is obvious that delivering high<br />
quality services to victims of crime and witnesses to distressing situations requires a high degree of<br />
empathy, and the increasing diversity in New Zealand means that we need to deliver our services in<br />
a manner appropriate to each individual.<br />
The values we aspire to are Professionalism, Respect, Integrity, Commitment to Māori and the<br />
Treaty, Empathy and Valuing Diversity.<br />
Use of Social Media<br />
89% of New Zealanders are now online and more than half of our population has a Facebook<br />
account. No surprise then that interest in Police’s social media pages has also increased<br />
significantly.<br />
We now manage more than 40 Facebook pages; seven Twitter feeds; and YouTube, Linked In and<br />
Instagram accounts. In 2014, we saw a fourfold increase in incoming messages and interactions,<br />
jumping to a nearly 2.1 million a year.<br />
This is a credit to staff nationwide who engage the public by sharing prevention advice, crime<br />
and traffic updates, posts seeking public help and otherwise communicate with locals daily. Our<br />
content reaches around 1.5 million people per week and is an important tool in helping maintain<br />
public trust and confidence.<br />
Our posts can often go viral – think of the Dunedin Police puppy-naming competition that attracted<br />
25,000 entries; the 22 million views of the NZTA ‘Mistakes’ advert on Otorohanga Police’s<br />
Facebook page; the national headlines arising from a picture of a hedgehog with its head stuck<br />
in a chip container.<br />
30
More recently, a Christchurch appeal for information gained significant media interest after<br />
the offender commented on his own mugshot. Thanks to fast thinking and a witty reply from<br />
Christchurch officers, images of the interaction were broadcast worldwide and the offender was<br />
caught within 48 hours.<br />
However, the open and viral nature of social media isn’t always a positive. We can quickly become<br />
the target for online trolls and negative commentary. We constantly need to be aware of what<br />
we say, how we say it and the response we may receive. Negative posts can be just as popular<br />
as the positive.<br />
Introduction of Monthly Data on Victims and Offenders<br />
Whereas previously the twice-yearly crime statistics provided information about the number of<br />
crimes committed and the number of people apprehended, the new monthly Recorded Crime<br />
Victims Statistics (RCVS) and Recorded Crime Offender Statistics (RCOS) focus on victims<br />
and offenders. The new statistics provide demographic information, including age, gender and<br />
ethnicity – and the relationship between victims and offenders. From 30 January 2015 these new<br />
statistics have been updated on the last working day of each month. These changes address<br />
recommendations of a 2009 Statistics NZ review, bringing Police into line with other jurisdictions,<br />
and increasing our transparency and accountability to New Zealanders.<br />
How we did<br />
Measure 2010/11 2011/12 2012/13 2013/14 2014/15<br />
Percentage of people who expressed full or<br />
quite a lot of trust and confidence in Police<br />
77% 77% 79% 78% 78%<br />
Number of complaints upheld against<br />
127 98 144 190 [20] 283<br />
Police [19]<br />
Percentage of conduct investigations that<br />
met Independent Police Conduct Authority<br />
(IPCA) standards, as independently audited<br />
by IPCA<br />
– – 70% 98% 100%<br />
Notes<br />
[19] The increase in complaints upheld was largely due to a large number of outstanding investigations being finalised in<br />
the 2013/14 and 2014/15 financial years. The percentage of upheld complaints rose from 6% to 8%.<br />
[20] An improvement in the method of calculating the annual result was made, as such, the 2013/14 result was adjusted<br />
from 83 to reflect the updated calculation.<br />
ANNUAL REPORT 2014 2015 31
The public is satisfied with Police service<br />
Satisfaction with policing services contributes to trust and confidence in Police. Police relies<br />
on public and stakeholder feedback to improve its processes and service delivery. We take<br />
recommendations from external accountability bodies, such as the Independent Police Conduct<br />
Authority, seriously and seek to implement them expeditiously.<br />
Public satisfaction with our services is also a key indicator of our organisational health. Motivated<br />
staff delivering services in accordance with our values, supported by modern technology<br />
and effective back office systems will meet the expectations of the overwhelming majority of<br />
New Zealanders. In the latest staff engagement survey results we have sustained high levels of<br />
engagement in comparison with other public sector agencies, with an engagement index of 72.1,<br />
compared with around 69 in other public sector agencies.<br />
More detail about our organisational health and capability can be found in Appendix 4:<br />
Commission of Inquiry change management progress report and Appendix 5: Profile of our people.<br />
What we did<br />
Victim Focus<br />
The Victim Reform Package received Royal Assent on 6 June 2014, and came into force on<br />
6 December 2014. The package aims to:<br />
––<br />
strengthen the accountability of agencies and extend the general rights of victims by requiring<br />
agencies to report on complaints annually, improving the information provided to victims, and<br />
increasing access to restorative justice<br />
––<br />
improve provisions for victim impact statements by widening their purpose and scope, and<br />
giving victims of section 29 offences 5 the right to read their statement in court<br />
––<br />
enhance the Victim Notification System (VNS) 6 by widening the scope and improving the<br />
functioning of the system<br />
––<br />
increase the rights of victims of offending by children and young persons by carrying across<br />
victims’ rights in the adult courts to youth courts.<br />
The Act supports our aim under Prevention First to improve the quality of services we provide<br />
to victims. The changes mean that Police is required to give victims information about their<br />
case as soon as practicable. The responsibility for providing this information sits with the Police<br />
Prosecutions Service (PPS).<br />
Investment in Technology<br />
We are equipping our people with tools and technology that enable them to deal with issues onthe-spot<br />
rather than having to return to a Police station to complete the paperwork. This has direct<br />
benefits through Police staff spending more time out in their communities, where they can make<br />
the biggest difference in preventing crime. Over time it will also enable us to reduce our property<br />
footprint to meet the whole-of-government target of 16m 2 per employee.<br />
5 Specified offences in section 29 include all sexual offences and serious assaults; offences resulting in serious injury to<br />
a person, death, or a person being incapable; or an offence that has led to the victim having ongoing fears for their, or<br />
their immediate family’s, physical safety or security.<br />
6 The Victim Notification System refers to the notification system established by agencies to discharge duties in Part 3 of<br />
the Victims’ Rights Act. Each agency has set up its own database and processes for notifying victims.<br />
32
Enterprise Services<br />
Through the Enterprise Services programme Police is gaining access to a modern,<br />
portable, centrally supported computer platform that allows us to do our jobs without<br />
being tied to a particular location. Through a phased approach we are updating our<br />
8,700 desktops, laptops and tablets to run the latest software, linked to secure print<br />
services, which will deliver a smarter, faster environment and provide staff with an improved<br />
day-to-day experience.<br />
Mobility Innovation Lab and Experience Centre<br />
In December 2014 the Mobility Innovation Lab and Experience Centre opened. This centre<br />
fosters innovation and encourages rapid deployment of ideas and tools that support our<br />
operational strategy and have direct frontline benefits. Police staff work alongside our<br />
technology partners and other government agencies on how best to use mobility to meet<br />
the real-world challenges of modern policing. To date the Centre has looked at initiatives<br />
such as GPS, proximity devices and electronic formal statements and signatures.<br />
Human Resource Management Information System (HRMIS)<br />
Police relies heavily on its HRMIS to deliver human resource (HR) and payroll services.<br />
The system also provides data on staff skills, training and certifications (for example use<br />
of firearms), which is used by Police’s Communications Centres when deploying staff to<br />
particular incidents or tasks. Access to this information is vital for the safety of the public<br />
and Police employees.<br />
In 2014/15 we procured a new HRMIS, which will provide us with better quality information<br />
around the rostering, training and deployment of Police employees, thereby increasing our<br />
ability to ensure that New Zealanders can be safe and feel safe.<br />
How we did<br />
Impact Measure 2010/11 2011/12 2012/13 2013/14 2014/15<br />
Overall satisfaction with service delivery<br />
among members of the public who had<br />
contact with Police<br />
Percentage of contacts with Police where<br />
expectations of service delivery is met or<br />
exceeded<br />
82% 82% 83% 84% 82%<br />
89% 90% 91% 89% 89%<br />
Percentage of satisfaction with the<br />
communications centre response to calls<br />
Not<br />
measured<br />
83% 85% 87% 84%<br />
District Court judges’ satisfaction with the<br />
overall performance of Police prosecutors<br />
New measure for<br />
2012/13<br />
79% 78% 77%<br />
Victim Support offices satisfaction with<br />
Police services, in relation to initial response<br />
and criminal investigation<br />
96% 100% 100% 77% 67% [21]<br />
Notes<br />
[21] Improvements to the survey methodology in 2013/14, which were further improved upon in 2014/15, provide Police<br />
more accurate information and detail on how it could improve its performance in future.<br />
ANNUAL REPORT 2014 2015 33
2. STATEMENT OF RESPONSIBILITY<br />
As the Commissioner of Police, I am responsible for the preparation of the New Zealand Police<br />
financial statements, statements of expenses and capital expenditure, and for the judgements<br />
expressed in them.<br />
I have in place a system of internal control designed to provide reasonable assurance as to the<br />
integrity and reliability of financial reporting.<br />
I am responsible for the provision of accurate end-of-year performance information on each<br />
appropriation administered by New Zealand Police in accordance with sections 19A to 19C of the<br />
Public Finance Act 1989, and which is provided in this <strong>Annual</strong> <strong>Report</strong>.<br />
In my opinion, the financial statements fairly reflect the financial position and operations of the<br />
New Zealand Police for the year ended 30 June 2015, and the forecast financial statements fairly<br />
reflect the forecast financial position and operations of the New Zealand Police for the year ending<br />
30 June 2016.<br />
Signed by:<br />
Mike Bush MNZM 30 September 2015<br />
Commissioner of Police<br />
34
3. PERFORMANCE INFORMATION<br />
SUPPORTING THE APPROPRIATION<br />
The Auditor-General has noted the need for public entities to generally improve performance<br />
reporting. In this regard, Police continues to test and refine its performance measures used in<br />
key accountability documents.<br />
Output Expense One – Policy Advice and Ministerial Servicing<br />
Output expense description<br />
This output expense includes:<br />
––<br />
the purchase of policy outputs that involve the identification of problems and definitions,<br />
researching and monitoring of current practices<br />
––<br />
analysing options, writing, discussing and negotiating or issuing instructions about a<br />
policy issue<br />
––<br />
contribution to the formal government policy process<br />
––<br />
services to the Office of the Minister of Police such as responses to Ministerial correspondence,<br />
answers to written questions in the House, speech drafts and other Ministerial advice as well as<br />
advice or responses provided to other government agencies and departments.<br />
Sector or departmental outcome links<br />
This output expense covers the preparation, input and coordination of ministerial and policy advice<br />
on matters related to legislation and justice and transport sector outcomes.<br />
ANNUAL REPORT 2014 2015 35
Outputs purchased within this expense<br />
Output 1.1 – Policy Advice<br />
This output covers the provision of policy advice on policing, and advice on proposed legislation<br />
affecting the police and the criminal justice sector.<br />
Performance Measures<br />
Outturn<br />
2013/14<br />
Performance<br />
Standard<br />
2014/15<br />
Outturn<br />
2014/15<br />
Quantity<br />
1.1.1 Number of policy briefings for the Minister [1] 251 190 to 250 138<br />
1.1.2 Number of additional policy advice items for<br />
the Minister<br />
95 50 to 100 188<br />
1.1.3 Number of second opinion advice and<br />
contributions to policy advice led by other agencies<br />
1,170 1,100<br />
to 1,500<br />
978<br />
1.1.4 Total cost per hour of producing outputs $96 $90 to $120 $104<br />
Quality<br />
1.1.5 The satisfaction of the Minister of Police with<br />
the policy advice service, as per the common<br />
satisfaction survey<br />
90% 80% 62%<br />
1.1.6 Technical quality of policy advice papers assessed<br />
by a survey with a methodological robustness<br />
of 90%<br />
Timeliness<br />
68% Better than<br />
2013/14<br />
72%<br />
1.1.7 Policy advice is provided in a timely manner, in<br />
accordance with the work programme agreed with<br />
the Minister<br />
90% At least 95% 40%<br />
Notes<br />
[1] This is the quantity of formal numbered briefings provided.<br />
36
Output 1.2 – Ministerial Servicing<br />
This output covers the researching and drafting of Ministerial correspondence, and the provision<br />
of draft responses to written and oral Parliamentary questions.<br />
Performance Measures<br />
Outturn<br />
2013/14<br />
Performance<br />
Standard<br />
2014/15<br />
Outturn<br />
2014/15<br />
Quantity<br />
1.2.1 Number of briefings for the Minister [2] 380 250 to 350 259<br />
Quality<br />
1.2.2 Percentage of items of Ministerial correspondence<br />
returned due to errors<br />
1% Less than 5% 0%<br />
Timeliness<br />
1.2.3 Percentage of draft responses to Parliamentary<br />
questions that are provided within specified<br />
timeframes<br />
93% 100% 93%<br />
Notes<br />
[2] Results are demand driven. Legislative timetables, election cycles, and changes in Minister can affect this result.<br />
Contextual information<br />
Outturn<br />
2013/14<br />
Estimated<br />
outturn<br />
2014/15<br />
Outturn<br />
2014/15<br />
Percentage of items of Ministerial correspondence provided<br />
within the timeframes specified<br />
Number of items of Ministerial correspondence referred to<br />
Police for draft reply<br />
Number of Parliamentary questions referred to Police for<br />
draft response<br />
Number of Official Information Act requests answered for<br />
the Minister<br />
94% 90% 96%<br />
195 350 to 550 103 [3]<br />
510 350 to 550 332<br />
29 20 to 30 36<br />
Notes<br />
[3] Result is demand driven.<br />
ANNUAL REPORT 2014 2015 37
Output Expense Statement<br />
Policy Advice and Ministerial Servicing<br />
for the year ended 30 June 2015<br />
2013/14<br />
Actual<br />
$000<br />
2014/15<br />
Actual<br />
$000<br />
2014/15<br />
Main<br />
Estimates<br />
$000<br />
2014/15<br />
Supplementary<br />
Estimates<br />
Adjusted for 26A<br />
Changes<br />
$000<br />
Revenue<br />
Revenue Crown 3,318 3,989 3,122 3,989<br />
Revenue Department 6 2 1 1<br />
Revenue Other 14 21 12 12<br />
Total Revenue 3,338 4,012 3,135 4,002<br />
Expenses<br />
Policy Advice 2,692 3,302 2,411 3,278<br />
Ministerial Servicing 615 677 724 724<br />
Total Expenses 3,307 3,979 3,135 4,002<br />
Net Surplus (Deficit) 31 33 – –<br />
38
Output Expense Two – General Crime Prevention Services<br />
Output expense description<br />
This output expense includes the delivery of services within the community that help to prevent<br />
crime, including:<br />
––<br />
advice that reduces the risk of personal harm and increases the security of property<br />
––<br />
youth-focused crime prevention and community safety services<br />
––<br />
vetting services for other agencies<br />
––<br />
firearms licensing<br />
––<br />
dealing with lost and found property.<br />
Sector or departmental outcome links<br />
This output expense covers general proactive interventions. The activities and programmes<br />
promote safety in conjunction with general crime prevention. Structured programmes are delivered<br />
in schools alongside general youth services, and the information provided aims to increase<br />
intolerance to crime as well as enhancing awareness about crime. The output expense also<br />
includes initiatives in partnership with local government and community groups that are focused<br />
on reducing crime.<br />
Outputs purchased within this expense<br />
Output 2.1 – Community Responsiveness<br />
The output includes the establishment of programmes and the pursuit of strategies in partnership<br />
with government agencies, local authorities and other community groups to address crimerelated<br />
problems in the community. It also covers the provision of advice and information to<br />
raise public awareness about safety and security issues. It includes general communication with<br />
communities, media articles to promote safety and security issues, and specific advice to victims<br />
on practical actions that help to reduce the likelihood of revictimisation. It also covers the provision<br />
of administrative and logistical support to community groups including Victim Support and<br />
neighbourhood, rural and business support groups.<br />
ANNUAL REPORT 2014 2015 39
Performance Measures<br />
Outturn<br />
2013/14<br />
Performance<br />
Standard<br />
2014/15<br />
Outturn<br />
2014/15<br />
Quantity<br />
2.1.1 Number of foot patrols 125,710 100,000<br />
to 120,000<br />
139,987<br />
2.1.2 Number of victim intervention plans actioned and<br />
gold response [4] initiated<br />
New<br />
measure<br />
for 2014/15<br />
2,300<br />
to 2,500<br />
2,628<br />
2.1.3 Number of problem-solving plans implemented in<br />
high-risk communities to address safety and crime<br />
issues<br />
2.1.4 Number of incidents where the risk of further<br />
harm is assessed (in instances where a family<br />
relationship exists)<br />
New<br />
measure<br />
for 2014/15<br />
New<br />
measure<br />
for 2014/15<br />
33 33<br />
102,000<br />
to 112,000 [5] 106,248<br />
Notes<br />
[4] A Gold Response is the highest level of Police response to a victim, when there is the greatest risk of repeat<br />
victimisation. Key to a gold response is the development and implementation of a Victim Intervention Plan.<br />
[5] Performance standards for 2014/15 have been corrected to reflect the annual total. This differs from the information<br />
reported in the Information Supporting the Estimates which included expected six-month totals in error (51,000 to<br />
56,000).<br />
Output 2.2 – Youth Services<br />
This output covers formal school visits by Police Education Officers to educate children on<br />
proactive ways to keep themselves safe, prevent crime and resist drugs. It also includes the<br />
development of new school programmes to address emerging needs. It includes proactive Youth<br />
Development Programmes designed to prevent at-risk youth from becoming involved in crime<br />
or reoffending. The output also includes the provision of proactive Youth Aid services, although it<br />
does not include officers’ time spent dealing with criminal cases involving young people (which is<br />
covered in Output Expense Five).<br />
Performance Measures<br />
Outturn<br />
2013/14<br />
Performance<br />
Standard<br />
2014/15<br />
Outturn<br />
2014/15<br />
Quantity<br />
2.2.1 Number of young people (including children)<br />
managed through Police youth services<br />
New<br />
measure<br />
for 2014/15<br />
13,000<br />
to 14,000<br />
10,438<br />
2.2.2 Percentage of primary schools receiving crime<br />
prevention advice and support<br />
2.2.3 Percentage of secondary schools receiving crime<br />
prevention advice and support<br />
85% 70% to 90% 81%<br />
86% 70% to 90% 82%<br />
40
Output 2.3 – Vetting Services<br />
This output covers the vetting of applications for passports and for licences issued by other<br />
agencies (e.g. liquor, private investigator, security guard, and motor vehicle licences). It also<br />
includes the vetting of people who wish to provide home-stay student care and other services to<br />
vulnerable members of society to determine whether they are fit and proper persons to provide<br />
these services.<br />
Performance Measures<br />
Outturn<br />
2013/14<br />
Performance<br />
Standard<br />
2014/15<br />
Outturn<br />
2014/15<br />
Quantity<br />
2.3.1 Number of vetting requests processed 468,249 440,000<br />
to 480,000<br />
504,506<br />
Timeliness<br />
2.3.2 Percentage of vetting requests processed within<br />
agreed timeframes: Priority<br />
2.3.3 Percentage of vetting requests processed within<br />
agreed timeframes: General<br />
100% 100% 95%<br />
100% 90% 74%<br />
Output 2.4 – Firearms Licensing<br />
This output covers the processing of applications for firearms licences, the issuing of licences,<br />
the verification of compliance with endorsed licences, enforcement, and the revocation of firearms<br />
licences. It also covers the work to ensure people whose licences have expired have lawfully<br />
disposed of any firearms they have possessed.<br />
Performance Measures<br />
Outturn<br />
2013/14<br />
Performance<br />
Standard<br />
2014/15<br />
Outturn<br />
2014/15<br />
Quantity<br />
2.4.1 Number of applications for firearms licences<br />
processed<br />
21,684 15,000<br />
to 25,000<br />
34,310 [6]<br />
2.4.2 Number of firearms licences revoked [7] 565 400 to 600 556<br />
Timeliness<br />
2.4.3 Average number of days to follow-up with expired<br />
firearms licence holders to ensure appropriate<br />
disposal or removal of firearms<br />
166 days 60 days 75 days [8]<br />
Notes<br />
[6] The increase in applications for firearms licences processed is due to the continuation of the 10-year relicensing cycle.<br />
[7] This measure is a response by Police preventing a person who is no longer deemed fit-and-proper from holding a<br />
firearms licence.<br />
[8] This reports the mean number of days taken to follow-up with expired firearms licence holders. The improvement from<br />
2013/14 can largely be attributed to a focus on reducing outstanding, long-term expired licenses.<br />
ANNUAL REPORT 2014 2015 41
Output Expense Statement<br />
General Crime Prevention Services<br />
for the year ended 30 June 2015<br />
2013/14<br />
Actual<br />
$000<br />
2014/15<br />
Actual<br />
$000<br />
2014/15<br />
Main<br />
Estimates<br />
$000<br />
2014/15<br />
Supplementary<br />
Estimates<br />
Adjusted for<br />
26A Changes<br />
$000<br />
Revenue<br />
Revenue Crown 152,877 154,068 149,341 154,068<br />
Revenue Department 378 110 161 161<br />
Revenue Other 3,759 5,058 3,688 5,471<br />
Total Revenue 157,014 159,236 153,190 159,700<br />
Expenses<br />
Community Responsiveness 87,529 94,823 86,196 94,076<br />
Youth Services 50,654 48,692 50,347 47,493<br />
Vetting Services 4,595 3,240 4,614 3,186<br />
Firearms Licensing 8,609 10,283 8,325 11,676<br />
Lost and Found Property 3,625 3,309 3,708 3,269<br />
Total Expenses 155,012 160,347 153,190 159,700<br />
Net Surplus (Deficit) 2,002 (1,111) – –<br />
42
Output Expense Three – Specific Crime Prevention Services<br />
and Maintenance of Public Order<br />
Output expense description<br />
This output expense identifies the specific crime prevention activities undertaken by Police that<br />
target risk areas, including:<br />
––<br />
proactive patrolling<br />
––<br />
strategies that focus on reducing repeat victimisation for violence, burglary and vehicle offences<br />
––<br />
maintaining order at demonstrations and public events, providing security in court environs<br />
and support to aviation security, and providing other general security at international and<br />
domestic airports<br />
––<br />
the deployment of staff to Cabinet-approved overseas policing operations and providing<br />
secretariat support to the Pacific Island Chiefs of Police.<br />
Sector or departmental outcome links<br />
This output expense provides services aimed at reducing violence, burglary, vehicle offences,<br />
organised criminal offending and threats to national security through specific interventions. The<br />
interventions are proactive and are customised to the outcome. The activities and programmes<br />
are directed at ‘at-risk’ people or groups and are specific to particular contexts. Structured<br />
programmes include risk-targeted patrolling where patrols are directed to locations of repeat<br />
offending, recidivist offenders and repeat victims.<br />
Outputs purchased within this expense<br />
Output 3.1 – Directed Patrols<br />
This output covers the proactive strategies that seek to reduce specific crime issues targeted in<br />
the Government Crime Reduction Strategy and includes the delivery of foot and mobile patrol<br />
activities. Services provided under this output will be managed through Risk Targeted Patrol Plans,<br />
which include an information-gathering and intelligence-based risk assessment process focused<br />
on delivering a visible police presence to people and areas considered to be at greatest risk from<br />
criminal offending. Police patrols undertake such activities as interacting with the public, monitoring<br />
property, making routine hotel patrols, visiting places where people congregate, and speaking to<br />
people behaving suspiciously or other people of interest.<br />
ANNUAL REPORT 2014 2015 43
Performance Measures<br />
Outturn<br />
2013/14<br />
Performance<br />
Standard<br />
2014/15<br />
Outturn<br />
2014/15<br />
Quantity<br />
3.1.1 Number of bail checks 303,482 350,000<br />
to 400,000<br />
3.1.2 Number of vehicle stops 588,547 550,000<br />
to 600,000<br />
3.1.3 Number of licensed premises checks 55,299 40,000<br />
to 60,000<br />
326,297<br />
618,026<br />
58,891<br />
Quality<br />
3.1.4 Percentage of licensed premises checks at ‘risk’<br />
times and locations [9] 23% 20%<br />
to 25%<br />
22%<br />
3.1.5 Number of Controlled Purchase Operations (CPO) at<br />
off-licence premises and at-risk on-licence premises<br />
2,956 3,000<br />
to 5,000<br />
890 [10]<br />
Notes<br />
[9] Risk times have been defined as Saturday and Sunday 00:00hrs to 06:00hrs; risk locations are identified where crime<br />
occurs regularly (more than twice).<br />
[10] Several factors have contributed to the CPO numbers being reduced. The most significant being the absence<br />
of “Operation UNITE” during the 2014/15 year. This was where Police (in conjunction with our Australian Police<br />
counterparts) conducted two national operations (one at Christmas and one at Easter) with a focus on reducing<br />
alcohol-related harm. CPOs were a significant feature of “Operation UNITE”.<br />
Output 3.2 – Maintenance of Order<br />
The output covers operational duties focused on maintaining public order and preventing breaches<br />
of the peace at demonstrations. It includes the delivery of services such as crowd control, dealing<br />
with lost children, and public relations at events. It covers security services provided for VIPs,<br />
diplomat protection security, witness protection services, support to aviation security, and other<br />
general security at international and domestic airports.<br />
Performance Measures<br />
Outturn<br />
2013/14<br />
Performance<br />
Standard<br />
2014/15<br />
Outturn<br />
2014/15<br />
Quality<br />
3.2.1 Number of public events attended for crowd control 841 [11] New<br />
measure for<br />
2014/15<br />
3.2.2 Number of noise control incidents attended 2,432 [11] New<br />
measure for<br />
2014/15<br />
930<br />
2,192<br />
Notes:<br />
[11] New measure for 2014/15.<br />
44
Output 3.3 – Staff Deployment Overseas and Support to the Pacific Islands Chiefs of Police<br />
This output covers the requirements of training and deployment of staff overseas. It includes<br />
overseas liaison, joint Ministry of Foreign Affairs and Trade operations, and permanent secretariat<br />
support to the Pacific Islands Chiefs of Police.<br />
Performance Measures<br />
Outturn<br />
2013/14<br />
Performance<br />
Standard<br />
2014/15<br />
Outturn<br />
2014/15<br />
Quantity<br />
3.3.1 Number of police staff deployed offshore annually 68 90 to 100 480 [12]<br />
3.3.2 Number of overseas liaison posts maintained 8 9 10<br />
Quality<br />
3.3.3 Percentage of capacity building programmes<br />
delivered to standards<br />
100% 100% 100%<br />
Notes:<br />
[12] This increase is due to a number of short term deployments including: the contingent to the Solomon Islands; the G20<br />
contingent to Brisbane, Australia; and the contingent to the Small Island Developing States (SIDS) conference in Apia,<br />
Samoa. This number does not include the 10 Police Liaison Officers. The programmed deployments for the 2014/15<br />
year were 65 (comparable to the 68 deployed staff in 2013/14).<br />
Output Expense Statement<br />
Specific Crime Prevention<br />
Services and Maintenance of<br />
Public Order for the year ended<br />
30 June 2015<br />
2013/14<br />
Actual<br />
$000<br />
2014/15<br />
Actual<br />
$000<br />
2014/15<br />
Main<br />
Estimates<br />
$000<br />
2014/15<br />
Supplementary<br />
Estimates<br />
Adjusted for 26A<br />
Changes<br />
$000<br />
Revenue<br />
Revenue Crown 139,921 143,279 136,756 143,279<br />
Revenue Department 10,982 12,531 3,261 12,561<br />
Revenue Other 816 987 576 576<br />
Total Revenue 151,719 156,797 140,593 156,416<br />
Expenses<br />
Directed Patrols 112,394 117,539 108,134 111,334<br />
Maintenance of Order 17,036 17,152 15,976 16,280<br />
Staff Deployment Overseas and<br />
Support to the Pacific Islands<br />
Chiefs of Police<br />
17,532 21,412 16,483 28,802<br />
Total Expenses 146,962 156,103 140,593 156,416<br />
Net Surplus (Deficit) 4,757 694 – –<br />
ANNUAL REPORT 2014 2015 45
Output Expense Four – Police Primary Response<br />
Management<br />
Output expense description<br />
This output expense includes:<br />
––<br />
Communication Centres providing advice and information to callers<br />
––<br />
Communications Centres dispatching response vehicles to calls for assistance<br />
––<br />
Initial attendance at incidents and emergencies.<br />
Sector or departmental outcome links<br />
This output expense provides services aimed at reducing violence, burglary, vehicle offences,<br />
organised criminal offending and threats to national security through operational responses to<br />
emergencies, incidents and tasks. The interventions are reactive and customised to the outcome.<br />
The deployment of appropriate resources to deal with incidents, offences and tasks in a timely<br />
and complete way is vital for the success of many operational situations police face. Police rely<br />
on public trust and confidence, and providing responsive policing that is effective and efficient is<br />
fundamental to securing that support.<br />
Outputs purchased within this expense<br />
Output 4.1 – Communication Centres<br />
This output covers the three Police Communication Centres, which receive and deal with telephone<br />
calls from the public, through to the dispatch of patrols, specialist groups or other emergency<br />
services and the conclusion of enquiries where callers are seeking advice and information.<br />
Performance Measures<br />
Outturn<br />
2013/14<br />
Performance<br />
Standard<br />
2014/15<br />
Outturn<br />
2014/15<br />
Quantity<br />
4.1.1 Number of calls answered: 111 New<br />
measure<br />
for 2014/15<br />
4.1.2 Number of calls answered: General New<br />
measure<br />
for 2014/15<br />
4.1.3 Number of calls answered: Crime <strong>Report</strong>ing Line New<br />
measure<br />
for 2014/15<br />
Timeliness<br />
Percentage of calls answered (by the Communications Centres):<br />
770,000<br />
to 790,000<br />
550,000<br />
to 570,000<br />
440,000<br />
to 460,000<br />
791,662<br />
685,101<br />
363,315<br />
4.1.4 111 (within 10 seconds of being presented) 88% 90% 82%<br />
4.1.5 General (within 30 seconds of being presented) 81% 80% 71%<br />
4.1.6 Crime <strong>Report</strong>ing Line (within 30 seconds of being<br />
presented)<br />
New<br />
measure<br />
for 2014/15<br />
70% 61%<br />
46
Output 4.2 – Police Response to Incidents and Emergencies<br />
This output covers those events that require an immediate response where there is a real threat to<br />
life or property. It also covers the initial attendance of police to an incident that is not an emergency<br />
response and to events where attendance is sufficient to resolve issues.<br />
Performance Measures<br />
Outturn<br />
2013/14<br />
Performance<br />
Standard<br />
2014/15<br />
Outturn<br />
2014/15<br />
Quantity<br />
4.2.1 Number of (non-traffic) emergency events<br />
responded to<br />
183,612 [13] 150,000<br />
to 170,000<br />
147,535 [13]<br />
4.2.2 Number of (non-traffic ) non-emergency events<br />
responded to<br />
New<br />
measure<br />
for 2014/15<br />
2,100,000<br />
to<br />
2,500,000<br />
645,787 [14]<br />
4.2.3 Number of Search and Rescue events: Land 759 700 to 900 1,033<br />
4.2.4 Number of Search and Rescue events: Water 1,256 1,300<br />
to 1,500<br />
4.2.5 Number of Police Safety Orders issued 12,864 10,000<br />
to 12,000<br />
1,688<br />
13,721<br />
4.2.6 Number of hours spent on diplomatic protection New<br />
measure<br />
for 2014/15<br />
4.2.7 Number of Armed Offender Squad deployments New<br />
measure<br />
for 2014/15<br />
Timeliness<br />
New<br />
measure for<br />
2014/15<br />
800<br />
to 1,000<br />
102,024<br />
845<br />
4.2.8 Median response time to emergency events in<br />
urban policing areas<br />
7 minutes<br />
26 seconds<br />
8 to<br />
9 minutes<br />
7 minutes<br />
33 seconds<br />
4.2.9 Median response time to emergency events in rural<br />
policing areas [15]<br />
11 minutes<br />
56 seconds<br />
12 to<br />
14 minutes<br />
12 minutes<br />
36 seconds<br />
[13] The 2013/14 reported outturn included emergency traffic events; the outturn excluding emergency traffic events was<br />
143,703. The 2014/15 outturn excludes emergency traffic events; for comparison, the outturn including emergency<br />
traffic events is 192,392. Response to traffic events are accounted for by measures 7.3.1 and 7.3.2.<br />
[14] The variance between the performance standard and the outturn is primarily due to a change in recording practice by<br />
frontline staff, following the roll-out of the Police mobility devices. Previously, officers logged all events attended through<br />
the Police Communications Centres, including those events where the officer was already in attendance. These<br />
events were included as a measure of the Communications Centres’ workload. However, as frontline staff now create<br />
many events themselves via mobility devices (i.e. not via the Communications Centres), and as the officer is already in<br />
attendance, no ‘response’ is possible. This ‘disqualifies’ these officer generated events from this measure. Police has<br />
therefore reported what appears to be a significant ‘reduction’ in events responded to. A smaller but important factor<br />
in the reduction in apparent volumes can be attributed to the exclusion of traffic events from the result. Response to<br />
traffic events are accounted for by measures 7.3.1 and 7.3.2.<br />
For comparison, if the officer generated events were included, the result for the 2014/15 year would be approximately<br />
3 million (2013/14 2.66 million and 2012/13 2.25 million). The 2013/14 outturn (excluding emergency traffic events)<br />
was 649,521.<br />
[15] Rural areas include the Greater Auckland Motorway system.<br />
ANNUAL REPORT 2014 2015 47
Output Expense Statement<br />
Police Primary Response Management<br />
for the year ended 30 June 2015<br />
2013/14<br />
Actual<br />
$000<br />
2014/15<br />
Actual<br />
$000<br />
2014/15<br />
Main<br />
Estimates<br />
$000<br />
2014/15<br />
Supplementary<br />
Estimates<br />
Adjusted for<br />
26A Changes<br />
$000<br />
Revenue<br />
Revenue Crown 387,820 376,651 382,052 376,651<br />
Revenue Department 948 261 707 707<br />
Revenue Other 1,635 1,978 2,683 2,683<br />
Total Revenue 390,403 378,890 385,442 380,041<br />
Expenses<br />
Communications Centres 37,976 40,868 37,130 40,002<br />
Police Response to Incidents and<br />
Emergencies<br />
347,060 341,445 348,312 340,039<br />
Total Expenses 385,036 382,313 385,442 380,041<br />
Net Surplus (Deficit) 5,367 (3,423) – –<br />
48
Output Expense Five – Investigations<br />
Output expense description<br />
This output expense includes:<br />
––<br />
criminal investigations<br />
––<br />
non-criminal investigations.<br />
Sector or departmental outcome links<br />
This output expense provides services aimed at reducing violence, burglary, vehicle offences,<br />
organised criminal offending and threats to national security through investigations of crime,<br />
offences and certain other events. The interventions are reactive and customised to the outcome.<br />
The deployment of appropriate investigative resources to deal with criminal offending and certain<br />
incidents in a timely and competent way is vital for the success of many operational situations<br />
that Police face. Police rely on public trust and confidence, and providing a robust, effective and<br />
efficient investigative response is fundamental to securing that support.<br />
Outputs purchased within this expense<br />
Output 5.1 – Criminal Investigations<br />
This output covers a variety of investigative services that follow from Police initial attendance<br />
and early investigation of reported crimes. It also includes activity resulting from Police-initiated<br />
investigations. It further covers arrests resulting from these investigations through to the preparation<br />
of files for final case resolution whether by prosecution or by Police diversion. The output includes<br />
the execution of search warrants and the interviewing of suspects and offenders. It includes the<br />
collection, examination and analysis of forensic crime scene samples, such as fingerprints and<br />
DNA, to match crime scene samples with samples held on record.<br />
ANNUAL REPORT 2014 2015 49
Performance Measures<br />
Outturn<br />
2013/14<br />
Performance<br />
Standard<br />
2014/15<br />
Outturn<br />
2014/15<br />
Quantity<br />
5.1.1 Number of hours spent on active investigation New<br />
measure<br />
for 2014/15<br />
New<br />
measure for<br />
2014/15<br />
3,193,991<br />
Number of victimisations where investigation is finalised because Police determine ‘no crime has<br />
occurred’ or the ‘offender is proceeded against’: [16]<br />
5.1.2 Against the person crime New<br />
measure<br />
for 2014/15<br />
5.1.3 Property crime New<br />
measure<br />
for 2014/15<br />
New<br />
measure for<br />
2014/15<br />
New<br />
measure for<br />
2014/15<br />
18,948<br />
18,069<br />
5.1.4 Number of multi-agency taskforce operations<br />
commenced by the Organised and Financial Crime<br />
Agency New Zealand (OFCANZ)<br />
12 10 to 12 8<br />
Timeliness<br />
Proportion of victimisations where investigation is finalised within 30 days because Police<br />
determine ‘no crime has occurred’ or the ‘offender is proceeded against’:<br />
5.1.5 Against the person crime New<br />
measure<br />
for 2014/15<br />
5.1.6 Property crime New<br />
measure<br />
for 2014/15<br />
New<br />
measure for<br />
2014/15<br />
New<br />
measure for<br />
2014/15<br />
45%<br />
15%<br />
5.1.7 Percentage of people who have reported offences<br />
that are advised of results or updated on the<br />
investigation within 21 days of reporting that offence<br />
81% 90% 87%<br />
Note<br />
[16] This is the number of files finalised as at seven-days after the date the offence was reported to Police.<br />
50
Output 5.2 – Other Investigations<br />
This output covers case investigation of those matters that do not fall within a crime category or<br />
those matters dealt with by early case closure. Examples include enquiries into missing people,<br />
investigating sudden deaths and services provided to assist people who are mentally ill.<br />
Performance Measures<br />
Outturn<br />
2013/14<br />
Performance<br />
Standard<br />
2014/15<br />
Outturn<br />
2014/15<br />
Quality<br />
Number of other (non-criminal) investigations relating to:<br />
5.2.1 incidents where a family relationship exists New<br />
measure<br />
for 2014/15<br />
85,000<br />
to 100,000<br />
68,575<br />
5.2.2 reports of missing persons 16,602 17,000<br />
to 19,000<br />
5.2.3 persons with mental illness 13,102 14,000<br />
to 20,000<br />
5.2.4 reports of sudden deaths 4,959 6,000<br />
to 8,000<br />
17,976<br />
14,921<br />
6,024<br />
Output Expense Statement<br />
Investigations for the year ended<br />
30 June 2015<br />
2013/14<br />
Actual<br />
$000<br />
2014/15<br />
Actual<br />
$000<br />
2014/15<br />
Main<br />
Estimates<br />
$000<br />
2014/15<br />
Supplementary<br />
Estimates<br />
Adjusted for<br />
26A Changes<br />
$000<br />
Revenue<br />
Revenue Crown 369,722 377,065 365,423 377,065<br />
Revenue Department 899 261 546 546<br />
Revenue Other 1,557 1,977 2,090 2,090<br />
Total Revenue 372,178 379,303 368,059 379,701<br />
Expenses<br />
Criminal Investigations 341,654 357,404 342,281 355,205<br />
Other Investigations 25,555 24,341 25,778 24,496<br />
Total Expenses 367,209 381,745 368,059 379,701<br />
Net Surplus (Deficit) 4,969 (2,442) – –<br />
ANNUAL REPORT 2014 2015 51
Output Expense Six – Case Resolution and Support<br />
to Judicial Process<br />
Output expense description<br />
This output expense includes:<br />
––<br />
prosecuting criminal cases<br />
––<br />
resolving non-criminal cases<br />
––<br />
executing court orders, fines warrants and arrest warrants<br />
––<br />
escorting and holding people in Police cells following arrest<br />
––<br />
the custody and escort of arrested, remand and sentenced prisoners as directed by the court<br />
––<br />
the care, and when necessary, the temporary custody and escort of people with mental<br />
health problems.<br />
Sector or departmental outcome links<br />
This output expense supports the judicial process through prosecutions, the custody of arrested<br />
people and remand prisoners, and the execution of court documents.<br />
Outputs purchased within this expense<br />
Output 6.1 – Criminal Case Resolution<br />
This output covers the Police prosecutor’s time preparing, consulting and completing cases with<br />
the case manager, preparing cases for court and attending at District Court. It includes work within<br />
the Police Adult Diversion Scheme and attendance at Family Group Conferences to resolve youth<br />
offending. It also covers support to the Coroners Court to resolve Coronial Inquests.<br />
Performance Measures<br />
Outturn<br />
2013/14<br />
Performance<br />
Standard<br />
2014/15<br />
Outturn<br />
2014/15<br />
Quantity<br />
6.1.1 Number of cases prosecuted 104,974 105,000<br />
to 115,000<br />
6.1.2 Number of diversions successfully completed 5,182 3,000<br />
to 5,000<br />
99,127<br />
4,906<br />
Quality<br />
6.1.3 Percentage of cases resolved by prosecution that<br />
are withdrawn/dismissed at defended hearing<br />
(judge alone trial) due to Police providing insufficient<br />
evidence<br />
5% 6% 8% [17]<br />
Timeliness<br />
6.1.4 Percentage of judge alone trials that do not proceed<br />
on the date agreed between Police and the Courts,<br />
for reasons that are the responsibility of Police<br />
3% Less than<br />
3%<br />
3%<br />
[17] The three percentage point increase was caused by a change in recording practice to include withdrawals by Police on<br />
the day of the trial.<br />
52
Output 6.2 – Execution of Court Summonses, Warrants and Orders<br />
This output covers the delivery of services that have been authorised by the issue of a notice, an<br />
instruction, an order or a warrant from a legislated authority. It includes the execution of warrants<br />
to arrest and fines warrants and breaches of home detention conditions as required, the serving<br />
of summonses and other minor offence notices (not including those generated under the Transport<br />
Act 1962).<br />
Performance Measures<br />
Outturn<br />
2013/14<br />
Performance<br />
Standard<br />
2014/15<br />
Outturn<br />
2014/15<br />
Quantity<br />
6.2.1 Number of court documents executed<br />
58,878 60,000<br />
(i.e. delivered) [18] to 70,000<br />
74,034<br />
Notes<br />
[18] Results are demand driven.<br />
Output 6.3 – Custody and Escort Services<br />
This output covers the escort and holding of prisoners in Police cells following arrest, and<br />
includes the holding of remand or some sentenced prisoners in approved locations. It also covers<br />
the custody and escort of people requiring assessment under the Mental Health (Compulsory<br />
Assessment and Treatment) Act 1989.<br />
Performance Measures<br />
Outturn<br />
2013/14<br />
Performance<br />
Standard<br />
2014/15<br />
Outturn<br />
2014/15<br />
Quantity<br />
6.3.1 Number of prisoners escorted and/or held in custody New<br />
measure<br />
for 2014/15<br />
140,000<br />
to 170,000<br />
151,146<br />
ANNUAL REPORT 2014 2015 53
Output Expense Statement<br />
Case Resolution and Support to Judicial<br />
Process for the year ended<br />
30 June 2015 2013/14<br />
Actual<br />
$000<br />
2014/15<br />
Actual<br />
$000<br />
2014/15<br />
Main<br />
Estimates<br />
$000<br />
2014/15<br />
Supplementary<br />
Estimates<br />
Adjusted for<br />
26A Changes<br />
$000<br />
Revenue<br />
Revenue Crown 125,857 127,258 116,559 127,258<br />
Revenue Department 979 351 404 404<br />
Revenue Other 531 668 654 654<br />
Total Revenue 127,367 128,277 117,617 128,316<br />
Expenses<br />
Criminal Case Resolution 51,645 53,523 47,921 53,570<br />
Execution of Court Summonses, Warrants<br />
and Orders<br />
16,856 14,591 16,316 14,841<br />
Custody and Escort Services 56,912 59,702 53,380 59,905<br />
Total Expenses 125,413 127,816 117,617 128,316<br />
Net Surplus (Deficit) 1,954 461 – –<br />
54
Output Expense Seven – Road Safety Programme<br />
Output expense description<br />
This output expense covers:<br />
––<br />
the delivery of services outlined in the Road Policing Programme directed towards the<br />
achievement of road safety outcomes, and the delivery of key strategic services such as:<br />
highway patrol, speed and traffic camera operations, restraint device control, drink or<br />
drugged driver control operations, commercial vehicle investigation activity, and visible<br />
road safety enforcement<br />
––<br />
court prosecution and infringement management<br />
––<br />
road safety education activities and community services<br />
––<br />
services associated with traffic management such as peak flow, event traffic control and<br />
crash attendance.<br />
Sector or departmental outcome links<br />
Evaluation at the programme level establishes the clearest linkage between the interventions<br />
identified under this output and overall road safety outcomes. As a member of the transport sector,<br />
Police contributes towards the achievement of the Safer Journeys outcomes and Road Policing<br />
Strategy actions.<br />
Outputs purchased within this expense:<br />
7.1 Reduce the Impact of High Risk Behaviours:<br />
––<br />
reduce the impact of high risk drivers<br />
––<br />
increase safety of young drivers<br />
––<br />
increase safety of motorcycling<br />
––<br />
reduce impact of alcohol/drug impaired driving<br />
––<br />
reduce the impact of speed<br />
––<br />
increase the use of restraints<br />
––<br />
improve safety of heavy motor vehicle fleet<br />
––<br />
enforcement of road and roadside rules<br />
––<br />
improve safety of light vehicle fleet<br />
––<br />
improve safe walking and cycling<br />
––<br />
reduce impact of fatigue and distraction<br />
––<br />
improve safety of older road users<br />
7.2 Crash Attendance and <strong>Report</strong>ing<br />
7.3 Traffic Management<br />
ANNUAL REPORT 2014 2015 55
Performance Measures –<br />
Reduce the Impact of High Risk Behaviours<br />
Outturn<br />
2013/14<br />
Performance<br />
Standard<br />
2014/15<br />
Outturn<br />
2014/15<br />
Quantity<br />
7.1.1 Number of enforcement actions taken against high<br />
risk drivers per 10,000 population [19] [20] 774 680 to 720 836<br />
4.4 3.5 to 4.5 4<br />
7.1.2 Number of enforcement actions taken against<br />
of fitness) per 10,000 population [20]<br />
motorcyclists relating to bike not to standard (warrant<br />
7.1.3 Number of (officer issued) enforcement actions taken<br />
for speed per 10,000 population [20] 648 590 to 635 641<br />
140 120 to 135 120<br />
7.1.4 Number of enforcement actions taken for vehicle<br />
population [20]<br />
occupants for not wearing restraints per 10,000<br />
152 125 to 145 167<br />
7.1.5 Number of enforcement actions taken for intersection<br />
population [20]<br />
behaviour and lane compliance per 10,000<br />
7.1.6 Number of enforcement actions taken for mobilephone<br />
non-compliance per 10,000 population [20] 41 30 to 35 53 [21]<br />
7.1.7 Number of enforcement actions taken for breaches 2,743 [22] 2,000<br />
of work-time and log-book rules [20] to 3,000<br />
3,659<br />
18 20 to 30 16.5<br />
7.1.8 Number of (officer issued) enforcement actions taken<br />
per 10,000 population [20]<br />
for heavy motor vehicles exceeding the speed limit<br />
7.1.9 Number of enforcement actions taken for cycle<br />
helmet non-compliance per 10,000 population [20] 25 20 to 30 18<br />
319 270 to 295 323<br />
7.1.10 Number of enforcement actions taken for light vehicle<br />
fitness) per 10,000 population [20]<br />
fleet standard requirements (warrant/certificate of<br />
7.1.11 Number of secondary school road safety sessions<br />
delivered<br />
7.1.12 Number of primary school road safety sessions<br />
delivered<br />
9,554 7,000 8,640<br />
48,862 43,000 44,590<br />
7.1.13 Number of breath tests conducted [23] 3,029,072 2,700,000<br />
to<br />
2,900,000<br />
2,555,957<br />
Quality<br />
7.1.14 Percentage of all commercial vehicle combinations<br />
stopped by Commercial Vehicle Investigation Unit<br />
(CVIU) staff, and for which vehicle inspection reports<br />
are completed<br />
100% 100% 100%<br />
Timeliness<br />
7.1.15 Percentage of roadside inspection reports for all<br />
heavy motor vehicle roadside inspections (levels<br />
3, 5 and 6) that are entered into the New Zealand<br />
Transport Agency (NZTA) Road Inspection database<br />
within 20 working days<br />
81% 100% 99%<br />
56
[19] This measure reports the total high risk driver and dangerous and careless driving offences per 10,000 population.<br />
[20] “Enforcement actions” include traffic infringements (i.e. those offences with a prescribed fee – commonly known<br />
as a ticket) and traffic offence proceedings (i.e. those offences that may result in prosecution, referral to Youth Aid,<br />
warnings, and other resolutions).<br />
[21] The increase in enforcement actions taken for mobile-phone non-compliance can be attributed to a number of factors<br />
including a strategic focus on reducing harm caused by distractions while driving.<br />
[22] The query used to calculate this result omitted some offence codes in error. The previously reported (2013/14 financial<br />
year) outturn of 2,445 was therefore incorrect and the correct result of 2,743 has been provided.<br />
[23] Breath Alcohol Test counts are electronically recorded on the ‘Sniffer’ testing devices when a breath test is conducted.<br />
Test volumes are downloaded and reported to Police every six months by the manufacturer of the units.<br />
Performance Measures –<br />
Crash Attendance and <strong>Report</strong>ing<br />
Outturn<br />
2013/14<br />
Performance<br />
Standard<br />
2014/15<br />
Outturn<br />
2014/15<br />
Timeliness<br />
7.2.1 Percentage of all Traffic Crash <strong>Report</strong>s correctly<br />
completed and received by the NZTA within<br />
10 weeks of the crash or within seven days of<br />
completion of file (whichever happens first)<br />
93% 95% 93%<br />
Quantity<br />
Number of traffic events responded to:<br />
7.3.1 ‘emergency’ 30,228 20,000<br />
to 30,000<br />
7.3.2 ‘total’ 195,169 150,000<br />
to 190,000<br />
44,857 [24]<br />
249,372 [24]<br />
Timeliness<br />
7.3.4 Median response time to emergency traffic events<br />
in urban policing areas<br />
7 minutes<br />
37 seconds<br />
8 to<br />
9 minutes<br />
8 minutes<br />
34 seconds<br />
7.3.5 Median response time to emergency traffic events<br />
in rural policing areas [25]<br />
11 minutes<br />
27 seconds<br />
12 to<br />
14 minutes<br />
13 minutes<br />
20 seconds<br />
Notes<br />
[24] These measures are similar to measures 4.2.1 and 4.2.2, but relate to traffic events only.<br />
[25] Rural areas include the Greater Auckland Motorway system.<br />
ANNUAL REPORT 2014 2015 57
Output Expense Statement<br />
Road Safety Programme for the year<br />
ended 30 June 2015<br />
2013/14<br />
Actual<br />
$000<br />
2014/15<br />
Actual<br />
$000<br />
2014/15<br />
Main<br />
Estimates<br />
$000<br />
2014/15<br />
Supplementary<br />
Estimates<br />
Adjusted for<br />
26A Changes<br />
$000<br />
Revenue<br />
Revenue Crown 308,667 320,294 296,667 320,294<br />
Revenue Department – – – –<br />
Revenue Other – – – –<br />
Total Revenue 308,667 320,294 296,667 320,294<br />
Expenses<br />
High Risk Behaviours:<br />
High Risk Drivers 93,149 93,127 87,539 94,758<br />
Young Drivers – – – –<br />
Motorcycling – – – –<br />
Alcohol / Drug Impaired 49,246 51,271 48,961 52,644<br />
Speed 74,278 74,270 72,077 78,024<br />
Restraint 13,220 14,494 13,270 14,903<br />
Heavy Vehicle Fleet 9,502 9,833 8,877 9,778<br />
Roads and Roadsides 1,208 1,183 1,225 1,288<br />
Light Vehicle Fleet – – – –<br />
Walking and Cycling 1,440 1,474 1,383 1,562<br />
Fatigue and Distraction 2,369 2,432 2,386 2,571<br />
Older Road Users – – – –<br />
Crash Attendance and <strong>Report</strong>ing 56,480 56,314 54,414 57,606<br />
Traffic Management 7,346 7,397 6,535 7,160<br />
Total Expenses 308,238 311,795 296,667 320,294<br />
Net Surplus (Deficit) 429 8,499 – –<br />
58
4. FINANCIAL STATEMENTS<br />
Financial Statements for the Year Ended 30 June 2015<br />
Statement of Accounting Policies<br />
<strong>Report</strong>ing Entity<br />
Police is a government department as defined by section 2 of the Public Finance Act 1989, and<br />
is domiciled and operates in New Zealand. The relevant legislation governing Police’s operations<br />
includes the Public Finance Act 1989 and the Policing Act 2008. Police’s ultimate controlling entity<br />
is the New Zealand Crown.<br />
Police’s primary objective is to provide services to the New Zealand public, including keeping<br />
the peace, maintaining public safety, law enforcement, crime prevention, community support<br />
and reassurance, national security, participating in policing activities outside New Zealand, and<br />
emergency management. Police does not operate to make a financial return.<br />
The financial statements for Police have been prepared in accordance with the requirements of the<br />
Public Finance Act 1989. Accordingly, Police has designated itself as a Public Benefit Entity (PBE)<br />
for financial reporting purposes.<br />
The reporting period for these financial statements is the year ended 30 June 2015.<br />
Basis of Preparation<br />
The financial statements have been prepared on a going concern basis and the accounting policies<br />
set out below have been applied consistently throughout the period.<br />
Statement of Compliance<br />
These financial statements have been prepared in accordance with New Zealand generally<br />
accepted accounting practice (NZ GAAP) and tier 1 PBE accounting standards. These financial<br />
statements are the first financial statements presented in accordance with the new PBE accounting<br />
standards.<br />
Other than changes in terminology and presentation to the financial statements, there have been<br />
no material adjustments arising on transition to the new PBE accounting standards.<br />
Presentation Currency and Rounding<br />
The financial statements are presented in New Zealand dollars and all values are rounded to the<br />
nearest thousand dollars ($000).<br />
Standards Issued and Not Yet Effective and Not Early Adopted<br />
In May 2013, the External <strong>Report</strong>ing Board issued a new suite of PBE accounting standards for<br />
application by public sector entities for reporting periods beginning on or after 1 July 2014. Police<br />
has applied these standards in preparing the 30 June 2015 financial statements.<br />
In October 2014, the PBE suite of accounting standards was updated to incorporate requirements<br />
and guidance for the not-for-profit sector. These updated standards apply to PBEs with reporting<br />
periods beginning on or after 1 April 2015. Police will apply these updated standards in preparing<br />
30 June 2016 financial statements. Police expects minimal or no change in applying these updated<br />
accounting standards.<br />
ANNUAL REPORT 2014 2015 59
Statement of Significant Accounting Policies<br />
Revenue<br />
Revenue is measured at fair value. The specific accounting policies for significant revenue items<br />
are explained below:<br />
Crown Revenue<br />
Police is primarily funded from the Crown. This revenue is restricted in its use for the purpose of<br />
Police meeting the objectives specified in its founding legislation and the scope of the relevant<br />
appropriations each year. Police consider that there are no conditions attached to the funding and<br />
it is recognised as revenue at the point of entitlement.<br />
The fair value of revenue from the Crown has been determined to be equivalent to the amounts<br />
due in the funding arrangements.<br />
Other Revenue<br />
Revenue earned through the provision of services to third parties on commercial terms are<br />
considered exchange transactions. Revenue from these services is recognised when earned<br />
and is reported in the financial period to which it relates.<br />
The Police Revenue is considered to be non-exchange.<br />
Leases<br />
Operating Leases<br />
An operating lease is a lease that does not transfer substantially all the risks and rewards incidental<br />
to ownership of the asset to the lessee.<br />
Lease payments under an operating lease are recognised as an expense on a straight-line basis<br />
over the lease term.<br />
Leasehold improvements are capitalised and the cost is amortised over the unexpired period<br />
of the lease or the estimated useful life of the improvements, whichever is shorter.<br />
Lease incentives received are recognised evenly over the term of the lease as a reduction in<br />
rental expense.<br />
Cash and Cash Equivalents<br />
Cash and cash equivalents include cash on hand, deposits held on call with banks, and other<br />
short-term highly liquid investments with original maturities of three months or less.<br />
Receivables<br />
Accounts receivables are initially measured at fair value and subsequently measured at amortised<br />
cost using the effective interest rate, less impairment changes.<br />
A receivable is considered impaired when there is objective evidence that Police will not be able<br />
to collect the amount due. The amount of the impairment is the difference between the carrying<br />
amount of the receivable and the present value of the amount expected to be collected.<br />
The Police receivables are considered to be non-exchange.<br />
Non-Current Assets Held for Sale<br />
Non-current assets held for sale are classified as held for sale if their carrying amount will<br />
be recovered principally through a sale transaction rather than through continuing use.<br />
60
Non-current assets held for sale are recorded at the lower of their carrying amount and<br />
fair value less costs to sell.<br />
Any impairment losses for write-downs of non-current assets held for sale are recognised<br />
in the surplus or deficit.<br />
Any increases in fair value (less costs to sell) are recognised up to the level of any impairment<br />
losses that have been previously recognised.<br />
Non-current assets held for sale are not depreciated or amortised while they are classified<br />
as held for sale.<br />
Property, Plant and Equipment<br />
Property, plant and equipment consists of the following asset classes: land, buildings, furniture<br />
and fittings, plant, equipment and communication assets, motor vehicles and vessels.<br />
Land is measured at fair value, and buildings are measured at fair value less accumulated<br />
depreciation and accumulated impairment losses. All other asset classes are measured at cost,<br />
less accumulated depreciation and impairment losses.<br />
Revaluations<br />
Land and buildings are revalued at least every five years or whenever the carrying amount differs<br />
materially to fair value.<br />
Land and buildings revaluation movements are accounted for on a class-of-asset basis.<br />
The net revaluation results are credited or debited to other comprehensive revenue and expenses<br />
and are accumulated to an asset revaluation reserve in equity for that class of asset. Where this<br />
would result in a debit balance in the asset revaluation reserve, this balance is not recognised<br />
in other comprehensive revenue and expenses but recognised in the surplus or deficit. Any<br />
subsequent increase on revaluation that reverses a previous decrease in value recognised in<br />
the surplus or deficit will be recognised in other comprehensive revenue and expenses.<br />
Additions<br />
The cost of an item of property, plant and equipment is recognised as an asset only when it is<br />
probable that future economic benefits or service potential associated with the item will flow to<br />
Police and the cost of the item can be measured reliably.<br />
Capital work in progress is recognised at cost less impairment and is not depreciated.<br />
In most instances, an item of property, plant, and equipment is initially recognised at its cost.<br />
Where an asset is acquired through a non-exchange transaction, it is recognised at its fair value<br />
as at the date of acquisition.<br />
Disposals<br />
Gains and losses on disposals are determined by comparing the proceeds with the carrying<br />
amount of the asset. Gains and losses on disposals are reported net in the surplus or deficit.<br />
When revalued assets are sold, the amounts included in revaluation reserves in respect of those<br />
assets are transferred to general funds.<br />
ANNUAL REPORT 2014 2015 61
Depreciation<br />
Depreciation is charged on a straight-line basis on all property, plant and equipment other<br />
than land, at rates calculated to allocate the cost or valuation of an item of property, plant and<br />
equipment, less any estimated residual value, over its estimated useful life. The useful lives and<br />
associated depreciation rates for classes of property, plant and equipment are as follows:<br />
Class of Asset<br />
Land<br />
Depreciation rate<br />
Not depreciated<br />
Buildings 1–10%<br />
Plant and Equipment, Computer Equipment and Communication Assets 8–25%<br />
Vessels 6–25%<br />
Furniture / Fittings 10%<br />
Motor Vehicles 8–17%<br />
The useful life and estimated residual value of motor vehicles are classified into three separate<br />
classes, sedans and station wagons, light commercial and heavy vehicles. The weighted average<br />
depreciation rate across these classes is 13.2% (2014: 13.2%).<br />
Leasehold improvements are depreciated over the unexpired period of the lease or the estimated<br />
remaining useful lives, whichever is the shorter.<br />
The residual value and useful life of an asset is reviewed, and adjusted if applicable, at each<br />
financial year end.<br />
Intangible Assets<br />
Software Acquisition and Development<br />
Acquired computer software licenses are capitalised on the basis of the costs incurred to acquire<br />
and bring to use the specific software.<br />
Costs that are directly associated with the development of software for internal use are recognised<br />
as an intangible asset. Direct costs include software development employee costs and an<br />
appropriate portion of relevant overheads.<br />
Amortisation<br />
The carrying value of an intangible asset with a finite life is amortised on a straight-line basis<br />
over its useful life. Amortisation begins when the asset is available for use and ceases at the date<br />
that the asset is derecognised. The amortisation charge for each financial year is recognised in<br />
surplus or deficit.<br />
The useful life and associated amortisation rate of a major class of intangible assets being<br />
“Acquired and developed computer software” has been estimated at 5 years (20%).<br />
Impairment of Property, Plant and Equipment and Intangible Assets<br />
Police does not hold any cash generating assets. Assets are considered cash-generating where<br />
their primary objective is to generate a separately identifiable commercial return.<br />
Non-Cash Generating Assets<br />
Property, plant and equipment and intangible assets held at cost that have a finite useful life are<br />
reviewed for impairment whenever events or changes in circumstances indicate that the carrying<br />
62
amount may not be recoverable. An impairment loss is recognised for the amount by which the<br />
asset’s carrying amount exceeds its recoverable service amount. The recoverable service amount<br />
is the higher of an asset’s fair value less costs to sell and value in use.<br />
Value in use is determined based on either a depreciated replacement cost approach, restoration<br />
cost approach, or a service units approach. The most appropriate approach used to measure<br />
value in use depends on the nature of the impairment and availability of information.<br />
If an asset’s carrying amount exceeds its recoverable service amount, the asset is regarded as<br />
impaired and the carrying amount is written-down to the recoverable amount. The total impairment<br />
loss is recognised in the surplus or deficit.<br />
Any reversal of an impairment loss is recognised in the surplus or deficit.<br />
Employee Entitlements<br />
Short-Term Employee Entitlements<br />
Employee benefits that are due to be settled within 12 months are reported at the amount<br />
expected to be paid.<br />
These include salaries and wages accrued up to balance date, annual leave earned to but not<br />
yet taken at balance date, and sick leave.<br />
A liability for sick leave is recognised to the extent that absences in the coming year are expected<br />
to be greater than sick leave entitlements earned in the coming year. The amount is calculated<br />
based on the unused sick leave entitlement that can be carried forward at balance date, to the<br />
extent that it will be used by staff to cover those future absences.<br />
A liability and an expense are recognised for bonuses where there is a contractual obligation or<br />
where there is a past practice that has created a constructive obligation and a reliable estimate<br />
of the obligation can be made.<br />
Long-Term Employee Entitlements<br />
Employee benefits that are due to be settled beyond 12 months after the end of period in which<br />
the employee renders the related service, such as long service leave and retirement gratuities,<br />
have been calculated on an actuarial basis. The calculations are based on the:<br />
––<br />
likely future entitlements accruing to staff, based on years of services, years to entitlement,<br />
the likelihood that staff will reach the point of entitlement, and contractual entitlement<br />
information; and<br />
––<br />
present value of the estimated future cash flows.<br />
Termination Benefits<br />
Termination benefits are recognised in surplus or deficit only when there is a demonstrable<br />
commitment to either terminate employment prior to normal retirement date or to provide such<br />
benefits as a result of an offer to encourage voluntary redundancy. Termination benefits settled<br />
within 12 months are reported at the amount expected to be paid, otherwise they are reported<br />
as the present value of the estimated future cash outflows.<br />
Presentation of Employee Entitlements<br />
Sick leave, annual leave, and vested long service leave are classified as a current liability. Nonvested<br />
long service leave and retirement gratuities expected to be settled within 12 months of<br />
balance date are classified as a current liability. All other employee entitlements are classified as<br />
a non-current liability.<br />
ANNUAL REPORT 2014 2015 63
Provisions<br />
A provision is recognised for future expenditure of uncertain amount or timing when there is a<br />
present obligation (either legal or constructive) as a result of a past event, it is probable that an<br />
outflow of future economic benefits will be required to settle the obligation, and a reliable estimate<br />
can be made of the amount of the obligation.<br />
Provisions are measured at the present value of the expenditure expected to be required to settle<br />
the obligation using a pre-tax discount rate that reflects current market assessments of the time<br />
value of money and the risks specific to the obligation. The increase in the provision due to the<br />
passage of time is recognised as an increase in the appropriate item of expenditure in profit or loss.<br />
Commitments<br />
A provision for future expenses and liabilities to be incurred on contracts that have been entered<br />
into at balance date are reported as commitments to the extent that they represent unperformed<br />
obligations.<br />
Contingencies<br />
Contingent liabilities and contingent assets are reported at the point at which the contingency<br />
is evident or when a present liability is unable to be measured with sufficient reliability to be<br />
recorded in the financial statements (unquantifiable liability). Contingent liabilities, including<br />
unquantifiable liabilities, are disclosed if the possibility that they will crystallise is not remote.<br />
Contingent liabilities are recorded in the Statement of Contingent Liabilities at the point at which<br />
the contingency is evident.<br />
Contingent assets are disclosed if it is probable that the benefits will be realised.<br />
Accident Compensation Corporation (ACC) Partnership Programme<br />
Police belongs to the ACC Partnership Programme whereby Police accepts the management and<br />
financial responsibility of work related illnesses and accidents of employees. Under the Programme,<br />
Police is liable for all its claims costs for a period of four years. At the end of the four year period,<br />
Police pays a premium to ACC for the value of residual claims, and the liability for ongoing claims<br />
from that point passes to ACC.<br />
The liability for the ACC Partnership Programme is measured at the present value of expected<br />
future payments to be made in respect of the employee injuries and claims up to the reporting<br />
date using actuarial techniques. Consideration is given to expected future wage and salary levels<br />
and experience of employee claims and injuries. Expected future payments are discounted using<br />
market yields at the reporting date on government bonds with terms to maturity that match, as<br />
closely to possible, the estimated future cash outflows.<br />
Equity<br />
Equity is the Crown’s net investment in Police and is measured as the difference between total<br />
assets and total liabilities and is classified as taxpayers’ funds.<br />
Revaluation reserves relate to land and buildings being revalued to fair value.<br />
Goods and Services Tax (GST)<br />
All items in the financial statements are presented exclusive of GST except for accounts receivable<br />
and accounts payable, which are presented on a GST inclusive basis. Where GST is not<br />
recoverable as input tax, it is recognised as part of the related asset or expense.<br />
64
The amount of GST owing to or by the Inland Revenue Department (IRD) at balance date, being<br />
the difference between Output GST and Input GST, is included in accounts payable or accounts<br />
receivable as appropriate. The net amount of GST paid to, or received from the IRD including<br />
GST relating to investing and financing activities is classified as an operating cash flow in the<br />
cash flow statement.<br />
Income tax<br />
Police is exempt from the payment of income tax in terms of the Income Tax Act 2007.<br />
Accordingly, no provision has been made for income tax.<br />
Budget figures<br />
The budget figures are those included in the Estimates of Appropriation for and the Supporting<br />
Information (Budget) for the year ending 30 June 2015 and the Supplementary Estimates of<br />
Appropriation (Revised Budget) and the Supporting Information for the year ending 30 June 2015.<br />
The budget figures have been prepared in accordance with NZ GAAP using accounting policies<br />
that are consistent with those adopted in preparing these financial statements and are based on<br />
PBE accounting standards. Forecast information has been included for the following financial year<br />
for the first time. The Public Finance Amendment Act 2013 requires this. The aim is to increase<br />
transparency by providing the reader with further context of this year’s results by showing next<br />
year’s forecast for comparison.<br />
The forecast figures are those included in the Information Supporting the Estimates of<br />
Appropriations for the year ending 30 June 2016 (the Forecast is 2015 Budget and Economic<br />
and Fiscal Update (BEFU 2015) out-year 1 figures).<br />
The budget and forecast figures are unaudited and have been prepared in accordance with<br />
the requirements of the Public Finance Act 1989, and comply with PBE accounting standards.<br />
They are to be used in the future for reporting historical general purpose financial statements.<br />
The forecast figures contained in these financial statements reflect Police’s purpose and activities<br />
and are based on a number of assumptions on what may occur during the year 2015/16.<br />
Forecast events and circumstances may not occur as expected. Factors that could lead to<br />
material differences between the forecast financial statements and the 2015/16 actual financial<br />
statements include changes to the baseline forecast through new initiatives, Cabinet decisions<br />
and technical adjustments.<br />
Cost Allocation<br />
Costs are allocated to output expenses based upon activity profiles assigned to staff positions.<br />
For support services which do not directly deliver outputs, the allocation of cost is based on an<br />
assessed consumption of that service.<br />
Critical Accounting Estimates and Assumptions<br />
In preparing these financial statements, Police has made estimates and assumptions that concern<br />
the future. These estimates and assumptions may differ to the subsequent actual results. The<br />
estimates and assumptions are based on historical experience and various other factors, including<br />
expectations or future events that are believed to be reasonable under the circumstances.<br />
The estimates and assumptions are reviewed on an ongoing basis. The estimates and<br />
assumptions that have a significant risk of causing a material adjustment to the carrying amounts<br />
of assets and liabilities within the next financial year are discussed below:<br />
ANNUAL REPORT 2014 2015 65
Fair Value of Land and Buildings<br />
Note 9 provides the significant assumptions that have been applied in determining the fair value<br />
of land and buildings.<br />
Useful Lives and Residual Values of Property, Plant and Equipment<br />
The useful lives and residual values of property, plant and equipment are reviewed at each<br />
balance date.<br />
Long Service Leave and Sick Leave<br />
Note 14 provides an analysis of the exposure and assumptions in relation to estimates and<br />
uncertainties surrounding long service leave and sick leave.<br />
66
STATEMENT OF APPROPRIATIONS<br />
for the Year Ended 30 June 2015<br />
Actual<br />
2013/14<br />
$000<br />
Actual<br />
2014/15<br />
$000<br />
Main<br />
Estimates<br />
2014/15<br />
$000<br />
Changes<br />
during<br />
the year<br />
2014/15<br />
$000<br />
Supp.<br />
Estimates<br />
2014/15<br />
$000<br />
Sec. 26A<br />
Changes<br />
2014/15<br />
$000<br />
Appro.<br />
Voted<br />
2014/15<br />
$000<br />
Appropriations for Departmental Output Expenses<br />
Policy Advice and<br />
Ministerial Servicing<br />
General Crime<br />
Prevention Services<br />
Specific Crime<br />
Prevention Services and<br />
Maintenance of Public<br />
Order<br />
Police Primary<br />
Response Management<br />
3,307 3,979 3,135 867 4,002 – 4,002<br />
155,012 160,347 153,190 6,510 159,700 – 159,700<br />
146,962 156,103 140,593 15,823 156,416 – 156,416<br />
385,036 382,313 385,442 (5,401) 380,041 – 380,041<br />
Investigations 367,209 381,745 368,059 11,242 379,301 400 379,701<br />
Case Resolution and<br />
Support to Judicial<br />
Process<br />
125,413 127,816 117,617 9,499 127,116 1,200 128,316<br />
Road Safety Programme 308,238 311,795 296,667 25,227 321,894 (1,600) 320,294<br />
Total Appropriations<br />
for Departmental<br />
Output Expenses<br />
1,491,177 1,524,098 1,464,703 63,767 1,528,470 – 1,528,470<br />
Appropriation for Departmental Other Expenses<br />
Compensation for<br />
Confiscated Firearms<br />
Total Departmental<br />
Appropriation for<br />
Other Expenses<br />
Appropriation for<br />
Capital Contribution<br />
from the Crown<br />
Appropriation for<br />
Capital Withdrawal by<br />
the Crown<br />
– – 10 (10) – – –<br />
– – 10 (10) – – –<br />
– – – – – – –<br />
(22,989) (13,198) – – – – –<br />
The accompanying notes form part of the financial statements.<br />
ANNUAL REPORT 2014 2015 67
Actual<br />
2013/14<br />
$000<br />
Actual<br />
2014/15<br />
$000<br />
Main<br />
Estimates<br />
2014/15<br />
$000<br />
Changes<br />
during<br />
the year<br />
2014/15<br />
$000<br />
Supp.<br />
Estimates<br />
2014/15<br />
$000<br />
Sec. 26A<br />
Changes<br />
2014/15<br />
$000<br />
Appro.<br />
Voted<br />
2014/15<br />
$000<br />
Appropriation for Non-Departmental Other Expense Flows<br />
United Nations Drug<br />
Control Programme<br />
Total Non-<br />
Departmental<br />
Appropriations for<br />
Other Expenses<br />
100 100 100 – 100 – 100<br />
100 100 100 – 100 – 100<br />
Appropriations for Non-Departmental Revenue Flows<br />
Non-Tax Revenue:<br />
Infringement Fees 86,608 86,396 70,900 15,000 85,900 – 85,900<br />
Sale of Unclaimed<br />
Property<br />
153 178 400 – 400 – 400<br />
Crown Revenue 100 100 100 – 100 – 100<br />
Forfeit to Crown 105 28 – – – – –<br />
Investment Income 18 – – – – – –<br />
Total Appropriations<br />
for Non-Departmental<br />
Revenue<br />
86,984 86,702 71,400 15,000 86,400 – 86,400<br />
The accompanying notes form part of the financial statements.<br />
68
STATEMENT OF COMPREHENSIVE<br />
REVENUE AND EXPENSES<br />
for the Year Ending 30 June 2015<br />
Note<br />
Actual<br />
2013/14<br />
$000<br />
Actual<br />
2014/15<br />
$000<br />
Main<br />
Estimates<br />
2014/15<br />
$000<br />
Supp.<br />
Estimates<br />
2014/15<br />
$000<br />
Revenue<br />
Crown 1,488,182 1,502,604 1,448,920 1,502,604<br />
Other Revenue 2 22,504 24,205 15,783 25,866<br />
Interest – – – –<br />
Total Revenue 1,510,686 1,526,809 1,464,703 1,528,470<br />
Expenditure<br />
Personnel 3 1,061,432 1,107,000 1,073,889 1,095,079<br />
Operating 4 282,950 276,821 251,851 292,190<br />
Depreciation and Amortisation Expenses 6 82,473 77,361 82,210 77,976<br />
Capital Charge 7 64,322 62,916 56,753 63,225<br />
Total Operating Expenses 1,491,177 1,524,098 1,464,703 1,528,470<br />
Surplus (Deficit) from Outputs 19,509 2,711 – –<br />
Revaluation of Land and Buildings – 49,225 – (141)<br />
Other Comprehensive Income – 49,225 – (141)<br />
Total Comprehensive income 19,509 51,936 – (141)<br />
The accompanying notes form part of the financial statements.<br />
ANNUAL REPORT 2014 2015 69
STATEMENT OF MOVEMENTS IN<br />
TAXPAYERS’ FUNDS<br />
for the Year Ended 30 June 2015<br />
Notional<br />
Capital<br />
$000<br />
Reval.<br />
Reserves<br />
$000<br />
Total<br />
Actual<br />
$000<br />
Main<br />
Estimates<br />
$000<br />
Supp.<br />
Estimates<br />
$000<br />
Taxpayers’ Funds as at 1 July 2014 524,160 268,962 793,122 802,482 793,122<br />
Net Surplus (Deficit) for the Year 2,711 – 2,711 – –<br />
Other Comprehensive Income – 49,225 49,225 – (141)<br />
Transfer of Revaluation Reserve to<br />
Taxpayers’ Funds on Disposal of Assets<br />
Total Comprehensive Income<br />
for the Year<br />
1,959 (1,959) – – –<br />
4,670 47,266 51,936 – (141)<br />
Transactions with owners in their capacity as owners<br />
Provision for Repayment of Surplus<br />
to Crown<br />
(2,711) – (2,711) – –<br />
Capital Contribution – – – – 1,326<br />
Capital Withdrawal (13,198) – (13,198) – (13,198)<br />
Total Transactions with Owners in<br />
Their Capacity as Owners<br />
Total Taxpayers’ Funds as at<br />
30 June 2015<br />
(15,909) – (15,909) – (11,872)<br />
512,921 316,228 829,149 802,482 781,109<br />
The accompanying notes form part of the financial statements.<br />
70
STATEMENT OF MOVEMENTS IN<br />
TAXPAYERS’ FUNDS<br />
for the Year Ended 30 June 2014<br />
Notional<br />
Capital<br />
$000<br />
Reval.<br />
Reserves<br />
$000<br />
Total<br />
Actual<br />
$000<br />
Main<br />
Estimates<br />
$000<br />
Supp.<br />
Estimates<br />
$000<br />
Taxpayers’ Funds as at 01 July 2013 534,924 281,187 816,111 815,449 816,111<br />
Net Surplus (Deficit) for the Year 19,509 – 19,509 178 –<br />
Other Comprehensive Income – – – – 746<br />
Transfer of Revaluation Reserve to<br />
Taxpayers’ Funds on Disposal of Assets<br />
Total Comprehensive Income<br />
for the Year<br />
12,225 (12,225) – – –<br />
31,734 (12,225) 19,509 178 746<br />
Transactions with Owners in Their Capacity as Owners<br />
Provision for Repayment of Surplus<br />
to Crown<br />
(19,509) – (19,509) (178) –<br />
Capital Contribution – – – – –<br />
Capital Withdrawal (22,989) – (22,989) – (14,375)<br />
Total Transactions with Owners in<br />
Their Capacity as Owners<br />
Total Taxpayers’ Funds as at<br />
30 June 2014<br />
(42,498) – (42,498) (178) (14,375)<br />
524,160 268,962 793,122 815,449 802,482<br />
The accompanying notes form part of the financial statements.<br />
ANNUAL REPORT 2014 2015 71
STATEMENT OF FINANCIAL POSITION<br />
as at 30 June 2015<br />
Note<br />
Actual<br />
2013/14<br />
$000<br />
Actual<br />
2014/15<br />
$000<br />
Main<br />
Estimates<br />
2014/15<br />
$000<br />
Supp.<br />
Estimates<br />
2014/15<br />
$000<br />
Assets<br />
Current Assets<br />
Cash 64,827 23,313 30,000 30,000<br />
Accounts Receivable 8 267,146 290,728 228,113 301,915<br />
Prepayments 5,952 8,937 7,076 6,199<br />
Inventories 48 59 54 48<br />
Assets Held for Sale 11 – 1,630 – –<br />
Total Current Assets 337,973 324,667 265,243 338,162<br />
Non-Current Assets<br />
Property, Plant and Equipment 9 820,201 855,170 899,048 834,326<br />
Intangibles 10 39,962 38,274 26,532 37,769<br />
Total Non-Current Assets 860,163 893,444 925,580 872,095<br />
Total Assets 1,198,136 1,218,111 1,190,823 1,210,257<br />
Liabilities<br />
Current Liabilities<br />
Creditors and Payables 12 19,769 24,035 43,022 41,951<br />
Accrued Expenses 13 64,716 36,182 55,730 39,489<br />
Employee Entitlements 14 147,227 174,289 149,362 204,308<br />
Provision for Repayment of Surplus<br />
to the Crown<br />
19,509 2,711 – –<br />
Total Current Liabilities 251,221 237,217 248,114 285,748<br />
Non-Current Liabilities<br />
Employee Entitlements 14 153,793 151,745 140,227 143,400<br />
Total Non-Current Liabilities 153,793 151,745 140,227 143,400<br />
Total Liabilities 405,014 388,962 388,341 429,148<br />
Net Assets 793,122 829,149 802,482 781,109<br />
Taxpayers’ Funds<br />
General Funds 524,160 512,921 522,457 514,247<br />
Property, Plant and Equipment<br />
Revaluation Reserves<br />
268,962 316,228 280,025 266,862<br />
Total Taxpayers’ Funds 793,122 829,149 802,482 781,109<br />
The accompanying notes form part of the financial statements.<br />
72
STATEMENT OF CASH FLOWS<br />
for the Year Ended 30 June 2015<br />
Note<br />
Actual<br />
2013/14<br />
$000<br />
Actual<br />
2014/15<br />
$000<br />
Main<br />
Estimates<br />
2014/15<br />
$000<br />
Supp.<br />
Estimates<br />
2014/15<br />
$000<br />
Cash Flows from Operating Activities<br />
Cash provided from:<br />
Supply of Outputs to:<br />
- Crown 1,526,473 1,456,627 1,472,104 1,444,106<br />
- Others 21,107 22,923 15,126 22,782<br />
1,547,580 1,479,550 1,487,230 1,466,888<br />
Cash was applied to:<br />
Produce Outputs:<br />
- Personnel (1,048,798) (1,106,762) (1,079,762) (1,056,515)<br />
- Operating (307,163) (275,799) (260,120) (280,654)<br />
- Capital Charge (64,322) (62,916) (56,753) (63,225)<br />
(1,420,283) (1,445,477) (1,396,635) (1,400,394)<br />
Net Cash Flows from Operating Activities 15 127,297 34,073 90,595 66,494<br />
Cash Flows from Investing Activities<br />
Cash provided from:<br />
Sale of Non-Current Assets 12,758 5,338 5,233 2,860<br />
Cash was applied to:<br />
Purchase of Property, Plant and Equipment (48,908) (57,411) (82,286) (81,965)<br />
Purchase of Intangible Assets (25,569) (13,514) (13,542) (13,542)<br />
Net Cash Flows from Investing Activities (61,719) (65,587) (90,595) (92,647)<br />
Cash Flows from Financing Activities<br />
Cash provided from:<br />
Capital Contribution – – – 1,326<br />
Cash was Applied to:<br />
Capital Withdrawal (8,370) (10,000) – (10,000)<br />
Net Cash Flows from Financing Activities (8,370) (10,000) – (8,674)<br />
Net Increase (Decrease) in Cash Held 57,208 (41,514) – (34,827)<br />
Add Opening Cash 7,619 64,827 30,000 64,827<br />
Closing Cash as at 30 June 64,827 23,313 30,000 30,000<br />
Cash Balance Consists of<br />
Cash at Bank 63,793 22,312 28,830 28,830<br />
Petty Cash 821 773 820 820<br />
Overseas Posts 213 228 350 350<br />
Total Cash 64,827 23,313 30,000 30,000<br />
During the period, Police did not acquire any property, plant and equipment by means of finance lease (2014: nil).<br />
The accompanying notes form part of the financial statements.<br />
ANNUAL REPORT 2014 2015 73
STATEMENT OF UNAPPROPRIATED<br />
EXPENDITURE<br />
for the Year Ended 30 June 2015<br />
Output Expenses<br />
Actual<br />
$000<br />
Authorised<br />
at time of<br />
Breach<br />
$000<br />
Unappropriated<br />
Expenditure<br />
$000<br />
2015<br />
General Crime Prevention Services 160,347 159,700 (647)<br />
Police Primary Response Management 382,313 380,041 (2,272)<br />
Investigations 381,745 379,701 (2,044)<br />
TOTAL 924,405 919,442 (4,963)<br />
2014<br />
No Unappropriated Expenses<br />
Police sought fiscally neutral transfers between outputs expense appropriations for 2014/15 within<br />
Vote: Police under Section 26A of the Public Finance Act. These transfers were effected by way of<br />
an Order in Council made in May 2015. Expenses and Capital Expenditure Interim Authority under<br />
Imprest Supply approved under the Act.<br />
Net Assets<br />
Section 22 of the Public Finance Act requires that the net asset holding of a department must<br />
not exceed the most recent projected balance of net assets for that department as set out in an<br />
Appropriation Act, except where Ministers agree a surplus may be retained or where assets or<br />
liabilities have been remeasured. Police have not breached this requirement during the year<br />
(2014: $nil).<br />
The accompanying notes form part of the financial statements.<br />
74
STATEMENT OF TRUST MONIES<br />
for the Year Ended 30 June 2015<br />
Opening<br />
Balance<br />
$000<br />
Receipts<br />
$000<br />
Payments<br />
$000<br />
Closing<br />
Balance<br />
$000<br />
Bequests, Donations, Appeals 70 12 (82) –<br />
Reparation 8 15 (18) 5<br />
Money in Custody 13,933 21,190 (22,414) 12,709<br />
Found Money 137 189 (255) 71<br />
Forfeited Money Payable to Crown 502 7,424 (7,948) (22)<br />
Total 14,650 28,830 (30,717) 12,763<br />
The trust account holds funds retained by Police on behalf of other parties.<br />
Bequests, Donations and Appeals are monies contributed by third parties for projects managed<br />
by Police.<br />
Reparation money is money received from offenders to be paid to victims.<br />
Money in Custody is money seized during operations and money held for suspects in custody.<br />
Found Money is money that has been handed in by members of the public, that Police holds<br />
pending the rightful owner coming forward to claim it.<br />
Forfeited Money Payable to Crown is money that is payable to the Crown following Court<br />
decisions.<br />
The accompanying notes form part of the financial statements.<br />
ANNUAL REPORT 2014 2015 75
STATEMENT OF CONTINGENT<br />
LIABILITIES AND CONTINGENT ASSETS<br />
as at 30 June 2015<br />
Actual<br />
2013/14<br />
$000<br />
Actual<br />
2014/15<br />
$000<br />
Legal Proceedings and Disputes 2,669 2,834<br />
Personal Grievances 72 56<br />
Total 2,741 2,890<br />
Legal Proceedings<br />
Legal proceedings represent claims lodged with the Crown Law office, but which have not been<br />
settled. Previous experience with such claims is that the majority are unsuccessful in total and<br />
those that are resolved in favour of the claimant are for amounts substantially less than the<br />
amount claimed.<br />
Personal Grievances<br />
Personal Grievances represent amounts claimed by employees of Police for Personal Grievance<br />
cases, for various reasons.<br />
Contingent Assets<br />
Police has no contingent assets at 30 June 2015 (2014: $nil).<br />
The accompanying notes form part of the financial statements.<br />
76
STATEMENT OF COMMITMENTS<br />
as at 30 June 2015<br />
Capital Commitments<br />
Capital commitments are the aggregate amount of capital expenditure contracted for the<br />
acquisition of property, plant and equipment and intangible assets that have not been paid<br />
for nor recognised as a liability at the balance sheet date.<br />
Non-Cancellable Operating Lease Commitments<br />
Police leases property, plant and equipment in the normal course of its business. The majority<br />
of these leases are for premises, computer equipment and photocopiers, which have a noncancellable<br />
leasing period ranging from 1 to 19 years.<br />
Actual<br />
2013/14<br />
$000<br />
Actual<br />
2014/15<br />
$000<br />
Capital Commitments<br />
Works<br />
Less Than One Year 2,776 9<br />
Total Works 2,776 9<br />
Plant, Equipment and Intangible assets<br />
Less Than One Year 125 16,931<br />
Plant, Equipment and Intangible assets 125 16,931<br />
Motor Vehicles<br />
Less Than One Year – 3,772<br />
Total Motor Vehicles – 3,772<br />
Total Capital Commitments 2,901 20,712<br />
Operating<br />
Accommodation Leases<br />
Less Than One Year 13,505 13,387<br />
One to Two Years 12,173 11,063<br />
Two to Five Years 20,342 9,721<br />
Greater Than Five Years 52,561 11,703<br />
Other Non-Cancellable Leases<br />
Less Than One Year 33,440 39,170<br />
One to Two Years 19,094 27,920<br />
Two to Five Years 43,869 64,551<br />
Greater Than Five Years 42,905 44,537<br />
Total Leases 237,889 222,052<br />
Total Commitments 240,790 242,764<br />
The accompanying notes form part of the financial statements.<br />
ANNUAL REPORT 2014 2015 77
NOTES TO THE FINANCIAL STATEMENTS<br />
for the Year Ended 30 June 2015<br />
1. Budget Composition<br />
Main<br />
Estimates<br />
$000<br />
Supplementary<br />
Estimates<br />
Changes<br />
$000<br />
Budget<br />
Total<br />
$000<br />
Revenue<br />
Crown 1,448,920 53,684 1,502,604<br />
Other 15,783 10,083 25,866<br />
Total Revenue 1,464,703 63,767 1,528,470<br />
Expenditure<br />
Personnel 1,073,889 21,190 1,095,079<br />
Operating 251,851 40,339 292,190<br />
Depreciation and Amortisation Expenses 82,210 (4,234) 77,976<br />
Capital Charge 56,753 6,472 63,225<br />
Total Output Operating Expenses 1,464,703 63,767 1,528,470<br />
Net Surplus (Deficit) – – –<br />
Explanations for major variances from the Main Estimates were outlined in the Supplementary<br />
Estimates. These were:<br />
Crown Revenue<br />
––<br />
one-off funding from the Justice Sector Fund of $40.752 million to meet the forecast shortfall as<br />
a consequence of the Current Collective Employment Agreements<br />
––<br />
funding from the Ministry of Transport of $10 million for Speed Camera Expansion as part of the<br />
approved 2012/15 Road Policing Programme<br />
––<br />
new funding of $2.506 million for four Drug Proceeds of Crime Funding initiatives, namely,<br />
Expanding Asset Recovery Capability, Recovery of Legal Costs for Civil Actions Taken Under<br />
Criminal Proceeds (Recovery) Act 2009, Expansion of National Cannabis and Crime Operation,<br />
and Digital and Communication Infiltration and Detection<br />
––<br />
new funding of $1.075 million to establish a Child Protection Offender Register and a Risk<br />
Management Framework, and<br />
––<br />
decrease in revenue for an expense transfer of $1.333 million to 2016/17 relating to the HRMIS<br />
following receipt of better information from suppliers.<br />
Other Revenue<br />
––<br />
$9.300 million of additional funding from the Ministry of Foreign Affairs and Trade for<br />
deployments to Bougainville, Solomon Islands, Tonga and for the Partnership Policing<br />
Programme, and<br />
––<br />
$1.783 million increase in revenue from firearms licences resulting from an increasing trend of<br />
the 10-year cycle for re-licensing along with an increase in volume of first time applications.<br />
78
2. Other Revenue<br />
Actual<br />
2013/14<br />
$000<br />
Actual<br />
2014/15<br />
$000<br />
Arms Licences 3,104 4,227<br />
Chargeable Police Services 4,074 3,789<br />
Department of Corrections Remand Prisoners 673 263<br />
Overseas Deployments 8,855 10,806<br />
Pacific Island Chiefs of Police Secretariat Support 690 796<br />
Pacific Peoples Domestic Violence Programme 1,281 995<br />
Property Rentals 1,696 1,559<br />
The Royal NZ Police College: Catering Facility Hire and Non-Police Training 347 128<br />
Other 1,784 1,642<br />
Total Other Revenue 22,504 24,205<br />
3. Personnel<br />
Actual<br />
2013/14<br />
$000<br />
Actual<br />
2014/15<br />
$000<br />
Accident Compensation Costs 4,502 4,762<br />
Fringe Benefit Tax 1,888 1,967<br />
Salaries/Wages 925,677 942,193<br />
Staff Insurance 1,868 1,932<br />
Staff Recruitment 559 485<br />
Staff Transport Assistance 1,534 540<br />
Superannuation 108,579 109,657<br />
Training 2,045 2,511<br />
Transfer/Removal Expenses 1,974 2,431<br />
Increase/(Decrease) in Employee Entitlements 12,392 40,067<br />
Other 414 455<br />
Total Personnel 1,061,432 1,107,000<br />
ANNUAL REPORT 2014 2015 79
4. Operating<br />
Actual<br />
2013/14<br />
$000<br />
Actual<br />
2014/15<br />
$000<br />
Audit Fees 314 315<br />
Other Fees Paid to Auditor* – 2<br />
Bad Debts Expense 33 1,371<br />
Changes in Doubtful Debts Provision 627 (708)<br />
Clothing, Equipment and Consumables 19,756 23,761<br />
Communications 24,628 24,092<br />
Computer Charges 36,144 40,511<br />
Computer Leasing Expenses 3,617 2,760<br />
Equipment Rental 1,851 2,219<br />
ESR Forensic Science Services 21,424 21,879<br />
Foreign Exchange Rate (Gain)/Loss 29 24<br />
(Gain)/Loss on Sale of Non-Current Assets (Note 5) 1,899 (786)<br />
Other Operating Expenses 6,207 8,705<br />
Physical Asset Write-Offs 3,681 714<br />
Printing 8,003 7,002<br />
Professional Services 43,190 33,219<br />
Professional Services – Non Government Organisations 2,644 2,807<br />
Legal Expenses 4,423 4,192<br />
Property Rentals 19,250 18,372<br />
Property Utilities, Rates and Maintenance 30,370 33,147<br />
Third Party Expenses 3,036 3,383<br />
Travel 15,391 14,803<br />
Vehicle/Aircraft/Launch Rentals 5,036 5,690<br />
Vehicle Expenses 31,397 29,347<br />
Total Operating 282,950 276,821<br />
* Other Fees Paid to Auditors relates to work undertaken by EY on remuneration benchmarking survey.<br />
5. (Gain)/Loss on Sale of Non-Current Assets<br />
Actual<br />
2013/14<br />
$000<br />
Actual<br />
2014/15<br />
$000<br />
Disposal of Land and Buildings 2,162 (263)<br />
Sale of Motor Vehicles and Launches (263) (513)<br />
Sale of Plant and Equipment – (10)<br />
(Gain)/Loss on Sale of Non-Current Assets 1,899 (786)<br />
80
6. Depreciation and Amortisation of Intangibles<br />
Actual<br />
2013/14<br />
$000<br />
Actual<br />
2014/15<br />
$000<br />
Buildings 29,968 28,493<br />
Plant and Equipment, Computer Equipment and Communication Assets 19,532 16,903<br />
Vessels 546 537<br />
Furniture and Fittings 1,057 997<br />
Motor Vehicles 16,539 15,229<br />
Amortisation of Intangibles 14,831 15,202<br />
Total Depreciation 82,473 77,361<br />
7. Capital Charge<br />
Police pays a capital charge to the Crown on its taxpayers’ funds as at 30 June and 31 December<br />
each year. The capital charge rate for the year ended 30 June 2015 was 8.0% (2014: 8.0%).<br />
8. Accounts Receivable<br />
Actual<br />
2013/14<br />
$000<br />
Actual<br />
2014/15<br />
$000<br />
Trade Debtors 2,337 2,875<br />
Sundry Debtors 8,933 4,796<br />
Less: Provision for Doubtful Debts (1,355) (647)<br />
Net Debtors 9,915 7,024<br />
Debtor Crown 257,231 283,704<br />
Total Accounts Receivable 267,146 290,728<br />
The Carrying value of debtors and other receivables approximate their fair value.<br />
Movements in the provision for doubtful debts are as follows:<br />
Actual<br />
2013/14<br />
$000<br />
Actual<br />
2014/15<br />
$000<br />
Balance at 1 July 728 1,355<br />
Additional Provisions Made During the Year 660 663<br />
Debts Written Off During the Period (33) (1,371)<br />
Total provision for doubtful debts 1,355 647<br />
ANNUAL REPORT 2014 2015 81
9. Property, Plant and Equipment<br />
As at 30 June 2015<br />
Cost: $000 Land Buildings<br />
Opening<br />
Balance<br />
Furniture<br />
and<br />
Fittings<br />
Plant,<br />
Equipment<br />
and Comm.<br />
Assets<br />
Motor<br />
Vehicles<br />
Vessels<br />
Capital<br />
Work in<br />
Progress<br />
TOTAL<br />
149,626 574,067 21,734 303,472 141,292 7,761 27,596 1,225,548<br />
Additions – 4,803 250 7,616 27,743 46 24,913 65,371<br />
Revaluation 15,213 34,012 – – – – – 49,225<br />
Reversal of<br />
Depreciation<br />
Relating to<br />
Revaluation<br />
Disposal<br />
and Transfers<br />
Closing<br />
Balance<br />
– (79,606) – – – – – (79,606)<br />
(4,315) 1,276 (37) 11,859 (24,924) (81) (24,008) (40,230)<br />
160,524 534,552 21,947 322,947 144,111 7,726 28,501 1,220,308<br />
Accumulated Depreciation<br />
Opening<br />
Balance<br />
Depreciation<br />
for the Year<br />
Reversal of<br />
Depreciation<br />
Relating to<br />
Revaluation<br />
Disposals<br />
and Transfers<br />
Closing<br />
Balance<br />
Closing<br />
Book Value<br />
– 55,354 16,228 251,639 78,670 3,456 – 405,347<br />
– 28,493 997 16,903 15,229 537 – 62,159<br />
– (79,606) – – – – – (79,606)<br />
– (316) (72) (1,040) (21,265) (69) – (22,762)<br />
– 3,925 17,153 267,502 72,634 3,924 – 365,138<br />
160,524 530,627 4,794 55,445 71,477 3,802 28,501 855,170<br />
82
As at 30 June 2014<br />
Cost $000 Land Buildings<br />
Opening<br />
Balance<br />
Furniture<br />
and<br />
Fittings<br />
Plant,<br />
Equip.,<br />
Computer<br />
and Comm.<br />
assets<br />
Motor<br />
Vehicles<br />
Vessels<br />
Capital<br />
Work in<br />
Progress<br />
TOTAL<br />
167,538 581,199 22,939 295,854 136,015 7,725 72,782 1,284,052<br />
Additions 16 24,288 59 2,631 19,996 36 20,811 67,837<br />
Disposal<br />
and Transfers<br />
Closing<br />
Balance<br />
(17,928) (31,420) (1,264) 4,987 (14,719) – (65,997) (126,341)<br />
149,626 574,067 21,734 303,472 141,292 7,761 27,596 1,225,548<br />
Accumulated Depreciation<br />
Opening<br />
Balance<br />
Depreciation<br />
for the year<br />
Disposals<br />
and Transfers<br />
Closing<br />
Balance<br />
Closing<br />
Book Value<br />
– 85,357 16,454 232,873 74,229 2,910 – 411,823<br />
– 29,968 1,057 19,532 16,539 546 – 67,642<br />
– (59,971) (1,283) (766) (12,098) – – (74,118)<br />
– 55,354 16,228 251,639 78,670 3,456 – 405,347<br />
149,626 518,713 5,506 51,833 62,622 4,305 27,596 820,201<br />
Valuation<br />
Land and buildings were revalued at fair value as at 30 June 2015 by Police and this valuation was<br />
independently certified by Paul Butchers, a registered valuer on behalf of Bayleys Valuations Ltd.<br />
Land<br />
Land is valued at fair value using market-based evidence based on its highest and best use with<br />
reference to comparable land values. Adjustments have been made to the “unencumbered” land<br />
value for land where there is a designation against land, or the use of land is restricted because of<br />
reserve or endowments status. These adjustments are intended to reflect the negative effect on the<br />
value of the land because Police has operational use of the land for the foreseeable future and will<br />
substantially receive the full benefits of outright ownership.<br />
Buildings<br />
Buildings (e.g. residential houses) are also valued at fair value using market-based evidence.<br />
Specialised buildings (e.g. stations) are valued at fair value using depreciated replacement cost<br />
because no reliable market data is available for such buildings.<br />
The revaluation process resulted in a net increase in the value of land and buildings by $49.225<br />
million and has been credited to revaluation reserves accounts. Any impairment losses on the<br />
assets were offset against the balances for the assets in the revaluation reserves account. These<br />
reserves are not available for distribution to the shareholders.<br />
ANNUAL REPORT 2014 2015 83
The aggregate of all such revaluations at 30 June 2015 stand at $51.412 million for Land and<br />
$264.816 million for Buildings. This is after the transfer of $1.959 million to the Taxpayers’ Funds<br />
relating to the assets disposed.<br />
The total amount of Property, Plant and Equipment, including Intangibles, in the course of<br />
construction is $28.501 million (2014: $27.596 million).<br />
The net carrying amount of Office Equipment held under finance lease is $nil (2014: $nil).<br />
No impairment losses have been recognised in 2015 (2014: $nil).<br />
$1.630 million of the ‘disposals and transfers’ represents the value of land at 194 Queen Street,<br />
Richmond which is classified as asset held for sale (see Note 11).<br />
Restrictions to Titles of Non-Current Assets<br />
As at 30 June 2015 land that Police has in possession and use, but for which legal title<br />
is not completely established, amounted to $6.248 million (2014: $5.558 million).<br />
In most cases titles will be established by Gazette Notice, which will formally vest the<br />
titles in Police.<br />
All surplus Land and Buildings are subject to the Crown land disposal process as specified<br />
by the Public Works Act 1981.<br />
10. Intangible Assets – Acquired Software<br />
Actual<br />
2013/14<br />
$000<br />
Actual<br />
2014/15<br />
$000<br />
Cost<br />
Opening Balance 126,887 150,636<br />
Additions 5,528 6,141<br />
Disposals and Transfers 18,221 7,373<br />
Balance at 30 June 150,636 164,150<br />
Accumulated Amortisation and Impairment Losses<br />
Opening Balance 97,350 110,674<br />
Amortisation During the Year 14,831 15,202<br />
Disposals and Transfers (1,507) –<br />
Balance at 30 June 110,674 125,876<br />
Book Value 39,962 38,274<br />
New Zealand Police develops and maintains internally generated software which are classified as<br />
assets under construction and capitalised at the in-service date. Acquired software licenses are<br />
capitalised on the basis of the costs incurred to acquire and bring to use the specific software.<br />
There are no restrictions over the title of the intangible assets, nor are the assets pledged as<br />
security for liabilities.<br />
84
11. Asset Held For Sale<br />
The asset held for sale at 30 June 2015 represents the land at 194 Queen Street, Richmond<br />
valued at $1.630 million that is due to be transferred on 31 July 2015 as part of a settlement<br />
to Ngai Toa.<br />
12. Creditors and Payables<br />
Actual<br />
2013/14<br />
$000<br />
Actual<br />
2014/15<br />
$000<br />
Trade Creditors and Payables 9,746 11,959<br />
PAYE Payable 1 –<br />
GST Payable 9,883 11,934<br />
Unclaimed Salaries and Wages 139 142<br />
Total Accounts Payable 19,769 24,035<br />
Payables are non-interest bearing and are normally settled on 30 days terms; therefore the carrying<br />
value approximates their fair value.<br />
13. Other Accrued Expenses<br />
Actual<br />
2013/14<br />
$000<br />
Actual<br />
2014/15<br />
$000<br />
Sponsorship Reserve 112 441<br />
Accident Compensation and Accredited Employer Programme<br />
Provisions*<br />
10,704 10,436<br />
Other Accrued Expenses 22,630 25,305<br />
Payroll Accruals 31,270 –<br />
Total Other Accrued Expenses 64,716 36,182<br />
* Police self-insures for ACC purposes. An assessment of ongoing costs relating to outstanding claims has been<br />
made by New Zealand Police as at 30 June 2015, resulting in a provision for work-related accidents of $2.816 million<br />
(2014: $2.977 million). These costs are included in the provisions above.<br />
ANNUAL REPORT 2014 2015 85
14. Employee Entitlements<br />
Actual<br />
2013/14<br />
$000<br />
Actual<br />
2014/15<br />
$000<br />
Current Liabilities<br />
<strong>Annual</strong> Leave 115,427 139,998<br />
Long Service Leave 14,601 14,352<br />
Sick Leave 588 483<br />
Shift Leave 14,736 15,783<br />
Other Employee Entitlements* 1,875 3,673<br />
Total Current Portion 147,227 174,289<br />
Non-Current Liabilities<br />
Long Service Leave 150,559 149,410<br />
Sick Leave 3,234 2,335<br />
Total Non-Current Portion 153,793 151,745<br />
Total Employee Entitlements 301,020 326,034<br />
* Personnel disputes that have arisen with a likelihood of settlement have been provided for, along with personnel<br />
settlements payable under collective contract provisions that are unable to be paid until the financial year is complete.<br />
Provision for personnel contract settlements as at 30 June 2015 is $3.673 million (2014 $1.875 million).<br />
An independent actuarial valuation was undertaken by Aon Consulting New Zealand Ltd, as at<br />
30 June 2015 to estimate the present value of long service leave liabilities.<br />
The present value of long service leave obligations depends on a number of factors that are<br />
determined on an actuarial basis using a number of assumptions. Two key assumptions used in<br />
calculating these liabilities are the discount rate and the salary inflation factor. Any changes in<br />
these assumptions will impact on the carrying amount of the liability. The interest rates on<br />
New Zealand Government bonds with terms of maturity that match closely to the estimated future<br />
cash outflows have been considered in determining the discount rate. Historical salary patterns<br />
have been considered in determining the salary inflation factor after obtaining advice from an<br />
independent actuary.<br />
If the salary inflation factor were to increase by 1% from the estimate, with all other factors held<br />
constant, the carrying amount of the liability would increase by $8.683 million. If the salary inflation<br />
factor were to decrease by 1%, the liability would decrease by $7.878 million.<br />
If the discount rates were to increase by 1% from the estimate with all other factors held constant<br />
the carrying amount of the liability would decrease by $8.080 million. If the discount rate were to<br />
decrease by 1%, the liability would increase by $9.100 million.<br />
86
15. Reconciliation of Net Surplus to Net Cash Flow from<br />
Operating Activities<br />
Actual<br />
2013/14<br />
$000<br />
Actual<br />
2014/15<br />
$000<br />
Net Surplus (Deficit) 19,509 2,711<br />
Add (less) Non-Cash items<br />
Depreciation and Amortisation Expense 82,473 77,361<br />
Fixed Asset Write-Offs 3,681 714<br />
Total Non-Cash Items 86,154 78,075<br />
Add (Less) Items classified as Investing Activities<br />
(Gain)/Loss on Disposal of Property, Plant and Equipment 1,899 (786)<br />
Net Investing Activities 1,899 (786)<br />
Add (Less) Movements in Working Capital Items:<br />
Inc/(Dec) in Accounts Payable (17,884) (15,829)<br />
(Inc)/Dec in Accounts Receivable (6,488) 2,891<br />
Inc/(Dec) in Employee Entitlements 9,361 25,014<br />
(Inc)/Dec in Debtor Crown 38,291 (26,473)<br />
(Inc)/Dec in Inventories 13 (11)<br />
(Inc)/Dec in Prepayments 544 (2,985)<br />
Inc/(Dec) in Other Accrued Expenses (4,102) (28,534)<br />
Net Working Capital Movements 19,735 (45,927)<br />
Net Cash Flows from Operating Activities 127,297 34,073<br />
16. Related Party Transactions<br />
Police is a wholly owned entity of the Crown. The Government is the major source of revenue.<br />
Police entered into numerous transactions with other government departments, Crown agencies<br />
and State-Owned Enterprises on an arm’s length basis. Where these parties are acting in the<br />
course of their normal dealings with Police, related party disclosures have not been made.<br />
ANNUAL REPORT 2014 2015 87
17. Key Management Personnel Compensation<br />
Actual<br />
2013/14<br />
$000<br />
Actual<br />
2014/15<br />
$000<br />
Salaries and Other Short Term Employee Benefits 3,607 2,994<br />
Other Long-Term Benefits 802 727<br />
Termination Benefits 335 282<br />
Total Compensation 4,744 4,003<br />
Number of Full Time Equivalents 9 9<br />
Key Management personnel comprises the Commissioner, Deputy Commissioners and Deputy Chief Executives.<br />
18. Financial Risks<br />
Police’s activities expose it to a variety of financial risks, including market risk, credit risk and<br />
liquidity risk. Police has a series of policies to manage the risks associated with financial<br />
instruments and seeks to minimise exposure from financial instruments. These policies do not<br />
allow any transactions that are speculative in nature to be entered into.<br />
Market Risk<br />
Currency Risk<br />
Currency risk is the risk that the fair value or future cash flows of a financial instrument will fluctuate<br />
because of changes in foreign exchange rates.<br />
Police’s foreign exchange management policy requires management of currency risk arising from<br />
future transactions and recognised liabilities by entering into foreign exchange forward contracts to<br />
hedge the entire foreign currency risk exposure. This policy has been approved by the Treasury and<br />
is in accordance with the requirements of the Treasury guidelines for the Management of Crown<br />
and Departmental Foreign-Exchange Exposure.<br />
Credit Risk<br />
Credit risk is the risk that a third party will default on its obligation to the Police, causing Police to<br />
incur a loss.<br />
Police is only permitted to deposit funds with Westpac, a registered bank, and enter into foreign<br />
exchange forward contracts with Westpac or the New Zealand Debt Management Office. These<br />
entities have high credit ratings. For its other financial instruments Police does not have significant<br />
concentrations of credit risk.<br />
Police’s maximum exposure for each class of financial instrument is represented by the total<br />
carrying amount of cash and cash equivalents and net debtors. There is no collateral held as<br />
security against these financial instruments, including those instruments that are overdue or<br />
impaired.<br />
Liquidity Risk<br />
Liquidity risk is the risk that Police will encounter difficulty raising liquid funds to meet commitments<br />
as they fall due.<br />
88
In meeting its liquidity requirements Police closely monitors its forecast cash requirements with<br />
expected cash draw downs from the New Zealand Debt Management Office. Police maintains a<br />
target level of available cash to meet its liquidity requirements.<br />
The following table reflects all contractual payments resulting from recognised financial liabilities<br />
as of 30 June 2015. For the other obligations the respective undiscounted cash flows for the<br />
respective upcoming fiscal years are presented. The timing of cash flows for liabilities is based on<br />
the contractual terms of the underlying contract. However, where the counterparty has a choice<br />
of when the amount is paid, the liability is allocated to the earliest period in which Police can<br />
be required to pay. When Police is committed to make amounts available in instalments, each<br />
instalment is allocated to the earliest period in which Police is required to pay.<br />
Less than<br />
6 Months<br />
$000<br />
Between<br />
6 Months to<br />
1 Year<br />
$000<br />
Between<br />
1 year and<br />
5 Years<br />
$000<br />
Over<br />
5 Years<br />
$000<br />
Total<br />
$000<br />
2015<br />
Creditors and Payables 10,702 19 1,238 – 11,959<br />
2014<br />
Creditors and Payables 8,926 27 793 – 9,746<br />
19. Categories of Financial Instruments<br />
The carrying amounts of financial assets and financial liabilities in each of the PBE IPSAS 29<br />
categories are as follows:<br />
Actual<br />
2014<br />
$000<br />
Actual<br />
2015<br />
$000<br />
Loans and Receivables<br />
Cash and Cash Equivalents 64,827 23,313<br />
Accounts Receivable (Note 8) 267,146 290,728<br />
Total Loans and Receivables 331,973 314,041<br />
Financial Liabilities Measured at Amortised Cost<br />
Creditors and Payables 9,746 11,959<br />
Total Financial Liabilities 9,746 11,959<br />
20. Post Balance Date Events<br />
There were no significant events subsequent to balance date that had a material impact on the<br />
financial statements (2014: $nil).<br />
ANNUAL REPORT 2014 2015 89
NON-DEPARTMENTAL<br />
STATEMENT OF COMPLIANCE<br />
These financial statements have been prepared in accordance with New Zealand generally<br />
accepted accounting practice (NZ GAAP).<br />
These financial statements have been prepared in accordance with Tier 1 PBE accounting<br />
standards.<br />
These financial statements are the first financial statements presented in accordance with the<br />
new PBE accounting standards.<br />
These financial statements comply with PBE accountings standards.<br />
Other than changes in terminology and presentation to the financial statements, there have been<br />
no material adjustments arising on transition to the new PBE accounting standards.<br />
These non-departmental balances are consolidated into the Crown Financial Statements.<br />
For a full understanding of the Crown’s financial position and the results of its operations for the<br />
period, reference should be made to the consolidated Financial Statements for the Government<br />
for the year ended 30 June 2015.<br />
Non-departmental accounting policies are consistent with departmental accounting policies.<br />
SCHEDULE OF REVENUE<br />
AND EXPENSES<br />
for the Year Ended 30 June 2015<br />
Actual<br />
2013/14<br />
$000<br />
Actual<br />
2014/15<br />
$000<br />
Main<br />
Estimates<br />
2014/15<br />
$000<br />
Supplementary<br />
Estimates<br />
2014/15<br />
$000<br />
Revenue<br />
Non-Tax Revenue:<br />
Infringement Fees 86,608 86,396 70,900 85,900<br />
Sale of Unclaimed Property 153 178 400 400<br />
Crown Revenue 100 100 100 100<br />
Forfeit to Crown 105 28 – –<br />
Investment Income 18 – – –<br />
Total Non-Departmental Revenue 86,984 86,702 71,400 86,400<br />
Expenses<br />
United Nations Drug Control Programme 100 100 100 100<br />
Total Non-Departmental Expenses 100 100 100 100<br />
Net Surplus 86,884 86,602 71,300 86,300<br />
90
SCHEDULE OF ASSETS AND LIABILITIES<br />
as at 30 June 2015<br />
Actual<br />
2013/14<br />
$000<br />
Actual<br />
2014/15<br />
$000<br />
Main<br />
Estimates<br />
2014/15<br />
$000<br />
Supplementary<br />
Estimates<br />
2014/15<br />
$000<br />
Current Assets<br />
Cash 3,579 9,072 1,921 3,479<br />
Accounts Receivable 15,741 15,645 14,878 15,661<br />
Total Non-Departmental Assets 19,320 24,717 16,799 19,140<br />
Accounts Payable 184 86 – 4<br />
Funds Held on Behalf of Crown 19,136 24,631 16,799 19,136<br />
Total Non-Departmental Liabilities 19,320 24,717 16,799 19,140<br />
ANNUAL REPORT 2014 2015 91
Chartered Accountants<br />
TO THE READERS OF<br />
NEW ZEALAND POLICE’S<br />
ANNUAL REPORT FOR THE YEAR ENDED 30 JUNE 2015<br />
The Auditor-General is the auditor of New Zealand Police (the Department). The Auditor-General has appointed me,<br />
Marcus Henry, using the staff and resources of Ernst & Young, to carry out the audit on her behalf of:<br />
- the financial statements of the Department on pages 59 to 89, that comprise the statement of financial position,<br />
statement of contingent liabilities and contingent assets and statement of commitments as at 30 June 2015,<br />
the statement of appropriations, statement of comprehensive revenue and expenses, statement of movements<br />
in taxpayers’ funds, statement of cash flows and statement of unappropriated expenditure for the year ended<br />
on that date and the notes to the financial statements that include accounting policies and other explanatory<br />
information;<br />
- the performance information prepared by the Department for the year ended 30 June 2015 on pages 5 to 33<br />
and 35 to 58; and<br />
- the schedules of non-departmental activities which are managed by the Department on behalf of the Crown on<br />
pages 75 and 90 to 91 that comprise:<br />
- schedule of assets and liabilities as at 30 June 2015;<br />
- the schedule of revenue and expenses for the year ended on that date;<br />
- the statement of trust monies for the year ended 30 June 2015; and<br />
- the notes to the schedules that include accounting policies and other explanatory information.<br />
Opinion<br />
In our opinion:<br />
- the financial statements of the Department:<br />
- present fairly, in all material respects:<br />
- its financial position as at 30 June 2015; and<br />
- its financial performance and cash flows for the year ended on that date;<br />
- comply with generally accepted accounting practice in New Zealand and have been prepared in<br />
accordance with Public Benefit Entity <strong>Report</strong>ing Standards’.<br />
- the performance information of the Department:<br />
- presents fairly, in all material respects, for the year ended 30 June 2015:<br />
- what has been achieved with the appropriation; and<br />
- the actual expenses or capital expenditure incurred compared with the appropriated or forecast<br />
expenses or capital expenditure;<br />
- complies with generally accepted accounting practice in New Zealand.<br />
- the schedules of non-departmental activities which are managed by the Department on behalf of the Crown on<br />
pages 75 and 90 to 91 present fairly, in all material respects, in accordance with the Treasury Instructions:<br />
- the assets; liabilities; expenses; and revenue for the year ended 30 June 2015; and<br />
- the statement of trust monies for the year ended 30 June 2015.<br />
Our audit was completed on 30 September 2015. This is the date at which our opinion is expressed.<br />
The basis of our opinion is explained below. In addition, we outline the responsibilities of the Commissioner and our<br />
responsibilities, and we explain our independence.<br />
Basis of opinion<br />
We carried out our audit in accordance with the Auditor-General’s Auditing Standards, which incorporate the<br />
International Standards on Auditing (New Zealand). Those standards require that we comply with ethical<br />
requirements and plan and carry out our audit to obtain reasonable assurance about whether the information we<br />
audited is free from material misstatement.<br />
92<br />
A member firm of Ernst & Young Global Limited
Material misstatements are differences or omissions of amounts and disclosures that, in our judgement, are likely to<br />
influence readers’ overall understanding of the information we audited. If we had found material misstatements that<br />
were not corrected, we would have referred to them in our opinion.<br />
An audit involves carrying out procedures to obtain audit evidence about the amounts and disclosures in the<br />
information we audited. The procedures selected depend on our judgement, including our assessment of risks of<br />
material misstatement of the information we audited, whether due to fraud or error. In making those risk<br />
assessments, we consider internal control relevant to the Department’s preparation of the information we audited in<br />
order to design audit procedures that are appropriate in the circumstances, but not for the purpose of expressing an<br />
opinion on the effectiveness of the Department’s internal control.<br />
An audit also involves evaluating:<br />
- the appropriateness of accounting policies used and whether they have been consistently applied;<br />
- the reasonableness of the significant accounting estimates and judgements made by the Commissioner;<br />
- the appropriateness of the reported performance information within the Department’s framework for reporting<br />
performance;<br />
- the adequacy of the disclosures in the information we audited; and<br />
- the overall presentation of the information we audited.<br />
We did not examine every transaction, nor do we guarantee complete accuracy of the information we audited. Also,<br />
we did not evaluate the security and controls over the electronic publication of the information we audited.<br />
We believe we have obtained sufficient and appropriate audit evidence to provide a basis for our audit opinion.<br />
Responsibilities of the Commissioner<br />
The Commissioner is responsible for preparing:<br />
- financial statements that present fairly the Department’s financial position, financial performance, and its cash<br />
flows, and that comply with generally accepted accounting practice in New Zealand.<br />
- performance information that presents fairly what has been achieved with each appropriation, the expenditure<br />
incurred as compared with expenditure expected to be incurred, and that complies with generally accepted<br />
accounting practice in New Zealand.<br />
- statements of expenses and capital expenditure of the Department, that are presented fairly, in accordance<br />
with the requirements of the Public Finance Act 1989.<br />
- schedules of non-departmental activities, in accordance with the Treasury Instructions, that present fairly those<br />
activities managed by the Department on behalf of the Crown.<br />
The Commissioner’s responsibilities arise from the Public Finance Act 1989.<br />
The Commissioner is responsible for such internal control as is determined is necessary to ensure that the annual<br />
report is free from material misstatement, whether due to fraud or error. The Commissioner is also responsible for<br />
the publication of the annual report, whether in printed or electronic form.<br />
Responsibilities of the Auditor<br />
We are responsible for expressing an independent opinion on the information we are required to audit, and reporting<br />
that opinion to you based on our audit. Our responsibility arises from the Public Audit Act 2001.<br />
Independence<br />
When carrying out the audit, we followed the independence requirements of the Auditor-General, which incorporate<br />
the independence requirements of the External <strong>Report</strong>ing Board.<br />
In addition to the audit we have carried out assignments in the areas of remuneration benchmarking, which are<br />
compatible with those independence requirements. Other than the audit and these assignments, we have no<br />
relationship with or interests in Police.<br />
Marcus Henry<br />
Ernst & Young<br />
On behalf of the Auditor-General<br />
Wellington, New Zealand<br />
A member firm of Ernst & Young Global Limited<br />
ANNUAL REPORT 2014 2015 93
6 FORECAST FINANCIAL STATEMENTS<br />
FOR THE YEAR ENDING 30 JUNE 2016<br />
STATEMENT OF COMPREHENSIVE<br />
REVENUE AND EXPENSES<br />
for the Year Ending 30 June 2016<br />
Note<br />
Forecast<br />
2015/16<br />
$000<br />
Revenue<br />
Crown 1,497,237<br />
Other Revenue 25,226<br />
Interest –<br />
Total Revenue 1 1,522,463<br />
Expenditure<br />
Personnel 1,146,845<br />
Operating 230,867<br />
Depreciation and Amortisation Expenses 81,821<br />
Capital Charge 62,930<br />
Total Operating Expenses 1,522,463<br />
Surplus (Deficit) from Outputs –<br />
Revaluation of Land and Buildings –<br />
Other Comprehensive Income –<br />
Total Comprehensive Income –<br />
94
STATEMENT OF FINANCIAL POSITION<br />
as at 30 June 2016<br />
Forecast<br />
2015/16<br />
$000<br />
Assets<br />
Current Assets<br />
Cash 30,000<br />
Accounts Receivable 290,495<br />
Prepayments 6,201<br />
Inventories 48<br />
Assets Held for Sale –<br />
Total Current Assets 326,744<br />
Non-Current Assets<br />
Property, Plant and Equipment 874,114<br />
Intangibles –<br />
Total Non-Current Assets 874,114<br />
Total Assets 1,200,858<br />
Liabilities<br />
Current Liabilities<br />
Creditors and Payables 41,821<br />
Accrued Expenses 59,231<br />
Employee Entitlements 164,904<br />
Provision for Repayment of Surplus to the Crown –<br />
Total Current Liabilities 265,956<br />
Non-Current Liabilities<br />
Employee Entitlements 153,793<br />
Total Non-Current Liabilities 153,793<br />
Total Liabilities 419,749<br />
Net Assets 781,109<br />
Taxpayers’ Funds<br />
General Funds 514,247<br />
Property, Plant and Equipment Revaluation Reserves 266,862<br />
Total Taxpayers’ Funds 781,109<br />
ANNUAL REPORT 2014 2015 95
STATEMENT OF CASH FLOWS<br />
for the Year Ended 30 June 2016<br />
Forecast<br />
2015/16<br />
$000<br />
Cash Flows from Operating Activities<br />
Cash provided from:<br />
Supply of Outputs to:<br />
- Crown 1,511,167<br />
- Others 23,347<br />
1,534,514<br />
Cash was applied to:<br />
Produce Outputs:<br />
- Personnel (1,156,325)<br />
- Operating (231,611)<br />
- Capital Charge (62,930)<br />
(1,450,866)<br />
Net Cash Flows from Operating Activities 83,648<br />
Cash Flows from Investing Activities<br />
Cash provided from:<br />
Sale of Non-Current Assets 2,780<br />
Cash was applied to:<br />
Purchase of Property, Plant and Equipment (72,886)<br />
Purchase of Intangible Assets (13,542)<br />
Net Cash Flows from Investing Activities (83,648)<br />
Net Cash Flows from Financing Activities –<br />
Net Increase (Decrease) in Cash Held –<br />
Add Opening Cash 30,000<br />
Closing Cash as at 30 June 30,000<br />
Cash Balance Consists of<br />
Cash at Bank 28,830<br />
Petty Cash 820<br />
Overseas Posts 350<br />
Total Cash 30,000<br />
96
NOTE 1 TO FORECAST FINANCIAL<br />
STATEMENTS<br />
Total Revenue<br />
The table below summarises the key changes in revenue between the financial years 2014/15<br />
and 2015/16:<br />
2014/15 Appropriation (BEFU) 1,528,470<br />
$000<br />
Increase/(Decrease) in Funding:<br />
Justice Sector Funding in 2014/15 – reversed (40,752)<br />
Speed Camera Funding from Ministry of Transport – reversed (10,000)<br />
New funding for Personnel Costs 41,000<br />
Criminal Procedure Act 2011 Implementation Plan Funding 2,038<br />
Child Protection Offender Register and Risk Management Framework Funding 1,325<br />
Minor Adjustments Across Several Initiatives 382<br />
2015/16 Appropriation (BEFU) – Total Revenue 1,522,463<br />
The appropriation by output class is included in the table below:<br />
Output Class $000<br />
General Crime Prevention Services 161,157<br />
Specific Crime Prevention Services and Maintenance of Public Order 154,682<br />
Police Primary Response Management 396,674<br />
Investigations 378,195<br />
Case Resolution and Support to Judicial Process 123,456<br />
Road Safety Programme 305,067<br />
Policy Advice and Ministerial Services MCOA 3,232<br />
2015/16 Appropriation (BEFU) – Total Revenue 1,522,463<br />
ANNUAL REPORT 2014 2015 97
APPENDIX 1: POLICING EXCELLENCE:<br />
THE FUTURE<br />
As well as marking the end of 2013/14, 30 June 2014 marked the closure of Policing Excellence,<br />
our strategic change programme that we started in 2009.<br />
Policing Excellence set a very high bar for whatever came after it. The results were hard won, and<br />
we have gained the maximum benefit from the initiatives it contained. As a result we put a great<br />
deal of effort into planning the next phase of Policing Excellence, Policing Excellence: the Future.<br />
Work Undertaken to Identify and Develop Policing Excellence:<br />
the Future Options<br />
Police initiated a formal programme to develop Policing Excellence: the Future, which comprised<br />
five components:<br />
––<br />
the Police ‘Know Your Business Model’<br />
––<br />
understanding demand pressures and opportunities to interrupt or prevent demand<br />
––<br />
understanding cost pressures and opportunities to mitigate those pressures<br />
––<br />
engaging partners at the governance and investment level<br />
––<br />
engaging the frontline and partners to harness innovative ideas<br />
Police ‘Know Your Business’ Model<br />
The ‘Know Your Business’ model provides Police with an in-depth understanding of its cost and<br />
value drivers. To provide clarity on the key functions and activities undertaken by Police it uses<br />
40 core activities spread across the four pillars of the Police operating model:<br />
––<br />
Prevention<br />
––<br />
Response<br />
––<br />
Investigation<br />
––<br />
Resolution<br />
The 40 core activities within the ‘Know Your Business’ model were assigned attributes of cost,<br />
performance, and value using Multi Criteria Decision Analysis. The results enabled Police to<br />
have a clear understanding of where it spends its money; the performance and outcomes this<br />
generates and the relative value of each activity. They also enabled Police to categorise the<br />
activities and focus on opportunities for efficiency gains, service improvements and more customer<br />
focused activities.<br />
Understanding Demand Pressures and Opportunities to Interrupt and Prevent Demand<br />
While crime has fallen, demand for many policing services has increased, and some types of<br />
incident take more time to resolve than others. For example, domestic disputes have increased<br />
67% during the last four years, and while they represent 15% of 111 calls they consume over<br />
40% of frontline officers’ time. Through research and evaluation Police is now in a better position<br />
to reduce that demand through preventing re-offending and re-victimisation.<br />
A major impact on Police demand is the continued over-representation of Māori in the justice<br />
system, as both victims and offends. Māori remain the most victimised social group in<br />
New Zealand, represented in 46% of Police apprehensions; more than 50% of Police prosecutions;<br />
98
60% of Youth Court appearances 7 ; and more than 50% of the prison population. Māori are also<br />
over-represented in road fatalities, suicide and self-harm incidents. 8 Disparities in criminal justice<br />
outcomes between Māori and non-Māori are growing. Police has forged effective partnerships<br />
with a number of iwi and has had success with a number of joint initiatives. There is a significant<br />
opportunity to work with iwi to progressively scale up this approach across the country, and grow<br />
the evidence base of ‘what works’.<br />
We have also seen significant growth in demand for Police attendance in response to people<br />
suffering from acute mental health issues, attempted suicides and missing persons. Police is<br />
working with the Ministry of Health and the Independent Police Conduct Authority to ensure this<br />
demand is better managed and channelled.<br />
Police has seen rising demand from emerging crime types such as cybercrime, human and drug<br />
trafficking, child grooming, online radicalisation, organised crime, identity theft and other fraud<br />
offences. Much of this growing demand is not fully captured in existing crime statistics and is often<br />
relatively ‘invisible’ to communities. Such cases are often difficult to detect and complex to resolve–<br />
for example cyber and other online offences can span multiple jurisdictions and crime may be<br />
committed in New Zealand without offenders ever setting foot here. To stay ahead of this demand<br />
Police is developing new intelligence and investigative capabilities, reallocating resources and<br />
building effective international partnerships.<br />
Understanding Cost Pressures and Opportunities to Mitigate Those Pressures<br />
Police is already lean and efficient. Police is one of the most cost-efficient government agencies 9<br />
and has absorbed more than $300m in cost pressures in the last five years. The Police employee<br />
to population ratio in New Zealand is low in comparison to most similar overseas jurisdictions. 10<br />
But, with upfront investment, Police believes there are opportunities to do even better by dealing<br />
with rising and changing demand, while reducing the impact of cost pressures.<br />
Through Policing Excellence: the Future we have identified potential savings stemming from a<br />
new service delivery model, which includes centralisation of some core ‘back office’ functions,<br />
rationalising common functions across the Greater Auckland region and making better use of<br />
outsourcing. All these changes are designed to improve operational effectiveness as well as<br />
reduce costs.<br />
Police is also exploring options to mitigate cost pressures by funding specific activities from<br />
external sources in situations where Police undertakes or manages activities on behalf of others,<br />
or where the benefits are primarily to the customer, e.g. vetting.<br />
Engaging Partners at the Governance and Investment Level<br />
Partner organisations from the public sector and non-governmental sector were fully engaged in<br />
the development of Policing Excellence: the Future and its governance. Senior representatives<br />
from Treasury, the State Services Commission, the Department of the Prime Minister and Cabinet,<br />
the New Zealand Transport Agency, the Commissioner’s Māori Focus Forum, Victim Support, the<br />
Ministry of Justice, the Department of Corrections, Child, Youth and Family, the Ministry of Health,<br />
and Inland Revenue (IRD) all contributed.<br />
7 http://nzdotstat.stats.govt.nz/wbos/Index.aspx<br />
8 http://www.stats.govt.nz/browse_for_stats/people_and_communities/crime_and_justice.aspx<br />
9 BASS Master Data Repository for 2013/14 Financial Year based on cost per FTE of administrative and support services<br />
(includes HR, Finance, ICT, Procurement and Corporate & Executive Services).<br />
10 HMIC Crime and Policing Comparator, https://www.justiceinspectorates.gov.uk/hmic/crime-and-policing-comparator/<br />
ANNUAL REPORT 2014 2015 99
Engaging the Frontline and Partners to Harness Innovative Ideas<br />
Reflecting the views of frontline staff from Police and partner agencies was critical to developing<br />
ideas for the future of policing. Frontline input was provided through 39 ‘idea generation’<br />
workshops across the country. The workshops involved 600 Police employees; and government<br />
and non-government representatives (including workshops run jointly with the Ministry of Justice<br />
and Department of Corrections). Some 4,400 ideas were generated, which were distilled into the<br />
four themes of Policing Excellence: the Future should be:<br />
––<br />
Safer Families – reducing harm in families<br />
––<br />
Iwi Partnerships – reducing the over-representation of Māori in the criminal justice system<br />
––<br />
Evidence Based Policing – equipping frontline staff with the information they need to make the<br />
right decision at the right time<br />
––<br />
Service Delivery Model – freeing up resources from back and middle office functions to redeploy<br />
to the frontline to target harm in families and the over-representation of Māori.<br />
100
Focus Area 1: Safer Families<br />
Dysfunctional conditions within a family, such as conflict, criminality, violence, neglect, substance<br />
abuse and mental illness cause harm in our communities and cost New Zealand an estimated<br />
$9 billion per year. In 2013:<br />
––<br />
50% of victims experienced two or more violent interpersonal offences by a family member<br />
––<br />
1% of adults experienced 62% of violent interpersonal offences by family members<br />
––<br />
76% of violent interpersonal offences committed by a family member went unreported to Police<br />
with ‘too trivial/no loss/not worth reporting/unsuccessful attempt’ and ‘private/dealt with matter<br />
on own’ given as the most common reasons for not reporting. 11<br />
It can take many occurrences before victims seek help. Police is one part of a multi-agency<br />
response to this problem, traditionally focusing on the first response.<br />
Multi-agency effort has been constrained by disparate strategies, processes, and interventions;<br />
and the challenge of dealing with issues across generations. The Safer Families theme will require<br />
Police to work closely with its partners to consider the family as a whole, recognising that focus on<br />
specific issues in isolation may only produce temporary results.<br />
What Police want to achieve How Police will achieve this In conjunction with partners<br />
Police – in conjunction with<br />
local partners – will:<br />
• use better information to<br />
reduce harm in families<br />
and prioritise so that our<br />
resources are focused<br />
on the most vulnerable<br />
families<br />
• focus on intergenerational<br />
crime and intervene to<br />
break the cycle<br />
Redeploy sworn staff into Safer<br />
Families frontline roles.<br />
Share information and intelligence<br />
with partner agencies to<br />
support early identification, early<br />
intervention and harm prevention.<br />
It will also allow us to improve the<br />
allocation of our resources directed<br />
to reducing harm in vulnerable<br />
families.<br />
Scale up the Gang Intelligence<br />
Centre.<br />
Deepen local partnership<br />
structures: e.g. co-location, joint<br />
tasking and coordination, targeted<br />
deployment.<br />
Extra investigative capability to<br />
hold perpetrators to account.<br />
Link to existing strategies<br />
e.g. Cross-Government Family<br />
Violence and Sexual Violence Work<br />
Programme; Whole of Government<br />
Gang Action Plan, Children’s<br />
Action Plan, Youth Crime Action<br />
Plan, E Tu Whānau, and Whānau<br />
Ora.<br />
Use ‘big data’ to more effectively<br />
target interventions.<br />
Multi-agency approach–build on<br />
successes of current initiatives<br />
e.g. Social Sector Trials, Children’s<br />
Teams, Neighbourhood Policing<br />
Teams.<br />
Encourage community<br />
participation and partnership.<br />
11 The New Zealand Crime and Safety Survey (NZCASS) 2014, Ministry of Justice<br />
ANNUAL REPORT 2014 2015 101
Focus Area 2: Iwi Partnerships<br />
Police apprehensions and prosecutions of Māori are not declining as fast as they are for non-Māori.<br />
As a result, disparities in criminal justice outcomes between Māori, and non-Māori are growing.<br />
The Police and Māori partnerships theme is based on He waka eke noa – “A canoe which we are<br />
all in with no exception”.<br />
Ninety percent of people who identify as Māori know their iwi and value cultural connectedness<br />
of some kind in their day-to-day lives (2013 census). Purposeful partnerships with iwi/Māori have<br />
the potential to create opportunities for Māori to stay out of the criminal justice system. Together<br />
we will build on our joint strategy The Turning of the Tide to jointly develop new initiatives that will<br />
positively impact the over-representation of Māori in the criminal justice system both now and in<br />
the long term.<br />
What Police want to achieve How Police will achieve this In conjunction with partners<br />
Increase Māori trust and<br />
confidence.<br />
Prevent Māori reoffending.<br />
Prevent Māori re-victimisation.<br />
Prevent Māori being in fatal<br />
and serious crashes.<br />
Reduce disparity between<br />
Māori and non-Māori<br />
in offering of alternative<br />
resolutions.<br />
Redeploy sworn staff into Iwi<br />
Partnership frontline roles.<br />
Increase the range of options for<br />
alternative action as a means to<br />
keeping Māori Youth (Rangatahi) out<br />
of court.<br />
At a District level analyse, share and<br />
act on iwi-specific intelligence.<br />
Raise Police’s Māori cultural capacity<br />
and capability through mindset shift,<br />
training, recruitment.<br />
With iwi, develop a Policeiwi<br />
Partnership Model that<br />
incorporates the expectations<br />
and needs of iwi.<br />
With iwi and other partners,<br />
establish innovation hubs to<br />
target and prevent reoffending<br />
and re-victimisation.<br />
Increase use of alternative<br />
resolutions (e.g. iwi Alternative<br />
Resolution panels).<br />
Link to existing strategies.<br />
102
Focus Area 3: Evidence Based Policing<br />
Every minute, every hour Police face decisions about what tactics to use and how best to deploy<br />
staff and resources. We know from Prevention First when we understand the crime problem and<br />
know what tactics work, then we make sound decisions that lead to good outcomes. However,<br />
there are gaps in both our understanding of crime problems and our knowledge of what tactics<br />
yield positive, negative or no benefits.<br />
The evidence based policing theme is about informing decision makers about proven approaches<br />
and tactics in a given situation. Evidence based policing requires testing how effective our actions<br />
and approaches are, and making modifications when the evidence shows there is a better way,<br />
including leveraging partner contributions, data, and implementing cross-agency solutions<br />
where needed.<br />
What Police want to achieve How Police will achieve this In conjunction with partners<br />
Transforming and aligning<br />
deployment at strategic, operational<br />
and tactical levels through:<br />
• use of advanced analytics<br />
and big data to support<br />
decision-making<br />
• knowledge and research<br />
informing deployment<br />
• leveraging technology<br />
advancements<br />
• ensuring organisational alignment<br />
and validity of tactics through<br />
command assessments and<br />
tactical plans.<br />
Empower commanders and<br />
decision-makers through the<br />
deployment profile and decision<br />
support tools.<br />
Embed the Centre for Police<br />
Research.<br />
Build up Police’s Good Practice<br />
Index.<br />
Establish systematic links between<br />
the Police College, Continuous<br />
Improvement, and Lessons Learned<br />
to ensure transfer of knowledge.<br />
“Power few” leaders/analysts to<br />
complete advanced studies.<br />
Link to domestic partners<br />
e.g. universities.<br />
Link to international peers.<br />
ANNUAL REPORT 2014 2015 103
Focus Area 4: Service Delivery Model<br />
Policing Excellence demonstrated that changes to components of the service delivery model can<br />
have a significant impact on crime. While crime reduction has been achieved, these gains are at<br />
risk if we do not continue to improve our service delivery model.<br />
Policing Excellence provided a strong platform on which to build through its Crime <strong>Report</strong>ing<br />
Line and Mobility workstreams. By migrating core processes to mobile devices we will increase<br />
the productivity of our staff enabling them to spend more time with people that really need our<br />
assistance. We intend to make more services available through digital channels and others easily<br />
accessible to ensure we meet New Zealanders’ demand for our services.<br />
What Police want to achieve How Police will achieve this In conjunction with partners<br />
A Service Delivery Model that fully<br />
reflects:<br />
• our goal of meeting the complex<br />
needs of victims, witnesses and<br />
users of our services<br />
• the Police deployment model<br />
• increased demand for digital<br />
transactions and integration<br />
across government<br />
• effective and efficient delivery<br />
of primary responsibilities and<br />
functions.<br />
Expand the use of mobile<br />
technology to enable frontline staff<br />
to be “more street than station.”<br />
Supporting investigators with<br />
improved technology to reduce<br />
paperwork and enabling them<br />
to spend more time supporting<br />
victims and witnesses.<br />
Review high volume processing<br />
functions to ensure they are set up<br />
to provide effective and efficient<br />
support to the frontline.<br />
Consistent and customer oriented<br />
services.<br />
Leverage capability in<br />
strategically important areas<br />
such as the Auckland ‘Super<br />
City’ – growing in size, scale<br />
and complexity.<br />
Provide a more effective and<br />
efficient response to mental<br />
health emergencies with the<br />
Ministry of Health.<br />
Work with partners in the<br />
Security and Intelligence<br />
Sector to address emerging<br />
threats.<br />
104
APPENDIX 2: HOW WE MEET<br />
GOVERNMENT PRIORITIES<br />
Over the course of 2014/15 Police is focused on the things that matter to New Zealanders.<br />
Our strategic direction supports the Government’s aims, in particular the Better Public Services<br />
targets of:<br />
––<br />
Reducing the number of children experiencing physical abuse by 5%<br />
––<br />
Reducing the total crime rate by 20%<br />
––<br />
Reducing the violent crime rate by 20%<br />
––<br />
Reducing the youth crime rate by 25%<br />
––<br />
Reducing reoffending by 25%. 12<br />
Assaults on children<br />
Since 2011 levels of child physical abuse findings have stabilised and even slightly declined.<br />
During 2014/15 3,118 children experienced substantiated physical abuse. This was a 1.9%<br />
decrease on 2013/14 (3,178 findings). It is also equivalent to an age-adjusted population rate<br />
of 2.81 children out of 1000 compared to 2.87 in 2013/14, a decrease of 2.3 percent.<br />
However, there are still far too many children being abused and neglected each year, and we<br />
need to continue to make progress. Police is working with other government agencies to prevent<br />
maltreatment, including work to:<br />
––<br />
address the factors that place children at risk of abuse, through a improving support to<br />
families and whānau, and making referrals to agencies and non-governmental organisations<br />
that can provide assistance to address broader risk factors such as material hardship, benefit<br />
dependency, housing-related stress and family violence<br />
––<br />
support children identified as at risk of abuse, through key actions in the Children’s Action Plan<br />
and Ministerial Work Programme on Family and Sexual Violence and Gangs Action Plan<br />
––<br />
better respond to children who have been abused, through the Commissioner’s role on the<br />
Child, Youth and Family (CYF) Expert Panel, which is considering options for a new operating<br />
model for CYF.<br />
Alongside the Chief Executives of the Ministries of Social Development, Health, Education, Justice<br />
and Business, Innovation and Employment and Te Puni Kōkiri the Commissioner is a member of<br />
the cross-government Vulnerable Children’s Board, which oversees the delivery of the Children’s<br />
Action Plan. Police is key to the successful delivery of the Action Plan, notably we are vetting large<br />
numbers of adults that work directly with children. We saw a 7.7% increase in the number<br />
of applications for vetting in 2014/15 and expect to see further increases in 2015/16.<br />
During 2014/15 Police revised its child protection policy to comply with the new requirements of<br />
the Vulnerable Children’s Act 2014. We are continuing to work closely with CYF and Children’s<br />
Teams to provide support to children whose care and protection has been compromised, often<br />
through being present at family violence incidents.<br />
12 For achievement by June 2017 compared to 2011 figures with the exception of the target for total crime which is to be<br />
achieved by June 2018 compared to 2011 figures.<br />
ANNUAL REPORT 2014 2015 105
Substantial physical abuse findings<br />
4,000<br />
Original forecast (4,049)<br />
3,000<br />
2,000<br />
Latest actual results –<br />
June 2015 (3,118)<br />
2017 BPS<br />
Target<br />
(2,936)<br />
1,000<br />
0<br />
2005 2006 2007 2008 2009 2010 2011 2012 2013 2014 2015 2016 2017<br />
Total crime<br />
Police has continued to focus on reducing the crime rate through its operating strategy, Prevention<br />
First, which puts prevention at the front of everything we do. Police has adopted the Better Public<br />
Services measure of the total crime rate as its headline measure for the outcome ‘Less Crime’,<br />
which is reported on in section 1 above.<br />
Total crime rate<br />
Per 10,000 population<br />
1,200<br />
800<br />
Target<br />
400<br />
0<br />
2010 2011 2012 2013 2014 2015 2016 2017 2018<br />
106
Violent crime<br />
Violent crime is a scourge on our communities and causes emotional, physical, economic and<br />
social harm. It is estimated that alcohol has a part to play in approximately half of all violent crimes.<br />
In Prevention First Police identified alcohol as one of its drivers of crime. We have continued to<br />
work with partners and the entertainment and hospitality industries to reduce alcohol related<br />
harm. Notably we have sought to reduce public place violence through visible patrolling at high<br />
risk times and locations, and conducting targeted licensed premises compliance checks, including<br />
operations to ensure alcohol does not fall into the hands of minors.<br />
A further half of violent crime, which overlaps with that where alcohol is a contributing factor, is<br />
accounted for by family violence. Police is often the first responder to a report of family violence,<br />
and our focus when attending is to ensure the immediate safety of the victims and prevent<br />
revictimisation. We are working closely with other government agencies and non-governmental<br />
organisations to improve the multi agency response, and have made this a key theme of Policing<br />
Excellence: the Future.<br />
Violent crime rate<br />
Per 10,000 population<br />
150<br />
100<br />
Target<br />
50<br />
0<br />
2010 2011 2012 2013 2014 2015 2016 2017<br />
ANNUAL REPORT 2014 2015 107
Youth crime<br />
Police plays a central role in reducing the youth crime rate. Our approach was set out in the<br />
Prevention First: Youth Policing Plan that was launched in June 2012. In 2014/15 we implemented<br />
the Child and Young Person Offending Risk Indicator, which provides frontline staff with an<br />
assessment of an apprehended child or young person’s risk of reoffending. That assessment feeds<br />
into the Youth Resolution Model, which was rolled-out nationwide in 2014/15. The Model ensures<br />
consistent decision making across the country, and has contributed to the target for reducing<br />
youth crime being consistently exceeded.<br />
Youth crime rate<br />
Per 10,000 population<br />
450<br />
300<br />
Target<br />
150<br />
0<br />
2010 2011 2012 2013 2014 2015 2016 2017<br />
[note: the Better Public Services Youth Crime target is focused on reducing the number of first appearances<br />
in the Youth Court]<br />
108
Reoffending<br />
As part of Policing Excellence we sharpened our focus on preventing reoffending through the<br />
Alternative Resolutions workstream, which provided frontline staff with an increased range of<br />
options for resolving low level offending. These options included iwi and community justice panels,<br />
which not only avoid contact with the formal justice system, but also address the underlying<br />
causes of offending. Police is seeking to increase the number of these panels through the Iwi<br />
Partnerships theme of Policing Excellence: the Future.<br />
Re-offending rate<br />
%<br />
45<br />
30<br />
Target<br />
15<br />
0<br />
2010 2011 2012 2013 2014 2015 2016 2017<br />
N.B. the measure of re-offending for Better Public Services is calculated differently to re-offending measures reported under<br />
the priority ‘Less Crime’. The definition used for Better Public Services is:<br />
––<br />
The rate of re-imprisonment among prisoners within 12 months of their release and the rate of reconviction among<br />
community-sentenced offenders within 12 months of the start of their sentence.<br />
ANNUAL REPORT 2014 2015 109
Access to services online<br />
Police is contributing to the target of 70% of transactions with government agencies being<br />
completed online by 2017. The first transaction that Police has moved online is the payment of<br />
infringements, which is on track to meet the target, with performance in the last quarter of 2014/15<br />
standing at 55% of fines being paid online. Performance to date is represented by the black line on<br />
the graph below with the projection for future years represented by the grey line.<br />
Police is committed to moving more services online. The initial model of paying infringements online<br />
will be further automated, so that frontline staff can use their mobile devices to issue infringement<br />
notices, and in the near future we hope to have infringements sent out electronically rather than<br />
having to send them out through the post.<br />
Police received support to progress its ideas on moving services online through our successful<br />
bid for seed funding to develop a business case for moving vetting services online, with identities<br />
verified by RealMe ® .<br />
Online payment of infringements<br />
100%<br />
80%<br />
66.6%<br />
60%<br />
40%<br />
20%<br />
39.6%<br />
31.2%<br />
33.9%<br />
27.0%<br />
42.2%<br />
52.1%<br />
54.0%<br />
54.9%<br />
46.8% 48.6% 49.1%<br />
44.6% 44.6%<br />
42.0%<br />
49.2% 49.2%<br />
58.4%<br />
66.6%<br />
58.4%<br />
Actual performance<br />
Forecast performance<br />
0%<br />
Jun-12<br />
Sep-12<br />
Dec-12<br />
Mar-13<br />
Jun-13<br />
Sep-13<br />
Dec13<br />
Mar-14<br />
Jun-14<br />
Sep-14<br />
Dec14<br />
Mar-15<br />
Jun-15<br />
Sep-15<br />
Dec15<br />
Jun-16<br />
Dec-16<br />
Jun-17<br />
Dec-17<br />
110
APPENDIX 3: HOW WE WORKED<br />
WITH OTHERS<br />
To ensure that we deliver on our purpose of ensuring New Zealanders can ‘be safe and feel safe’<br />
we are increasingly co-operating more closely with other agencies. In particular, we sought to align<br />
resources and interventions with other justice and social sector agencies to address deep-seated<br />
‘system’ challenges. Strong Police involvement in the Cross-Government Family Violence and<br />
Sexual Violence Work Programme is a good example of the collaborative approach.<br />
Economic<br />
Development:<br />
NZ free of<br />
corruption and<br />
ease of doing<br />
business<br />
Foreign<br />
Affairs:<br />
international<br />
deployment<br />
Justice:<br />
reduce crime<br />
and its harm,<br />
hold offenders<br />
to account<br />
Law<br />
enforcement<br />
and Keeping<br />
the peace<br />
National<br />
Security<br />
and Policing<br />
outside NZ<br />
Crime<br />
prevention<br />
what<br />
Police<br />
does<br />
Maintaining<br />
public safety<br />
Community<br />
support and<br />
reassurance<br />
Transport:<br />
increase<br />
road safety<br />
Social: reduce<br />
family violence.<br />
Identify and<br />
support atrisk<br />
people<br />
(especially<br />
children and<br />
young people)<br />
National Security:<br />
fight terrorism and<br />
share intelligence<br />
Border<br />
Security: reduce<br />
domestic crime<br />
and combat<br />
transnational<br />
organised crime<br />
Emergency<br />
management<br />
Emergency<br />
Management: respond<br />
to civil and other<br />
emergencies, search<br />
and rescue<br />
Transport: Road Safety<br />
Police is committed to the direction set out in Safer Journeys: New Zealand’s Road Safety Strategy<br />
2010–2020, and to working in partnership across the road safety sector. Police aligned its road<br />
policing activities with the strategy and continued to deliver Police-specific activities set out in the<br />
Safer Journeys Action Plan. The results of these activities were reported in section 1 under ‘Priority<br />
Two: Improved Road Safety’. The activities delivered are reported in section 5 under the ‘Road<br />
Policing’ output class.<br />
Social: Reduce family violence, identify and support at-risk people (especially children and<br />
young people and people suffering from acute mental health episodes)<br />
Police worked alongside other social sector agencies to target family violence, protect children<br />
from abuse and neglect, respond to people suffering acute mental health episodes, reduce child<br />
and youth offending, and keep vulnerable people safe.<br />
ANNUAL REPORT 2014 2015 111
As the first responder in emergency situations, Police contributed to the outcomes of the social<br />
sector by identifying vulnerable people (particularly children) and ensuring that appropriate referrals<br />
are made to support services.<br />
The Commissioner of Police and the Chief Executives of the Ministries of Social Development,<br />
Health, Education, Justice and Business, Innovation and Employment and Te Puni Kōkiri, are jointly<br />
accountable for achieving better results across a number of social sector outcomes through the<br />
Social Sector Board, Joint Venture Board and Vulnerable Children’s Board.<br />
The results of these activities can be seen under the outcomes ‘Priority One: Protected<br />
Communities’ and ‘Priority Three: Less Crime’ reported in section 1. The activities delivered<br />
during 2014/15 are reported under the ‘General Crime Prevention’, ‘Police Primary Response<br />
Management’ and ‘Investigations’ output classes in section 3.<br />
Emergency Management: Civil and other emergencies, search and rescue<br />
Police worked with the Ministry of Civil Defence and Emergency Management and other<br />
emergency services to respond to New Zealand communities in times of need, and the Ministry of<br />
Foreign Affairs and Trade to respond to civil emergencies in other countries.<br />
Police makes important contributions to search and rescue efforts, and works closely with fire and<br />
ambulance services on a daily basis to ensure immediate responses to emergency events is made<br />
and coordinated.<br />
The results of these activities is reported under the outcome ‘Priority One: Protected Communities’<br />
in section 1, and the activities delivered are reported in section 3 under the output classes ‘Specific<br />
Crime Prevention and Maintenance of Public Order’ and ‘Police Primary Response Management’.<br />
Border Security: Reduce domestic crime and combat transnational organised crime<br />
Police’s domestic enforcement of the law, prevention of crime and community support and<br />
reassurance relies on a range of domestic and international relationships (particularly with<br />
Australian law enforcement agencies). Police also works with domestic agencies such as the<br />
Ministry of Primary Industries, New Zealand Customs Service and Immigration New Zealand to<br />
enhance border security.<br />
During 2014/15 Police coordinated its cross-border activities through its network of international<br />
Police Liaison Officers. These officers also acted as the principal point of contact for overseas<br />
policing services when they required Police’s support to achieve their objectives. Police worked<br />
closely with other countries to reduce the impact of transnational organised crime (including the<br />
trafficking of drugs) and on disarmament. Police is also involved in the Interpol community in order<br />
to target international crime and is a member of the Virtual Global Taskforce to combat online child<br />
exploitation.<br />
The results of this coordinated activity are reported in section 1 under the outcome ‘Priority One:<br />
Protected Communities’ and ‘Priority Three: Less Crime’. The activities delivered are reported in<br />
section 3 under the output classes ‘Specific Crime Prevention and Maintenance of Public Order’<br />
and ‘Investigations’.<br />
Security and Intelligence Sector: Fighting terrorism and sharing intelligence<br />
Police plays a critical role in protecting New Zealand’s national security, which it discharges in<br />
partnership with a wide array of government agencies. Police contributes intelligence analysis and<br />
receives intelligence from partner agencies, and has a vital role in taking preventative, protective,<br />
investigation and enforcement action where necessary. Police is a lead operational agency in many<br />
areas of national security and plays a key support role in others, including terrorism (including the<br />
risk posed by returning foreign fighters), and cyber threats.<br />
112
Police maintains specialist capabilities in intelligence, investigation, and operational functions,<br />
including surveillance, tactical operations, covert, and technical units. Those specialist capabilities<br />
are supplemented by Police employees across the country, who provide surge capacity in the<br />
event of an emergency arising.<br />
Police Liaison Officers also support international law enforcement, crime prevention and security in<br />
strategic locations, as well as supporting Police contributions to the security of international events,<br />
including those hosted in New Zealand.<br />
The results of Police’s work to protect New Zealand’s national security are reported in section 1<br />
under the outcome ‘Priority One: Protected Communities’, and the activities delivered are reported<br />
in section 3 under the output classes ‘Specific Crime Prevention and Maintenance of Public Order’,<br />
‘Police Primary Response Management’ and ‘Investigations’.<br />
Foreign Affairs: international development<br />
New Zealand’s international objectives support international security and upholding the rule of<br />
law. Police contributes to these objectives by deploying staff for international peace-keeping and<br />
capacity-building. Police deployment improves security and stability in developing countries, and<br />
supports wider international efforts to encourage sustainable economic growth and development in<br />
poorer countries.<br />
The results of these activities are reported in section 1 under the outcome ‘Priority One: Protected<br />
Communities’, and the activities delivered are reported in section 3 under the output class ‘Specific<br />
Crime Prevention and the Maintenance of Public Order’.<br />
Economic Development: New Zealand free of corruption, ease of doing business<br />
Police works with the Serious Fraud Office, Ministry of Business, Innovation and Employment, and<br />
others to ensure that New Zealand is a safe place for businesses to operate free of corruption and<br />
crime. By sharing information quickly Police minimises risks, limiting possible losses for individuals<br />
and business.<br />
The results of this activity are reported in section 1 under the outcome ‘Priority 3: Less Crime’, and<br />
the activities delivered are reported in section 3 under the output class ‘Investigations’.<br />
Justice: Reduce crime and its harm, hold offenders to account<br />
Police takes a leading role in delivering the Government’s goals of reducing total crime by 20%,<br />
violent crime by 20%, youth crime by 25% and reoffending by 25% 13 . Police efforts to achieve<br />
these goals will focus on reducing the social and economic costs of crime, and the impact of crime<br />
on its victims.<br />
The Commissioner of Police is a member of the Justice Sector Leadership Board along with the<br />
chief executives of the Ministry of Justice, Department of Corrections, Serious Fraud Office and<br />
Crown Law. The Board is responsible for providing governance to manage volumes and costs<br />
across the justice system.<br />
The impact of these activities is reported in section 1 under the outcomes ‘Priority One: Protected<br />
Communities’ and ‘Priority Three: Less Crime’. The outputs resulting from these activities are<br />
reported in section 5 under the output classes ‘General Crime Prevention’, ‘Investigations’, and<br />
‘Case Resolution and Support to the Judicial Process’.<br />
13 For achievement by June 2017 compared to 2011 figures with the exception of the target for total crime which is to be<br />
achieved by June 2018 compared to 2011 figures.<br />
ANNUAL REPORT 2014 2015 113
APPENDIX 4: COMMISSION OF<br />
INQUIRY CHANGE MANAGEMENT<br />
PROGRESS REPORT, 2014/15<br />
Police Commissioner’s comment<br />
As in previous years, I am pleased to offer this<br />
review of New Zealand Police’s progress in<br />
managing the changes called for in the 2007<br />
Commission of Inquiry into Police Conduct (COI).<br />
This is the seventh annual progress review. As<br />
well as offering a point-in-time view of how far<br />
we have come, this report also offers a sense<br />
of how we are tracking to the end of the Office<br />
of the Auditor-General’s mandated 10–year<br />
monitoring period through to March 2017.<br />
The forward projection continues to<br />
be encouraging, but by no means do I<br />
underestimate the need for vigilance and<br />
sustained commitment.<br />
For those keen to check in on our progress<br />
between <strong>Annual</strong> <strong>Report</strong>s, a collection of COIrelated<br />
material can be accessed on our website<br />
(at http://www.police. govt.nz/about-us/nzpolice/commission-inquiry).<br />
Here you will find<br />
quarterly updates on implementation the 47<br />
Police-specific COI recommendations. Given<br />
the Office of the Auditor-General has an overall<br />
monitoring role in relation to Police’s COI-related<br />
change progress, we also provide links through<br />
to the four COI monitoring reports which the<br />
Office has released to date.<br />
New Zealand Police will continue to carry<br />
through on the spirit and intent of the COI in the<br />
way we conduct day-to-day policing. Although<br />
we are nearing the end of the 10-year formal<br />
monitoring period, I’m confident the lessons<br />
learned, and improvements initiated, will endure.<br />
Certainly, our work doesn’t stop in March 2017.<br />
Looking ahead, I expect we will have significant<br />
further progress to report in 2016, especially<br />
as benefits start to flow from a new high<br />
performance programme that we will soon<br />
introduce across New Zealand Police. This<br />
will help all our staff be absolutely clear about<br />
our purpose – what we do, why we do it and<br />
how we police. The new high performance<br />
programme will help us be the best we can be.<br />
State Services Commission comment<br />
The State Services Commission (SSC) has reviewed this report<br />
and the underlying evidence Police has provided to support<br />
its self-assessment. We consider that the report is consistent<br />
with that underlying evidence and focuses on the priorities we<br />
agreed in the 2011/12 report.<br />
Police are achieving some excellent results across all four focus<br />
areas, overall workforce engagement continues to exceed state<br />
sector benchmarks and its 2015 Workplace Survey reports a<br />
number of strengths.<br />
Police is making good progress in addressing the issues we<br />
identified in previous reports, particularly in relation to lifting<br />
trust and confidence in complaint investigations. It appears<br />
likely that all four targets related to the complaints process<br />
will be met by 2017.<br />
However, the report shows that challenges remain, particularly<br />
in relation to lifting engagement across the workforce and<br />
improving the advancement and treatment of women and<br />
ethnic minorities in the workplace. Police is implementing<br />
significant initiatives such as district-level engagement plans and<br />
a new performance management framework which aim to lift<br />
performance in these areas.<br />
However, these initiatives are still in development or in the early<br />
stages of implementation. Police will need to ensure that it<br />
sustains its focus on these initiatives to get the shifts it wants to<br />
achieve by 2017 and beyond.<br />
Areas of particular interest for SSC in the coming year will be:<br />
• what Police is doing to lift engagement and vision and<br />
purpose across the workforce, including in the poorer<br />
performing districts and at Sergeant and Constable level<br />
(focus areas 1.1.4, 1.2.4 and 1.2.5)<br />
• how Police intends to embed actions underway to support<br />
merit-based progression, in order to ensure that selection<br />
processes do not discriminate against women and ethnic<br />
minorities (focus area 2.2).<br />
SSC looks forward to seeing Police continue to make good<br />
progress towards embedding the key elements of its response<br />
to the COI into its operating model.<br />
We also look forward to seeing Police continue to improve<br />
processes around the investigation of adult sexual assaults,<br />
which were a specific focus of the Office of the Auditor-<br />
General’s fourth COI monitoring report (February 2015).<br />
Mike Bush MNZM<br />
Commissioner<br />
New Zealand Police<br />
Mary Slater<br />
Assistant Commissioner<br />
State Services Commission<br />
114
Background and overview<br />
In 2004, a Commission of Inquiry was established to investigate serious allegations involving<br />
a small number of Police staff and their associates. The Commission’s final report was<br />
published in April 2007 (http://www.parliament.nz/resource/0000055162). Of the Commission’s<br />
60 recommendations, 47 required action by New Zealand Police.<br />
Police is a much different organisation in 2015. Significant progress has been made in identifying<br />
and embedding solutions to the COI’s recommendations, and Police is well on track to deliver the<br />
required cultural and other changes identified by Dame Margaret Bazley. The operational context<br />
in which such changes are being managed is covered in detail in Sections 1, 2 and 5 of this<br />
<strong>Annual</strong> <strong>Report</strong>.<br />
This report is the seventh annual review of progress in managing the change process associated<br />
with the COI, and the third to be carried out as a self-assessment by Police against a set of<br />
measures and targets baselined in 2011/12. Last year, for the first time, the self-assessment report<br />
was published as an appendix to Police’s <strong>Annual</strong> <strong>Report</strong> as a way of promoting greater visibility<br />
and enhanced transparency.<br />
Once again, this snapshot is part of a series of ongoing reviews, surveys and reports that point<br />
to the changes made since 2007; and Police’s commitment to continue to evolve. As in previous<br />
years, it draws extensively on the findings of Police’s Workplace Survey. The results of the 2015<br />
survey can be accessed online at: http://www.police.govt.nz/about-us/publication/new-zealandpolice-workplace-survey-results-2015.<br />
Encouragingly, progress is being made across all key areas,<br />
with some significant results being achieved in the treatment of women and ethnic minorities in<br />
the workplace – although this remains an area that needs continuing attention and focus to fully<br />
embed the relevant COI recommendations.<br />
Summary dashboards<br />
The fourth SSC review in 2011/12 (http://www.police.govt.nz/sites/default/files/publications/stateservices-commission-coi-report-into-police-conduct-2011-12.pdf)<br />
identified priority areas for the<br />
COI, and set performance baselines for future reporting. The measures review progress in the<br />
following areas, based on Workplace Survey scores:<br />
––<br />
Leadership and change<br />
––<br />
Human resources (HR) strategy and capability to support integrated change<br />
––<br />
Performance management<br />
––<br />
Lifting trust and confidence in complaints investigation.<br />
The dashboards provide the current state of Police against the baseline measures and anticipated<br />
target states for each of the key indicators for the four focus areas.<br />
ANNUAL REPORT 2014 2015 115
1.1 Vision and Purpose and Communication and Cooperation (Section Score)<br />
80<br />
75<br />
70<br />
65<br />
60<br />
55<br />
Police<br />
State Sector<br />
50<br />
2011 Baseline 2012 Results 2013 Results 2014 Results 2015 Results 2016 Target 2017<br />
1.2 Engagement Index (Overall Score)<br />
80<br />
75<br />
70<br />
65<br />
60<br />
55<br />
Police<br />
State Sector<br />
50<br />
2011 Baseline 2012 Results 2013 Results 2014 Results 2015 Results 2016 Target 2017<br />
2 Women’s Composition<br />
Percentage of women by rank<br />
2011 2013 2014 2015<br />
2017<br />
target<br />
Commissioned Officer 8.1% 9.3% 10.7% 11.4% 10%<br />
Senior Sergeant 10.7% 9.2% 10.8% 11.2% 12%<br />
Sergeant 10.7% 11.9% 11.4% 11.2% 15%<br />
Constable 20.1% 20.4% 21.7% 21.3% 23%<br />
116
2.1 People Here Are Appointed to Positions Based on Merit<br />
65<br />
60<br />
55<br />
50<br />
45<br />
40<br />
Police<br />
No State Sector benchmark<br />
35<br />
2011 Baseline 2012 Results 2013 Results 2014 Results 2015 Results 2016 Target 2017<br />
2.2 I Understand How My Performance is Measured<br />
80<br />
75<br />
70<br />
65<br />
60<br />
55<br />
Police<br />
State Sector<br />
50<br />
2011 Baseline 2012 Results 2013 Results 2014 Results 2015 Results 2016 Target 2017<br />
ANNUAL REPORT 2014 2015 117
2.3 My Performance is Fairly Assessed<br />
80<br />
75<br />
70<br />
65<br />
60<br />
55<br />
Police<br />
State Sector<br />
50<br />
2011 Baseline 2012 Results 2013 Results 2014 Results 2015 Results 2016 Target 2017<br />
3 Poor Performance is Dealt with Effectively in My Work Group<br />
70<br />
65<br />
60<br />
55<br />
50<br />
45<br />
Police<br />
State Sector<br />
40<br />
2011 Baseline 2012 Results 2013 Results 2014 Results 2015 Results 2016 Target 2017<br />
118
4 Respect and Integrity (Section Score)<br />
80<br />
75<br />
70<br />
65<br />
60<br />
55<br />
Police<br />
No State Sector benchmark<br />
50<br />
2011 Baseline 2012 Results 2013 Results 2014 Results 2015 Results 2016 Target 2017<br />
Focus area 1: Leadership and change<br />
This focus area looks at how Police uses Workplace Survey results as the vehicle to re-present<br />
COI findings in the present-day context, drive improvements in staff engagement, and increase<br />
the visibility of the Police Executive team with the frontline.<br />
Some indicators for this focus area have dropped for this year. More positively, in most instances,<br />
Police remains ahead of the state sector benchmark.<br />
Police’s Engagement Index has slipped 0.8% to 72.0% since 2014. However, the current<br />
Engagement Index remains well above where it was four years ago (+1.5%) and significantly higher<br />
than the 2015 state sector benchmark (+3.4%).<br />
Notable points last year include:<br />
––<br />
a score significantly above the 2015 state sector benchmark in the Workplace Survey Vision and<br />
Purpose and Communication categories (1.1.3)<br />
––<br />
maintaining an overall 2015 Engagement Index that is significantly higher than the state sector<br />
benchmark (1.2.3).<br />
The main elements where Police is at risk of not achieving the 2017 goals are:<br />
––<br />
to achieve the 70% target for Vision and Purpose and Communication, Police will need to<br />
improve by 3.7% annually for each of the next two years<br />
––<br />
narrowing the difference between Districts for Vision and Purpose category scores, as well as<br />
overall Engagement (1.1.4 and 1.2.4) – noting that the range between the highest and lowest<br />
scoring Districts in 2015 did not decrease<br />
––<br />
continuing issues with Police as a workplace in relation to a relatively small number of<br />
engagement drivers, notably access to training opportunities, on-the-job stress, and feeling a<br />
sense of belonging to the District or Service Centre (1.2.1).<br />
ANNUAL REPORT 2014 2015 119
Consistency across districts<br />
While the gap between the highest scoring district and the lowest scoring district for Vision and<br />
Purpose was not narrowed this year, both the lowest and highest scoring districts had scores<br />
1.4% higher than the (different) districts in those positions last year. District-level action plans are<br />
in place for those the lowest scores in this category, setting a platform for expected improvements<br />
in 2016 and beyond.<br />
Police’s overall 2015 Workplace Survey engagement score has continued to be higher than the<br />
state sector benchmark. In addition, the gap between the highest (82.0%) and lowest (60.3%)<br />
scoring districts narrowed to an 11.7% difference this year, down marginally from 11.9% in 2014.<br />
Lifting engagement scores in less-well-performing districts remains a priority, and work to boost<br />
staff engagement across the board also continues.<br />
Training opportunities<br />
Each year Police assesses the demand for training, and provides training opportunities to meet<br />
operational needs. In 2014/15, there were approximately 2,200 more training opportunities<br />
provided for tactical options training than in the previous year. This equates to roughly 25,000 extra<br />
training hours.<br />
Stress<br />
In addition to the workplace stress solutions outlined in the 2014 update, Police have a Wellcheck<br />
programme, which requires regular psychological check-ups for staff in high risk roles. Police<br />
is also introducing a Speak Up programme to better enable staff to confidently address any<br />
bullying, harassment and discrimination in the workplace. The programme includes an anonymous<br />
telephone helpline and a range of mechanisms to ensure employees are supported when they<br />
Speak Up. That said, two questions pertaining to employee well-being recorded significantly lower<br />
scores this year:<br />
––<br />
acceptability of work-related stress (question 3.2); and<br />
––<br />
care for employee well-being (question 8.8, which is the key driver showing the biggest negative<br />
variance to the state sector benchmark).<br />
Inclusiveness<br />
Police continues to score below the benchmark on three Workplace Survey questions related to<br />
inclusiveness:<br />
––<br />
being encouraged to try new ways of doing things (question 2.2);<br />
––<br />
interest in employee views and opinions (question 8.5); and<br />
––<br />
being adequately involved in decisions affecting the way individuals do their job (question 9.4).<br />
More positively, following the 2015 introduction of a new organisational value of “Valuing Diversity”,<br />
work continues to address shortfalls from the state sector benchmark on three of the<br />
13 engagement driver questions which relate to diversity and inclusiveness. Development of a<br />
formal diversity and inclusion strategy to help guide such efforts also remains an option. Finally of<br />
note, Police is a funding partner of Diverse NZ Inc, which gives the organisation access to industry<br />
best practice knowledge and resources in the area of diversity and inclusiveness.<br />
120
Focus area 2: HR strategy and capability to support<br />
integrated change<br />
This focus area is aimed at enhancing the career progression of women within Police, and more<br />
generally building and developing talent within the organisation.<br />
Most indicators for this focus area are on track to meet the 2017 goals. Highlights last year include:<br />
––<br />
the number of female Superintendents has doubled to six, including three in highly visible District<br />
Commander roles<br />
––<br />
women made up 34.4% of recruits in 2014/15, with one wing being 50% women. The<br />
percentage of women applying to become police officers is mirrored in the recruitment pipeline<br />
and in the recruit wings<br />
––<br />
continuing significant investment in women across all Police leadership development<br />
programmes.<br />
On a less positive note, Police is at risk of not achieving its 2017 goals with respect to women’s<br />
perceptions in relation to the following Workplace Survey themes: My team; Learning and<br />
development; My supervisor; and Performance and Feedback.<br />
Career progression of women<br />
Police continues to pursue initiatives designed to boost the gender balance of the organisation.<br />
The minimum recruiting target was refined to 35–40% women for 2014/15, which Police considers<br />
sustainable.<br />
Retention rates for women increased significantly last year, albeit still remaining slightly lower than<br />
that of males. However, in the last six months the rates have been higher for females. Therefore,<br />
the rolling 12-month number is expected to be higher for females than males within the next<br />
quarter.<br />
Development programmes<br />
Police continues to deliver initiatives to support women to develop and progress within the<br />
organisation. This year Police will deliver two women’s development programmes: Connect<br />
and Aspire.<br />
Administration of women’s development programmes has been assigned to a Strategic Advisor<br />
who supports the work of the national Women’s Advisory Network (WAN). Police intends to<br />
broaden the scope of the Advisory Network’s role in women’s development programmes with<br />
opportunity to establish coaching and mentoring relationships between participants and WAN<br />
members.<br />
Investment in women across all leadership development programmes also remains significant.<br />
Over the past year, 58% of employees attending leadership courses were women.<br />
To further inform the process of developing its women, Police engaged IBM to conduct an<br />
independent review of Police’s current state around women’s advancement. The findings of this<br />
work are forming the basis for Police’s diversity and inclusion strategy. The recommendations from<br />
this work have also been considered by the WAN Governance Group in developing priorities for<br />
District and Service Centre WAN work plans around women’s development for the coming year.<br />
ANNUAL REPORT 2014 2015 121
Talent management<br />
While general understanding of how performance is measured continues to surpass that of the<br />
wider state sector, Police employees were less positive about their performance being subject<br />
to a fair assessment last year. Perceptions of fair performance assessment are also significantly<br />
below the state sector norm. However, such perceptions are expected to improve once the new<br />
performance management framework is fully implemented.<br />
Perceptions related to merit-based promotions have also declined since 2014 (-2.0%). However,<br />
this score is comparable to the 2013 result and is 3.9% higher than the score obtained in 2011.<br />
Police needs to work harder to change these perceptions. An important enabler of such change<br />
is the successful completion of an appointments review project, which amongst other things has<br />
heralded a shift in the focus of selection criteria to leadership capability, particularly for supervisory<br />
positions. A review of the senior selection process will also be undertaken to ensure Police<br />
processes reflect organisational priorities and goals.<br />
Police continues to operate Development Boards at District level and provide forums for discussion<br />
of talent development at a national level. The boards provide governance and direction regarding<br />
the investment in individuals. They are comprised of senior leaders from within the organisation as<br />
well as external representation, to ensure diversity of perspectives and input into this process.<br />
Police has also worked with SSC to identify appropriate senior talent to contribute to the State<br />
Sector Career Board programme. During 2014/15, there were a number of examples of senior<br />
Police leaders taking up external secondment opportunities, as a way of further building their<br />
leadership skills (for example, one Assistant Police Commissioner was seconded to an Aucklandbased<br />
role with the State Services Commission, while another was seconded to a Christchurchbased<br />
role with the Canterbury Earthquake Recovery Authority).<br />
122
Focus area 3: Performance management<br />
This focus area concentrates on the active management of poor performance at all levels<br />
within Police.<br />
While several elements remain under action, the 2017 goals remain achievable. Highlights from<br />
last year include:<br />
––<br />
introduction of a new performance development process for roles at Inspector level and above<br />
––<br />
Police significantly outperforming the state sector benchmark with respect to poor performance<br />
being dealt with effectively.<br />
Building managerial capability<br />
As part of the new performance development process implemented for role holders at Inspector<br />
level and above, the Police competencies have been refreshed to:<br />
––<br />
incorporate behaviours linked to Police’s Values<br />
––<br />
provide a clear picture of what is expected at different levels of leadership in Police.<br />
Coaching<br />
Embedding coaching as a managerial skill remains a challenge, but an essential component of<br />
the career progression framework (CPF) that governs promotion to rank. The CPF applies an<br />
organisational filter on prospective candidates for promotion – particularly Sergeant to Senior<br />
Sergeant – and will complement and improve the level of individual performance management in<br />
frontline Police managers.<br />
Performance appraisals<br />
Performance appraisal and management systems are to be fully aligned by 2016, with the<br />
introduction of an electronic performance appraisal system incorporated in a new HR Management<br />
Information System. The focus is to improve the effectiveness of the appraisal system overall;<br />
remedying the ‘form heavy’ nature of the present system, and creating a culture in which<br />
supervisors and staff exchange feedback on performance much more routinely.<br />
ANNUAL REPORT 2014 2015 123
Focus area 4: Lifting trust and confidence in complaint<br />
investigations<br />
This focus area looks at the outcomes of the Police disciplinary process, particularly as they relate<br />
to key aspects of integrity, such as managing risks associated with the formation of inappropriate<br />
relationships.<br />
Assuming the same rate of progress since 2011, Police is likely to achieve the 2017 objectives for<br />
three of the four elements of this focal area. Moreover, Police expects scores for all four questions<br />
to increase markedly with the 2015 introduction of a suite of new ethics reporting solutions, which<br />
are currently being finalised. On this basis, there is reason to be confident all four key targets will be<br />
met by 2017.<br />
Highlights from this focus area last year include:<br />
––<br />
significant reductions in the amount of time taken for employment-based disciplinary<br />
proceedings to run their course (4.1.3)<br />
––<br />
continuing increases in positive responses to Workplace Survey Respect and Integrity questions,<br />
which almost without exception score significantly higher than State Sector comparators (4.1.5).<br />
Some of the elements of this focus area where concerns remain are:<br />
––<br />
data collection challenges, which have prevented the generation of meaningful statistics on the<br />
volumes of internal misconduct reporting (4.1.4)<br />
––<br />
lower levels of awareness by Police staff about the Protected Disclosures Act than State Sector<br />
peers (4.1.6).<br />
Raising the profile of the Police Professional Conduct function<br />
Efforts continue to be made to communicate the role of Police Professional Conduct (PPC) in<br />
keeping employees safe. PPC staff speak at Sergeant, Senior Sergeant and Inspector qualifying<br />
courses at the Royal New Zealand Police College. PPC managers continue to be part of each<br />
District’s visibility roster, which brings them onto the frontline at peak times to engage with and<br />
advise staff.<br />
PPC staff have been instrumental in implementing Tactical Communications ‘train the trainer’<br />
courses in three Districts (Waitematā, Counties Manukau and Central), with Counties Manukau<br />
trainers since delivering training to remaining District staff (with 500+ staff already benefitting from<br />
such training).<br />
District PPC Managers are rotated from other management positions in District to ensure the role<br />
is experienced by a variety of senior leaders, and senior staff are exposed to the PPC work and<br />
understand its value. When positions are advertised in PPC both at PNHQ and within Districts,<br />
there are a number of quality suitable applicants applying for the roles. This represents a change<br />
in the level of interest, and as a result the skill-set of PPC staff has broadened.<br />
Consistency of outcomes<br />
A working party comprising representatives from Employment Relations, Human Resources and<br />
PPC is considering a wide range of issues that will impact on the consistency of processes and<br />
clarity of roles.<br />
In addition, Police and the IPCA are commencing joint work with the Government Centre for<br />
Dispute Resolution on developing an early resolution process for suitable complaint matters.<br />
This is in the early days of planning and may lead to pilots being considered. The aim of the pilots<br />
124
will be better outcomes for complainants and a reduction in the amount of resource required<br />
to resolve matters.<br />
Since January 2015, all Policy, Practice and Procedure reviews in relation to significant events<br />
and deaths have been provided to Police’s Operational Advisory Committee, which considers the<br />
recommendations and endorses them where appropriate. These decisions are recorded in Police’s<br />
Lessons Learnt Database, so actions taken can be tracked. Moreover, learnings from appropriate<br />
IPCA investigations are now added to the Lessons Learnt Database, so that the lessons can be<br />
shared with the wider organisation.<br />
Disciplinary speed and outcomes<br />
In the year to 30 December 2014, Police had 21 non-criminal matters that were viewed as possible<br />
serious misconduct. These matters took 176 days on average to be completed, which represents<br />
a 56% reduction in the average duration of a disciplinary hearing process.<br />
Training has been delivered to Human Resources employees and investigators. Further refinement<br />
to the disciplinary process is being considered, together with a refresh of the Police Supervisors<br />
Guide, which provides step-by-step detail on the disciplinary process.<br />
Respect and integrity in the workplace<br />
There has been a general decrease in scores since 2014 on the four questions in the Respect and<br />
Integrity section of Police’s Workplace Survey. Of most concern are the declines on two questions<br />
– confidence in raising concerns about workplace harassment, bullying or discrimination without<br />
fear of reprisal, and belief that concerns that have been raised will be dealt with appropriately.<br />
Understanding barriers to reporting on integrity matters<br />
Developments to allow for robust measurement of internal misconduct reporting are still underway.<br />
An evidence-based programme, Speak Up, is scheduled for roll out in 2015. Speak Up is designed<br />
to foster a culture of ‘report and be protected’. The package includes:<br />
––<br />
a Speak Up intranet information portal<br />
––<br />
an anonymous telephone helpline<br />
––<br />
anonymous online reporting functionality<br />
––<br />
support for employees who Speak Up<br />
––<br />
mandatory annual training in Speak Up provisions.<br />
ANNUAL REPORT 2014 2015 125
Focus area 1: Leadership and change<br />
Key:<br />
* = baseline measure<br />
• On track: If score trend continues at current rate Police will meet or exceed 2017 COI target.<br />
• Under Action: Actions in place to achieve 2017 target.<br />
• At risk: if current trends continue Police may not achieve 2017 COI target.<br />
Vision and purpose<br />
Indicators 2017 objective Status/Result<br />
1.1.1 Change<br />
management<br />
momentum and<br />
coherence<br />
1.1.2 Relating the<br />
Vision and Purpose to<br />
the frontline<br />
1.1.3 Vision and<br />
Purpose engagement<br />
compared with the<br />
State Sector*<br />
1.1.4 Consistency<br />
across districts*<br />
Staff engagement<br />
Indicators<br />
1.2.1 Police as a<br />
workplace<br />
1.2.2 Rewarding the<br />
right behaviours<br />
1.2.3 Workplace<br />
engagement compared<br />
with the State Sector*<br />
1.2.4 Workplace<br />
engagement district<br />
wide comparison*<br />
A unified and dynamic communications and change<br />
management plan will have been implemented,<br />
connecting all COI-related change, Policing Excellence<br />
initiatives and key strategic initiatives.<br />
Frontline staff will report that they understand the<br />
operational implications of the Vision and Purpose and<br />
how it relates to them day to day.<br />
Police will score at least 70% and be above state<br />
sector benchmark in the Vision and Purpose and<br />
Communication and Cooperation category.<br />
There will be higher average and narrower range of<br />
scores in the distribution of staff engaged with the<br />
Vision and Purpose across districts and workgroups.<br />
Targets achieved in nine agreed Engagement Driver<br />
targets as well as seven additional drivers added in<br />
2013/13.<br />
Regular mechanisms will be in place and regularly used<br />
to celebrate Police successes, reward appropriate<br />
behaviours and to communicate these externally and<br />
internally.<br />
The Engagement Index target for Police will be at least<br />
77% and will be above the state sector benchmark.<br />
All districts will have an engagement index above 70%.<br />
• On track<br />
• On track<br />
• At risk 62.6%<br />
• On track<br />
Average 61.3%<br />
• At risk<br />
Range 19%<br />
• On track<br />
• Under action for<br />
6/16 engagement<br />
drivers<br />
• Under action<br />
• Under action<br />
72%<br />
• Under action for<br />
relevant districts<br />
6 x districts >70%;<br />
2 x districts
1.2.5 Workplace<br />
engagement Sergeant<br />
and Constable<br />
comparison<br />
Leadership (visibility at<br />
the frontline) Indicators<br />
1.3.1 Police leadership<br />
as role models<br />
1.3.2 Engagement of<br />
Police leadership with<br />
the frontline<br />
1.3.3 Police leadership<br />
as models of the right<br />
behaviours<br />
There will be a greater positive shift in engagement for<br />
Sergeants and Constables.<br />
The engagement index targets will be 80% for<br />
Sergeants and 75% for Constables.<br />
Police leaders will be excellent role models and will<br />
inspire their staff.<br />
Senior leaders will be visible for staff and people will<br />
feel more connected to Police as an organisation.<br />
Senior leaders and frontline managers will consistently<br />
model the right behaviours and will be perceived to be<br />
doing so by their staff.<br />
• At risk<br />
Sergeants – 72.5%<br />
Constables –<br />
69.6%<br />
• On track<br />
• On track<br />
64.1%<br />
• On track<br />
83%<br />
Focus area 2: Human resources strategy and capability to<br />
support integrated change<br />
Career progression of<br />
women indicators 2017 objective Status/Result<br />
2.1.1 Gender<br />
composition of Police’s<br />
ranks*<br />
2.1.2 Engagement<br />
profile of men and<br />
women<br />
• The proportion of women at senior ranks in Police<br />
will more closely reflect the proportion of women<br />
across the entire organisation.<br />
• <strong>Annual</strong> recruitment for Constabulary women will be<br />
above 30% of total Constabulary recruitment.<br />
• Women’s attrition rates will remain similar to or<br />
lower than those of men.<br />
• Women’s promotion rates will match those of men.<br />
• Women will make up at least 10% of total<br />
Commissioned Officers.<br />
• Much higher representation of women in senior<br />
operational positions.<br />
Women’s engagement profile will be equal or<br />
higher than that of men, reflecting women feeling<br />
more positive about their career and development<br />
opportunities within Police.<br />
Scores for women are on par or higher than those<br />
for men regarding their career and development<br />
opportunities within Police.<br />
• On track<br />
11.4% vs 32.2%<br />
• Achieved<br />
34.4%<br />
• On track<br />
Inspector and<br />
above:<br />
• On track<br />
Senior/sergeant:<br />
• Under action<br />
• Achieved<br />
11.4%<br />
• On track<br />
• Achieved<br />
2.2% higher than<br />
men’s (73.6% and<br />
71.4% respectively).<br />
• At risk<br />
56.9% (F) vs<br />
61% (M)<br />
ANNUAL REPORT 2014 2015 127
Career progression of<br />
women indicators 2017 objective Status/Result<br />
2.1.3 The drivers of<br />
women’s advancement<br />
2.1.4 Development of<br />
women staff<br />
2.1.5 Communication<br />
of women’s career<br />
pathways<br />
100% of women leaving Police at non-Commissioned<br />
Officer level and above will be offered and actively<br />
encouraged to have formal exit interviews.<br />
The incentives to advance women in Police will be<br />
understood and strategies will be in place to mitigate<br />
or remove barriers to the advancement of women.<br />
Women at Sergeant or Senior Sergeant levels will have<br />
clear career paths towards senior operational roles,<br />
including the use of short-term secondments to round<br />
out experiential shortfalls.<br />
100% of women at Senior Sergeant level and above<br />
will be offered and actively encouraged to have an<br />
Individual Development Plan (IDP) and an individual<br />
mentor (internal or external) relevant to their career<br />
aspirations.<br />
Development interventions and IDPs for the<br />
advancement of women into senior positions will be in<br />
place and regularly reviewed.<br />
Women will be supported through IDPs and mentors<br />
to gain the right exposure to the right operational<br />
experience in order to progress.<br />
Support programmes for women will be based on<br />
best practice talent management approaches and will<br />
be informed by leadership development programmes<br />
for women and other minority groups from other<br />
jurisdictions.<br />
• On track<br />
• Under action<br />
• On track<br />
• Under action<br />
• Under action<br />
Talent management Indicators<br />
Status/Result<br />
2.2.1 The merit of<br />
promotions and<br />
advancements*<br />
2.2.2 Composition of<br />
Police’s skill base —<br />
Constabulary and non-<br />
Constabulary staff<br />
2.2.3 The identification<br />
and management<br />
of talent<br />
Police will score at least 70.3% and be above the state<br />
sector benchmark on understanding how performance<br />
is measured.<br />
Police will score at least 68.2% and be above the<br />
state sector benchmark for the question that assesses<br />
perception of performance being fairly assessed.<br />
Police will score at least 60% and will show continuous<br />
improvement relative to the 2011 score for the<br />
question that people are appointed to positions based<br />
on merit.<br />
There will be a wide range of career pathways and<br />
programmes for the development of Constabulary<br />
staff.<br />
The diversity of the workforce’s skill base will be better<br />
captured and utilised.<br />
Integrated career structures will enable movement<br />
between different roles.<br />
There will be a base rate of skills defined for staff<br />
at different levels, and this will be reflected in a<br />
competency framework.<br />
• At risk<br />
64.2%<br />
• At risk<br />
61%<br />
• At risk<br />
47.6%<br />
• Under action<br />
• Under action<br />
128
Talent management Indicators<br />
Status/Result<br />
2.2.4 Alignment of<br />
talent management<br />
and HR strategies<br />
A dynamic workforce management plan will be agreed<br />
and continually refreshed with senior Police leaders.<br />
The workforce management plan will be regarded as<br />
best practice in State Sector terms.<br />
• Under action<br />
Focus area 3: Performance management<br />
Performance Management<br />
Indicators 2017 objective Status/Result<br />
3.1.1 Consistency<br />
of performance<br />
management practices<br />
3.1.2 Role of<br />
performance<br />
management in career<br />
development<br />
3.1.3 Effective<br />
coaching<br />
3.1.4 Dealing with poor<br />
performance*<br />
3.1.5 The disciplinary<br />
process and early<br />
warnings data<br />
There will be consistent performance management<br />
practices across the districts and workgroups.<br />
Performance management will be seen in a positive<br />
developmental context. Staff at all levels will view<br />
performance management as constructive and<br />
necessary for their career path and development.<br />
Managers will see performance management as a core<br />
part of their role.<br />
There will be a focus on relationships and constructive<br />
and regular performance conversations between<br />
managers and their staff at all levels.<br />
Poor performance in the districts will be identified and<br />
dealt with as it happens.<br />
Police will score at least 70% for the question ‘I<br />
get regular feedback on my performance from my<br />
supervisor (formal/informal) in the Workplace Survey.<br />
The CLC survey will show Police performing on par with<br />
the benchmarks.<br />
Coaching will be established as a ‘critical leadership<br />
behaviour’. Leader’s demonstration of this behaviour<br />
will be measured through the performance development<br />
process.<br />
Police will at least score consistently better year-on-year<br />
than the state sector benchmark measure ‘that poor<br />
performance is dealt with effectively in work groups’.<br />
The desired future state is for Early Intervention (EI) to<br />
be an accepted and understood system in Police and<br />
that interventions change behaviour effectively.<br />
• Under action<br />
• On track<br />
70.9% agree<br />
The next<br />
longitudinal survey<br />
and CLC survey<br />
data will be<br />
available in 2016<br />
• Under action<br />
• On track<br />
61.8%<br />
• On track<br />
ANNUAL REPORT 2014 2015 129
Focus area 4: Lifting trust and confidence in complaint<br />
investigations<br />
Disciplinary speed and<br />
outcomes Indicators 2017 objective Status/Result<br />
4.1.1 Reputation<br />
of and respect for<br />
the Professional<br />
Standards/Conduct<br />
functions<br />
4.1.2 Consistency<br />
across management<br />
of employment based<br />
criminal or disciplinary<br />
processes<br />
4.1.3 Time taken for<br />
employment based<br />
disciplinary processes<br />
4.1.4 Respect and<br />
Integrity in the<br />
Workplace*<br />
4.1.5 Understanding<br />
of the barriers to<br />
reporting on matters<br />
of integrity*<br />
4.1.6 Effectiveness of<br />
protected disclosures<br />
policy<br />
The reputation of the Police Professional Standards<br />
functions (now Police Professional Conduct) within<br />
and outside Police will be positive, and the group<br />
will be viewed as a guardian and guide on integrity<br />
and appropriate conduct.<br />
A period of work in the Professional Standards<br />
workgroup will be seen as desirable and a stepping<br />
stone to senior positions.<br />
Reviews of the complaints process will show<br />
greater consistency between districts.<br />
Improved trends in technical and procedural<br />
correctness of employment based disciplinary or<br />
criminal processes.<br />
Consistent use of decision frameworks for<br />
complaints and their escalation.<br />
The average elapsed time for all employmentbased<br />
disciplinary processes will be reduced.<br />
There will be an increase in reports of sexual<br />
misconduct in the short-term followed by a<br />
downward trend in the long term.<br />
There will be greater understanding of what the<br />
barriers are to the reporting on matters of integrity,<br />
such as inappropriate relationships, and explicit<br />
actions to resolve these will be in place.<br />
Exceed the state sector benchmark for the<br />
question on the mechanisms for reporting<br />
breaches of integrity and conduct anonymously or<br />
confidentially; and<br />
In the SSC Integrity and Conduct Survey Police will<br />
achieve 75% and/or remain the leading agency in<br />
the state sector for the question, ‘are you confident<br />
that you know where to get good advice about<br />
integrity and conduct’<br />
The Protected Disclosures Policy and Challenging<br />
Police Misconduct (Integrity <strong>Report</strong>ing) Policy will<br />
be operating effectively and this will result in an<br />
increase in reports of misconduct in the short- term<br />
which will reduce over time.<br />
For the awareness of the Protected Disclosures Act<br />
in the SSC Integrity and Conduct Survey Police’s<br />
score will be above its 2011 score and will exceed<br />
the state sector benchmark.<br />
• On track<br />
• Under action<br />
• On track<br />
56% improvement to<br />
average time taken<br />
(compared to the<br />
disciplinary hearing<br />
process average of<br />
313 days).<br />
• Under action<br />
• On track<br />
The next SSC Integrity<br />
and Conduct Survey is<br />
in 2016<br />
The next SSC Integrity<br />
and Conduct Survey is<br />
in 2016<br />
• Under action<br />
Project due to be<br />
implemented Sept 15.<br />
The next SSC Integrity<br />
and Conduct Survey is<br />
in 2016<br />
130
ANNUAL REPORT 2014 2015 131
The 16 Engagement Drivers<br />
8.9: NZ Police is an enjoyable place to work<br />
1.7: My job gives me a sense of personal achievement<br />
8.7: I feel a sense of belonging to my District or my Service Centre<br />
8.10: I feel I am working for an effective organisation<br />
1.6: The work I do makes good use of my knowledge and skills<br />
2.2: I am encouraged to try new ways of doing things<br />
3.2: The level of work-related stress I experience in my job is acceptable<br />
2.4: There are career development opportunities for me in NZ Police<br />
1.5: NZ Police provides adequate training for the work I do<br />
7.5: I feel my contribution is valued in NZ Police**<br />
8.5: NZ Police is interested in the views and opinions of its staff**<br />
8.8: NZ Police cares about the well-being of its staff**<br />
8.4: There is a sense of ‘common purpose’ in NZ Police**<br />
8.2: Communication in my District or my Service Centre is open and honest**<br />
9.4: I am sufficiently involved in decisions that affect the way I do my job**<br />
9.1: Day-to-day decisions demonstrate that quality of services is a top priority for NZ Police***<br />
Performance<br />
1.3: I understand how my performance is measured<br />
1.4: My performance is fairly assessed<br />
4.7: People are held accountable for their performance in my team<br />
4.8: Poor performance is dealt with effectively in my team<br />
6.5: I get regular feedback on my performance from my supervisor (formal/informal)<br />
7.2: People here are appointed to positions based on merit<br />
132
Weighted Mean Scores<br />
Level of Agreement Scores<br />
Target<br />
2017<br />
Tracking<br />
against<br />
2011<br />
baseline<br />
Police<br />
2014<br />
Police<br />
2015<br />
State Sector<br />
Benchmark<br />
2015<br />
Police<br />
2014<br />
Police<br />
2015<br />
State Sector<br />
Benchmark<br />
2015<br />
Engagement Index 77 é 72.8 72.0 68.6 73.3 72.1 69.7<br />
70 é 71.3 70.7 NA 72.4 71.2 NA<br />
> State<br />
sector<br />
benchmark<br />
ê 75.5 75.4 72.6 78.3 77.9 75.6<br />
70 é 64.7 64.0 64.1 60.3 59.8 64.9<br />
65 é 66.5 65.7 NA 64.2 62.8 NA<br />
70 é 71.8 71.4 65.0 75.0 74.4 59.6<br />
60 é 60.1 59.4 61.9 51.2 49.7 60.9<br />
65 é 60.1 58.8 60.2 54.9 52.2 59.4<br />
60 NA 59.6 59.7 54.6 53.4 53.5 38.2<br />
60 ê 54.5 52.2 NA 44.8 40.0 NA<br />
NA é 60.0 58.9 59.3 51.0 49.2 59.4<br />
NA é 52.5 51.8 55.4 39.9 38.9 57.0<br />
NA é 58.1 57.0 61.9 50.9 48.7 65.9<br />
NA é 63.1 62.6 60.0 58.2 57.2 57.8<br />
NA é 57.3 56.9 54.3 46.3 45.1 49.3<br />
NA ê 58.6 57.6 60.9 51.3 49.2 63.4<br />
NA NA 61.8 60.4 60.9 55.1 52.9 55.1<br />
NA é 64.9 64.2 63.4 61.1 59.4 59.2<br />
NA ê 62.1 61.0 62.8 54.6 52.7 60.4<br />
NA ê 68.4 67.7 NA 66.9 65.7 NA<br />
NA é 62.5 61.8 48.8 54.4 53.3 29.8<br />
NA é 70.9 70.9 67.1 68.8 68.5 61.0<br />
NA é 49.6 47.6 NA 34.5 31.3 NA<br />
ANNUAL REPORT 2014 2015 133
Respect and Integrity<br />
5.1: Staff in my team respect employee diversity<br />
5.2: I know who to contact to report instances of workplace harassment, bullying or discrimination<br />
5.3: I am confident that I could raise concerns I had related to workplace harassment, bullying or discrimination without<br />
fear of reprisal<br />
5.4: I am confident that I could raise concerns I had about other inappropriate conduct in the workplace without fear of reprisal<br />
(inappropriate conduct may include any actions or behaviours that make you feel uncomfortable in the workplace)<br />
5.5: I am confident that any concerns I may need to raise regarding harassment, bullying, discrimination or other<br />
inappropriate conduct would be dealt with appropriately<br />
Respect and Integrity (Section Score)<br />
Rewarding the Right Behaviours at NZ Police<br />
4.1: People in my team conduct themselves in accordance with the values expected by NZ Police<br />
6.1: My supervisor behaves in a way that is consistent with the values of NZ Police<br />
7.1: NZ Police has appropriate ways of recognising outstanding achievement<br />
7.3: We celebrate success in NZ Police<br />
Vision and Purpose + Communication and Cooperation<br />
8.1: NZ Police has a clear vision of where it’s going and how it’s going to get there<br />
8.3: I feel informed about NZ Police and its activities<br />
8.6: Teams within NZ Police work well together<br />
8.11: I intend to continue working at NZ Police for at least the next 12 months<br />
Vision and Purpose + Communication and Cooperation section score<br />
134
Weighted Mean Scores<br />
Level of Agreement Scores<br />
Target<br />
2017<br />
Tracking<br />
against<br />
2011<br />
baseline<br />
Police<br />
2014<br />
Police<br />
2015<br />
State Sector<br />
Benchmark<br />
2015<br />
Police<br />
2014<br />
Police<br />
2015<br />
State Sector<br />
Benchmark<br />
2015<br />
Engagement Index 77 é 72.8 72.0 68.6 73.3 72.1 69.7<br />
NA é 78.4 78.3 NA 83.4 83.6 NA<br />
NA é 75.6 74.9 NA 79.7 79.1 NA<br />
NA é 70.1 69.2 NA 70.4 69.2 NA<br />
NA é 69.4 68.6 NA 69.1 68.4 NA<br />
NA é 67.3 66 NA 64.4 63.0 NA<br />
NA é 72.2 71.4 NA 73.4 72.7 NA<br />
NA é 79.8 79.4 NA 86.2 86.0 NA<br />
NA é 83.2 83.0 77.4 87.4 87.5 80.3<br />
NA é 57.8 56.8 NA 46.3 44.9 NA<br />
NA é 58.4 58.6 58.3 47.0 47.5 57.7<br />
NA é 65.9 64.9 66.3 62.3 60.0 64.5<br />
NA é 62.8 62.7 62.4 56.5 56.0 61.7<br />
NA é 61.1 60.8 57.1 54.3 54.1 46.9<br />
NA ê 83.5 82.9 83.5 85.2 84.6 85.2<br />
NA é 63.2 62.6 61.0 57.1 58.0 58.6<br />
ANNUAL REPORT 2014 2015 135
APPENDIX 5: PROFILE OF<br />
OUR PEOPLE<br />
All employees: by gender<br />
Employees by gender, as at June 2010–2015<br />
As at 30 June 2010 As at 30 June 2011<br />
Gender<br />
Constabulary<br />
Other<br />
Employees Total Constabulary<br />
Other<br />
Employees<br />
Total<br />
Female 1,562 1,959 3,484 1,562 1,983 3,545<br />
Male 7,294 1,143 8,408 7,294 1,145 8,439<br />
Total 8,856 3,102 11,892 8,856 3,128 11,984<br />
Percentage female<br />
(%)<br />
17.6% 63.2% 29.3% 17.6% 63.4% 29.6%<br />
As at 30 June 2012 As at 30 June 2013<br />
Gender<br />
Constabulary<br />
Other<br />
Employees Total Constabulary<br />
Other<br />
Employees<br />
Total<br />
Female 1,584 1,937 3,521 1,586 1,890 3,475<br />
Male 7,356 1,102 8,458 7,197 1,001 8,198<br />
Total 8,940 3,039 11,979 8,782 2,891 11,673<br />
Percentage female<br />
(%)<br />
17.7% 63.7% 29.4% 18.1% 65.4% 29.8%<br />
As at 30 June 2014 As at 30 June 2015<br />
Gender<br />
Constabulary<br />
Other<br />
Employees Total Constabulary<br />
Other<br />
Employees<br />
Total<br />
Female 1,676 1,930 3,606 1,721 1,950 3,671<br />
Male 7,387 1,038 8,426 7,327 982 8,309<br />
Total 9,063 2,969 12,032 9,048 2,932 11,980<br />
Percentage female<br />
(%)<br />
18.5% 65.0% 30.0% 19.0% 66.5% 30.6%<br />
Notes<br />
• Figures are given on a full-time equivalent basis; that is, employees working on a part-time basis are summed to an<br />
equivalent of a full- time employee.<br />
• Numbers do not include employees on leave without pay.<br />
• Recruits are included in the Constabulary number.<br />
• Due to the consolidation of numbers, some minor rounding variations can occur between employee numbers in the<br />
report. This rounding does not affect the overall position or integrity of the numbers reported.<br />
136
Employees by Age Group, as at June 2013–2014<br />
As at 30 June 2013<br />
Age<br />
Constabulary<br />
Other<br />
Employees<br />
Total<br />
0 to 24 266 128 394<br />
25 to 34 1,749 419 2,168<br />
35 to 44 3,350 693 4,044<br />
45 to 54 2,687 914 3,601<br />
55 to 64 689 602 1,291<br />
65+ 39 133 173<br />
Total 8,782 2,891 11,673<br />
As at 30 June 2014<br />
Age<br />
Constabulary<br />
Other<br />
Employees<br />
Total<br />
0 to 24 383 160 543<br />
25 to 34 1,873 422 2,295<br />
35 to 44 3,150 658 3,808<br />
45 to 54 2,816 926 3,742<br />
55 to 64 799 625 1,424<br />
65+ 43 177 220<br />
Total 9,063 2,969 12,032<br />
As at 30 June 2015<br />
Age<br />
Constabulary<br />
Other<br />
Employees<br />
Total<br />
0 to 24 388 177 565<br />
25 to 34 1,894 457 2,351<br />
35 to 44 2,972 594 3,566<br />
45 to 54 2,839 905 3,744<br />
55 to 64 910 613 1,523<br />
65+ 46 185 231<br />
Total 9,048 2,932 11,980<br />
Notes<br />
• Figures are given on a full-time equivalent basis; that is, employees working on a part-time basis are summed to an<br />
equivalent of a full-time employee.<br />
• Numbers do not include employees on leave without pay.<br />
• Recruits are included in the Constabulary number.<br />
• Due to the consolidation of numbers, some minor rounding variations can occur between employee numbers in the<br />
report. This rounding does not affect the overall position or integrity of the numbers reported.<br />
ANNUAL REPORT 2014 2015 137
Employees – constabulary staff only: by rank and gender<br />
Constabulary employees by rank and gender as at June 2010–2015<br />
As at 30 June 2010 As at 30 June 2011<br />
Male Female Total<br />
%<br />
female Male Female Total<br />
%<br />
female<br />
Commissioner 1 – 1 – 1 – 1 –<br />
Deputy commissioner 2 – 2 – 2 – 2 –<br />
Assistant commissioner 4 – 4 – 3 – 3 –<br />
Superintendent 39 3 42 7.1% 40 2 42 4.8%<br />
Inspector 240 18 258 7.0% 247 23 270 8.6%<br />
Senior sergeant 385 41 426 9.6% 372 42 414 10.2%<br />
Sergeant 1,238 135 1,373 9.8% 1,259 146 1,405 10.4%<br />
Constable 5,287 1,312 6,599 19.9% 5,211 1,289 6,500 19.8%<br />
Matron – – – – – 1 1 100.0%<br />
Recruits 69 16 85 18.8% 159 59 218 27.1%<br />
Total 7,265 1,525 8,790 17.3% 7,294 1,562 8,856 17.6%<br />
As at 30 June 2012 As at 30 June 2013<br />
Male Female Total<br />
%<br />
female Male Female Total<br />
%<br />
female<br />
Commissioner 1 – 1 – 1 – 1 –<br />
Deputy commissioner 2 – 2 – 2 – 2 –<br />
Assistant commissioner 5 – 5 – 5 – 5 –<br />
Superintendent 43 1 44 2.3% 38 2 40 5.0%<br />
Inspector 229 21 250 8.4% 231 26 257 10.3%<br />
Senior sergeant 395 47 442 10.6% 411 41 452 9.2%<br />
Sergeant 1,276 162 1,438 11.3% 1,256 173 1,429 12.1%<br />
Constable 5,337 1,335 6,672 20.0% 5,194 1,322 6,516 20.3%<br />
Matron – – – – – – – –<br />
Recruits 68 18 86 20.9% 59 21 80 26.3%<br />
Total 7,356 1,584 8,940 17.7% 7,197 1,585 8,782 18.1%<br />
138
As at 30 June 2014 As at 30 June 2015<br />
Male Female Total<br />
%<br />
female Male Female Total<br />
%<br />
female<br />
Commissioner 1 – 1 – 1 0 1 –<br />
Deputy commissioner 1 – 1 – 3 0 3 –<br />
Assistant commissioner 5 – 5 – 5 0 5 –<br />
Superintendent 39 3 42 7.1% 36 6 42 14.3%<br />
Inspector 228 29 257 11.5% 235 30 265 11.3%<br />
Senior sergeant 414 50 464 10.7% 412 52 464 11.1%<br />
Sergeant 1,302 164 1,466 11.2% 1,290 163 1,453 11.2%<br />
Constable 5,228 1,354 6,582 20.6% 5,258 1,431 6,690 21.4%<br />
Matron – –<br />
Recruits 169 76 245 31.0% 86 39 125 31.2%<br />
Total 7,387 1,676 9,063 18.5% 7,327 1,721 9,048 19.0%<br />
Notes<br />
• Figures are given on a full-time equivalent basis; that is, employees working on a part-time basis are summed to an<br />
equivalent of a full-time member.<br />
• Numbers do not include employees on leave without pay.<br />
• Due to the consolidation of numbers some minor rounding variations can occur between employees’ numbers in the<br />
report. This rounding does not affect the overall position or integrity of the numbers reported.<br />
• Authorised Officers and Temporary Sworn staff are included in the “Constable” line of data.<br />
ANNUAL REPORT 2014 2015 139
All employees: by ethnicity<br />
Ethnicity profile of New Zealand Police as at June 2010–2015<br />
Ethnicity<br />
2013<br />
Census<br />
population<br />
base (%)<br />
2009/10<br />
(%)<br />
2010/11<br />
(%)<br />
Police profile, as at 30 June<br />
2011/12<br />
(%)<br />
2012/13<br />
(%)<br />
2013/14<br />
(%)<br />
2014/15<br />
(%)<br />
New Zealand European/<br />
Pākehā<br />
69.6 72.6 72.3 72.4 71.8 70.9 70.4<br />
Māori 14.9 11.0 11.0 10.9 11.0 11.2 11.3<br />
Pacific peoples 7.4 4.8 4.9 4.9 5.0 5.1 5.4<br />
Asian peoples 11.8 2.1 2.3 2.3 2.5 2.7 2.8<br />
European 6.0 16.4 16.2 15.9 15.6 17.6 15.1<br />
Other ethnic groups 1.2 0.5 0.5 0.5 0. 7 0.5 0.6<br />
Notes<br />
• Employees are given the option of recording multiple ethnic groups. If an employee has chosen to do this they are<br />
counted in each group selected, so the percentages in this table will add to more than 100 percent.<br />
• Figures are given on a full time equivalent basis; that is, employees working on a part-time basis are summed to an<br />
equivalent of a full-time member.<br />
• Numbers do not include employees on leave without pay.<br />
• Population statistics are from 2013 Census and include all people who stated each ethnic group, whether as their only<br />
ethnic group or as one of several ethnic groups. Where a person reported more than one ethnic group, they have been<br />
counted in each applicable group.<br />
All employees: turnover and terminations<br />
Numbers of turnover and terminations as at June 2010–2015<br />
As at 30 June<br />
2009/10 2010/11 2011/12 2012/13 2013/14 2014/15<br />
Constabulary turnover rate 2.6% 3.4% 3.6% 5.3% 4.5% 4.1%<br />
Constabulary terminations 225 303 319 474 398 364<br />
Other Employees turnover rate 8.3% 9.4% 9.9% 9.8% 8.4% 9.9%<br />
Other Employees terminations 260 299 309 291 254 303<br />
* This excluded planned terminations<br />
140
Numbers of turnover and terminations by gender as at June 2010–2015<br />
As at 30 June<br />
2009/10 2010/11 2011/12 2012/13 2013/14 2014/15<br />
Constabulary – Female turnover rate 2.1% 4.0% 4.3% 5.5% 5.4% 4.4%<br />
Constabulary – Female terminations 33 64 70 92 91 76<br />
Constabulary – Male turnover rate 2.7% 3.3% 3.5% 5.3% 4.3% 4.0%<br />
Constabulary – Male terminations 192 239 250 382 307 288<br />
Other Employees – Female turnover rate 8.0% 9.2% 9.6% 9.3% 9.5% 10.0%<br />
Other Employees – Female terminations 161 187 191 180 185 199<br />
Other Employees – Male turnover rate 8.9% 9.7% 10.4% 10.6% 6.3% 9.3%<br />
Other Employees – Male terminations 99 112 117 111 69 104<br />
* This excluded planned terminations<br />
ANNUAL REPORT 2014 2015 141
Total employee numbers<br />
Staff numbers (headcount, including provision for leave without pay), 2012–2015<br />
30 June 2010* 30 June 2011*<br />
Constabulary<br />
Other<br />
Employee<br />
Constabulary<br />
Other<br />
Employee<br />
District or other location<br />
Full<br />
Time<br />
Part<br />
Time<br />
Full<br />
Time<br />
Part<br />
Time<br />
Full<br />
Time<br />
Part<br />
Time<br />
Full<br />
Time<br />
Part<br />
Time<br />
Northland 321 14 49 9 306 16 48 7<br />
Waitematā 706 32 121 19 693 30 126 23<br />
Auckland 693 24 151 18 670 25 157 14<br />
Counties Manukau 985 30 180 16 1,045 28 173 15<br />
Waikato 584 20 90 10 566 29 97 14<br />
Bay of Plenty 606 24 102 11 589 23 106 12<br />
Central 654 29 95 19 646 31 97 17<br />
Eastern 395 12 58 10 403 15 62 9<br />
Wellington 788 24 142 25 762 25 146 28<br />
Tasman 300 15 49 14 306 13 51 15<br />
Canterbury 841 48 106 25 849 55 110 22<br />
Southern 559 23 70 24 537 16 75 22<br />
Police National Headquarters 1,144** 26** 1,474** 208** 1,018** 25** 1,471** 195**<br />
Financial Crime Group<br />
Licensing and Vetting<br />
National Prosecutions<br />
National Communications<br />
National Intelligence Centre<br />
Police Infringement Bureau<br />
Commercial Vehicle Invest Unit<br />
Crime<br />
ICT Service Centre<br />
Training Service Centre<br />
Legal<br />
Tactical Groups<br />
International Service Group<br />
Org Financial Crime Agency NZ<br />
Total 8,576 321 2,687 408 8,390 331 2,719 393<br />
Notes<br />
• The Auckland Metropolitan Crime and Operations Support Unit was disestablished in 2011/12. Its functions and<br />
employees were transferred to Auckland City and the crime team.<br />
• Due to the consolidation of numbers some minor rounding variations can occur between employee numbers in the<br />
report. This rounding does not affect the overall position or the integrity of the numbers reported.<br />
142
30 June 2012 30 June 2013 30 June 2014 30 June 2015<br />
Constabulary<br />
Other<br />
Employee<br />
Constabulary<br />
Other<br />
Employee<br />
Constabulary<br />
Other<br />
Employee<br />
Constabulary<br />
Other<br />
Employee<br />
Full<br />
Time<br />
Part<br />
Time<br />
Full<br />
Time<br />
Part<br />
Time<br />
Full<br />
Time<br />
Part<br />
Time<br />
Full<br />
Time<br />
Part<br />
Time<br />
Full<br />
Time<br />
Part<br />
Time<br />
Full<br />
Time<br />
Part<br />
Time<br />
Full<br />
Time<br />
Part<br />
Time<br />
Full<br />
Time<br />
Part<br />
Time<br />
319 14 50 4 317 11 46 5 322 14 47 8 326 16 52 3<br />
734 31 123 18 693 33 97 17 723 32 111 15 717 33 109 11<br />
775 33 163 12 820 35 141 14 794 35 145 15 776 35 145 13<br />
1,088 29 191 7 989 44 164 9 1012 55 176 11 1017 58 167 12<br />
601 20 98 12 583 21 83 10 606 23 89 12 606 24 76 13<br />
637 25 112 10 662 21 87 2 662 24 98 2 658 28 91 5<br />
673 34 99 17 663 30 93 16 672 26 95 19 678 25 90 17<br />
426 14 71 6 424 19 61 7 411 20 63 9 412 23 54 4<br />
786 24 148 21 767 25 118 24 787 27 126 21 775 34 116 15<br />
320 14 47 13 323 14 38 8 320 17 38 13 316 20 39 8<br />
914 47 122 19 839 71 97 19 851 68 102 18 846 62 96 17<br />
565 13 84 16 547 17 66 16 551 16 70 15 559 17 71 14<br />
82 2 249 16 108 4 367 26 99 1 402 31 116 1 406 33<br />
21 2 26 – 25 1 27 2 27 1 27 1 33 1 31 1<br />
2 – 15 1 1 0 17 1 1 3 – – – –<br />
167 8 140 24 182 2 138 26 186 3 102 17 182 4 96 19<br />
82 – 395 80 89 3 449 75 81 1 461 97 81 – 488 108<br />
17 – 46 – 10 1 39 2 15 1 48 1 10 – 47 3<br />
11 – 76 5 4 0 86 5 5 90 5 4 – 95 4<br />
81 – 21 2 89 0 12 1 100 6 2 106 – 6 3<br />
207 7 139 9 127 2 126 7 132 114 9 132 1 137 16<br />
4 – 234 15 2 0 233 14 1 226 17 2 – 211 17<br />
127 4 103 13 133 2 174 8 139 2 343 7 204 2 215 8<br />
4 – 16 1 3 0 17 2 3 1 15 3 1 15 2<br />
71 1 3 2 108 1 1 2 108 1 2 105 – 2 2<br />
50 – 8 1 34 0 12 0 47 13 2 57 – 20 1<br />
32 – 17 62 2 26 1 65 3 24 73 3 21 –<br />
8,796 322 2,796 324 8,604 359 2,815 319 8720 370 3,035 349 8,794 388 2,896 349<br />
* Numbers do not include employees on leave without pay. Corporate Service Centre reflects employees on final<br />
retirement leave; changes to Police policy mean this will no longer be used.<br />
** Includes all staff working in Police National Headquarters and service centres<br />
ANNUAL REPORT 2014 2015 143
Remuneration<br />
Remuneration of Staff by salary band 2014/15<br />
Total<br />
remuneration band<br />
personnel Overseas [a] Police [b]<br />
Left<br />
Total<br />
New Zealand<br />
Started during<br />
year [c]<br />
Remuneration<br />
authority [d]<br />
$0–$9,999 293 104 184<br />
$10,000–$19,999 286 86 178<br />
$20,000–$29,999 269 102 82<br />
$30,000–$39,999 351 103 95<br />
$40,000–$49,999 602 81 95<br />
$50,000–$59,999 1100 63 39<br />
$60,000–$69,999 1884 55 12<br />
$70,000–$79,999 1884 12 49 6<br />
$80,000–$89,999 1504 10 40 3<br />
$90,000–$99,999 1652 4 31 3<br />
$100,000–$109,999 1122 7 19<br />
$110,000–$119,999 914 8 24<br />
$120,000–$129,999 564 16 15<br />
$130,000–$139,999 309 4 22 1<br />
$140,000–$149,999 172 6 17<br />
$150,000–$159,999 84 8 9 1<br />
$160,000–$169,999 44 6 7<br />
$170,000–$179,999 22 7<br />
$180,000–$189,999 14 3 2<br />
$190,000–$199,999 4 2<br />
$200,000–$209,999 8 3 1<br />
$210,000–$219,999 7 2 1<br />
$220,000–$229,999 5 1<br />
$230,000–$239,999 8 3 3<br />
$240,000–$249,999 3 1<br />
$250,000–$259,999 6 1 1<br />
$260,000–$269,999 4 1<br />
$270,000–$279,999 3 1<br />
$280,000–$289,999 3<br />
$290,000–$299,999 1 1<br />
$300,000–$309,999 1 1<br />
$310,000–$319,999 3 1<br />
$320,000–$329,999 3 1<br />
144
Total<br />
remuneration band<br />
personnel Overseas [a] Police [b]<br />
Left<br />
Total<br />
New Zealand<br />
Started during<br />
year [c]<br />
Remuneration<br />
authority [d]<br />
$360,000–$369,999 1 1<br />
$500,000–$509,999 1 1<br />
$690,000–$699,999 1 1<br />
Total 13,132 105 840 700 2<br />
Notes<br />
The table includes all employees including part-time employees, employees who had a period of leave without pay,<br />
employees who started during the year and employees who received pay increases during the year by the remuneration<br />
band that they actually received during 2014/15 not the full-time remuneration at any point of the year.<br />
[a] Employees who received additional allowances relating to their overseas postings.<br />
[b] Employees who left New Zealand Police during 2014/15 and many have been paid contractual entitlements.<br />
[c] Employees who began working for New Zealand Police during 2014/15 and have not yet received a full year’s<br />
remuneration.<br />
[d] Employees whose remuneration was determined by the Independent Remuneration Authority for at least part of<br />
the year.<br />
Remuneration of Staff by salary band and age group 2014/15<br />
Total remuneration band 0–24 25–34 35–44 45–54 55–64 65+<br />
$0–$9,999 75 85 78 37 12 6<br />
$10,000–$19,999 107 85 45 28 15 6<br />
$20,000–$29,999 44 75 79 40 13 18<br />
$30,000–$39,999 48 109 94 56 29 15<br />
$40,000–$49,999 85 135 151 128 73 30<br />
$50,000–$59,999 153 260 278 221 147 41<br />
$60,000–$69,999 265 730 443 257 152 37<br />
$70,000–$79,999 42 681 711 335 98 17<br />
$80,000–$89,999 2 301 712 388 88 13<br />
$90,000–$99,999 2 93 615 668 253 21<br />
$100,000–$109,999 38 423 517 140 4<br />
$110,000–$119,999 15 249 466 170 14<br />
$120,000–$129,999 3 123 328 107 3<br />
$130,000–$139,999 3 56 184 62 4<br />
$140,000–$149,999 25 106 37 4<br />
$150,000–$159,999 15 46 21 2<br />
$160,000–$169,999 6 28 8 2<br />
$170,000–$179,999 1 9 12<br />
$180,000–$189,999 1 8 5<br />
$190,000–$199,999 1 2 1<br />
$200,000–$209,999 4 4<br />
ANNUAL REPORT 2014 2015 145
Total remuneration band 0–24 25–34 35–44 45–54 55–64 65+<br />
$210,000–$219,999 1 4 2<br />
$220,000–$229,999 1 2 2<br />
$230,000–$239,999 3 5<br />
$240,000–$249,999 1 2<br />
$250,000–$259,999 3 3<br />
$260,000–$269,999 1 2 1<br />
$270,000–$279,999 1 2<br />
$280,000–$289,999 3<br />
$290,000–$299,999 1<br />
$300,000–$309,999 1<br />
$310,000–$319,999 1 2<br />
$320,000–$329,999 2 1<br />
$360,000–$369,999 1<br />
$500,000–$509,999 1<br />
$690,000–$699,999 1<br />
Total 823 2,613 4,108 3,880 1,470 238<br />
Notes<br />
The table includes all employees including part-time employees, employees who had a period of leave without pay,<br />
employees who started during the year and employees who received pay increases during the year by the remuneration<br />
band that they actually received during 2014/15 not the full-time remuneration at any point of the year.<br />
Average length of service 2009/10 to 2014/15<br />
Role 30/06/2010 30/06/2011 30/06/2012 30/06/2013 30/06/2014 30/06/2015<br />
Constabulary 12.4 12.8 13.0 13.4 13.39 13.71<br />
Other Employees 8.4 8.9 9.4 9.4 9.53 9.67<br />
The average length of service (in years) for Police employees as at the end of each financial year.<br />
Average length of service 2012/13 to 2014/15 by Gender<br />
As at 30 June 2013 As at 30 June 2014 As at 30 June 2015<br />
Gender<br />
Constabulary Constabulary Constabulary<br />
Other<br />
Employees<br />
Constabulary<br />
Other<br />
Employees<br />
Female 10.42 9.78 10.32 9.89 10.63 9.75<br />
Male 14.19 8.78 14.13 8.85 14.47 9.50<br />
The average length of service (in years) for Police employees by gender as at the end of each<br />
financial year.<br />
146
Average length of service 2012/13 to 2014/15 by Age<br />
As at 30 June 2013 As at 30 June 2014 As at 30 June 2015<br />
Age Range<br />
Constabulary<br />
Other<br />
Employees<br />
Constabulary<br />
Other<br />
Employees<br />
Constabulary<br />
Other<br />
Employees<br />
0–24 2.13 1.42 1.37 1.29 1.54 1.13<br />
25–34<br />
5.11<br />
3.96<br />
4.83<br />
3.86<br />
4.91<br />
3.48<br />
35–44<br />
10.95<br />
7.52<br />
10.95<br />
7.37<br />
11.23<br />
7.72<br />
45–54<br />
18.97<br />
10.34<br />
18.76<br />
10.55<br />
18.76<br />
10.63<br />
55–64<br />
29.58<br />
14.81<br />
29.06<br />
14.67<br />
28.67<br />
15.33<br />
65+<br />
32.50<br />
15.54<br />
34.68<br />
15.34<br />
35.57<br />
16.13<br />
The average length of service (in years) for Police employees by age as at the end of each<br />
financial year.<br />
ANNUAL REPORT 2014 2015 147
APPENDIX 6: INFORMATION<br />
REQUIRED BY STATUTE<br />
Surveillance Device Warrants<br />
In accordance with the provisions of section 172 of the Search and Surveillance Act 2012,<br />
the information in the table below is provided. The table provides information on Surveillance<br />
Device Warrants.<br />
Section 172 (Surveillance Device Warrants) 2013/14 2014/15<br />
Number of applications made 117 122<br />
Number of applications granted 117 122<br />
Number of applications refused Nil Nil<br />
Number of warrants granted for use of interception device 107 102<br />
Number of warrants granted for use of visual surveillance device 71 69<br />
Number of warrants granted for use of tracking device 95 95<br />
Number of warrants that authorised entry onto private premises 62 62<br />
Number of interception devices used No more than 24 hours 7 3<br />
1–3 days 32 16<br />
3–7 days 53 31<br />
7–21 days 134 117<br />
21–60 days 312 346<br />
Number of visual surveillance devices used No more than 24 hours 1 3<br />
1–3 days 11 15<br />
3–7 days 7 10<br />
7–21 days 11 18<br />
21–60 days 48 66<br />
Number of tracking devices used No more than 24 hours 4 6<br />
1–3 days 18 11<br />
3–7 days 22 11<br />
7–21 days 62 68<br />
21–60 days 115 194<br />
Number of persons charged in criminal proceedings where the collection of<br />
evidential material relevant to those proceedings was significantly assisted by<br />
carrying out activities under the authority of the surveillance device warrant<br />
300 204<br />
Number of reported breaches of any of the conditions of the issue of the<br />
surveillance device warrant (provide details of breaches if any)<br />
Nil<br />
Nil<br />
148
Warrantless Surveillance Device Powers Exercised<br />
In accordance with the provisions of section 170 of the Search and Surveillance Act 2012, the<br />
information in table below is provided. The table provides information on the use of Warrantless<br />
Surveillance Device Powers<br />
Section 170(1) Warrantless Powers 2013/14 2014/15<br />
Number of occasions warrantless surveillance powers were exercised involving<br />
the use of a surveillance device<br />
37 36<br />
Number of interception devices used No more than 24 hours 22 42<br />
24–48 hours 54 36<br />
Number of visual surveillance devices used No more than 24 hours 2 5<br />
24–48 hours 1 Nil<br />
Number of tracking devices used No more than 24 hours 4 20<br />
24–48 hours 8 9<br />
Number of people charged in criminal proceedings where the collection of<br />
evidential material relevant to those proceedings was significantly assisted by the<br />
exercise of a warrantless surveillance power<br />
22 29<br />
Number of reported breaches where a surveillance device used was not<br />
authorised under the warrantless emergency and urgency powers (provide<br />
details of breaches if any)<br />
Nil<br />
Nil<br />
Warrantless Search Powers Exercised<br />
In accordance with section 170 of the Search and Surveillance Act 2012, the information in<br />
table below is provided. This is requirement for reporting on warrantless entry or search powers<br />
exercised under Part 2 or 3 of the Act became effective 1 October 2012.<br />
Section 170(1) Warrantless Powers 2013/14 2014/15<br />
Number of occasions warrantless search powers were exercised 6,674 7,048<br />
Number of people charged in criminal proceedings where the collection of<br />
evidential material relevant to those proceedings was significantly assisted by the<br />
exercise of a warrantless search power<br />
3,770 3,866<br />
ANNUAL REPORT 2014 2015 149
Declaratory Orders<br />
In accordance with section 172 of the Search and Surveillance Act 2012, the information in the<br />
table below is provided.<br />
Section 172 Declaratory Orders 2013/14 2014/15<br />
Number of applications for declaratory orders Nil Nil<br />
Number of declaratory orders made Nil Nil<br />
Number of declaratory orders refused Nil Nil<br />
Number of declaratory orders related to use of: a device Nil Nil<br />
a technique Nil Nil<br />
a procedure Nil Nil<br />
an activity Nil Nil<br />
General description of the nature of the: device n/a n/a<br />
technique n/a n/a<br />
procedure n/a n/a<br />
activity n/a n/a<br />
Number of persons charged in criminal proceedings where the collection of<br />
evidential material relevant to those proceedings was significantly assisted by<br />
carrying out activities covered by a declaratory order<br />
Nil<br />
Nil<br />
Examination Orders<br />
In accordance with section 172 of the Search and Surveillance Act 2012, the information in the<br />
table below is provided. This is data is provided in accordance with the requirement for reporting<br />
on examination orders that became effective 1 October 2012.<br />
Table 5: Examination Orders (under the Search and Surveillance Act 2012)<br />
Section 170 Examination Orders 2013/14 2014/15<br />
Number of applications made Nil Nil<br />
Number of applications granted Nil Nil<br />
Number of applications refused Nil Nil<br />
Number of persons charged in criminal proceedings where the collection of<br />
evidential material relevant to those proceedings was significantly assisted by an<br />
examination conducted under an examination order<br />
Nil<br />
Nil<br />
150
Bodily Samples<br />
In accordance with section 76 of the Criminal Investigations (Bodily Samples) Act 1995, the<br />
information in the table below is provided.<br />
Bodily Samples 2013/14 2014/15<br />
(a)<br />
(ab)<br />
The number of occasions on which a blood sample has been taken<br />
with the consent of a person given in response to a databank request<br />
The number of occasions on which a buccal sample has been taken<br />
with the consent of a person given in response to a databank request<br />
0 0<br />
623 1,186<br />
(b)<br />
(c)<br />
The number of applications for compulsion orders by type:<br />
suspect compulsion orders<br />
juvenile compulsion orders<br />
The number of applications referred to in paragraph (b) that were:<br />
suspect compulsion orders – granted<br />
suspect compulsion orders – refused<br />
juvenile compulsion orders – granted<br />
juvenile compulsion orders – refused<br />
(*) 6 discontinued/withdrawn<br />
50<br />
2<br />
43<br />
1*<br />
2<br />
0<br />
76<br />
6<br />
52<br />
1<br />
5<br />
0<br />
(ca)<br />
(cb)<br />
(cc)<br />
(cd)<br />
The number of occasions on which a blood sample has been taken<br />
pursuant to a compulsion order<br />
The number of occasions on which a buccal sample has been taken<br />
pursuant to a compulsion order<br />
The number of occasions on which a blood sample has been taken<br />
pursuant to a databank compulsion notice<br />
The number of occasions on which a buccal sample has been taken<br />
pursuant to a databank compulsion notice<br />
0 1<br />
62 59<br />
3 0<br />
841 677<br />
(ce)<br />
(d)<br />
(da)<br />
The number of:<br />
(i) databank compulsion notice hearings requested and<br />
(ii) Part 3 orders made<br />
(iii) and the number of orders made that the databank compulsion<br />
notice is of no effect in respect to those hearings<br />
(*) 7 discontinued/withdrawn<br />
The number of:<br />
(i) occasions on which a DNA profile obtained under Part 2 procedure<br />
has been used as evidence against a person in trial; and<br />
(ii) persons referred to in subparagraph (i) in respect of whom a<br />
conviction has been entered as a result of the trial<br />
The number of:<br />
(i) occasions on which a DNA profile obtained under a Part 3 procedure<br />
has been used in support of an application for a suspect compulsion<br />
order under Part 2<br />
(ii) suspect compulsion orders granted in respect of those applications<br />
(i) 56<br />
(ii) 48<br />
(iii) 1*<br />
Information<br />
not<br />
captured<br />
nationally<br />
(i) 49<br />
(ii) 49<br />
(i) 13<br />
(ii) 10<br />
(iii) 0<br />
Information<br />
not<br />
captured<br />
nationally<br />
(i) 61<br />
(ii) 59<br />
ANNUAL REPORT 2014 2015 151
Bodily Samples 2013/14 2014/15<br />
(e)<br />
(ea)<br />
(eb)<br />
(ec)<br />
(ed)<br />
(ee)<br />
(ef)<br />
(eg)<br />
The number of occasions on which any constable has used or<br />
caused to be used force to assist a suitably qualified person to take<br />
a fingerprick or buccal sample pursuant to a compulsion order or<br />
databank compulsion notice:<br />
The number of occasions on which a buccal sample has been taken as<br />
a result of a Part 2A request<br />
The number of occasions on which a bodily sample has been taken<br />
under Part 2B<br />
The number of occasions on which a DNA profile was derived from a<br />
bodily sample taken under Part 2B<br />
The number of occasions on which a DNA profile derived from a bodily<br />
sample taken under Part 2B matched with DNA information referred to<br />
in section 24R(1) (a)<br />
The number of occasions on which a DNA profile derived from a<br />
bodily sample taken under Part 2B matched DNA information<br />
collected from the scene of the offence in respect of which the bodily<br />
sample was taken.<br />
The number of occasions on which a constable used reasonable force<br />
under section 54A(2)<br />
The total number of DNA profiles stored on a Part 2B temporary<br />
databank at the end of the period under review<br />
1 0<br />
3 2<br />
9,648 11,209<br />
8,834 10,333<br />
1,087 1,417<br />
62 69<br />
3 10<br />
1,508 1,912<br />
(f)<br />
The total number of DNA profiles stored on a DNA profile databank at<br />
the end of the<br />
period under review; and<br />
number of bodily samples obtained by consent<br />
number of bodily samples obtained pursuant to a compulsion order<br />
number of bodily samples obtained pursuant to a databank<br />
compulsion notice<br />
number of Part 2B bodily samples obtained<br />
• Police found that the information provided by ESR, the custodian’s of the<br />
National DNA Database, for the 2012/13 and 2013/14 financial years was<br />
incorrect. The 2013/14 figures have been corrected in this table, and the<br />
figures for 2012/13 should have read:<br />
number of bodily samples obtained by consent 95,467<br />
number of bodily samples obtained pursuant to a compulsion order 152<br />
number of bodily samples obtained pursuant to a databank compulsion<br />
notice 23,183<br />
152,044<br />
95,969*<br />
181*<br />
24,038*<br />
26,618<br />
160,296<br />
96,552<br />
203<br />
24,753<br />
34,392<br />
(g)<br />
(h)<br />
The number of occasions on which a DNA profile obtained from<br />
evidence at the scene of an offence or in connection with an offence is<br />
matched with a DNA profile obtained under a Part 2 procedure<br />
The number of occasions on which a DNA profile obtained from<br />
evidence at the scene of an offence or in connection with an offence<br />
is matched with a DNA profile on the DNA profile databank obtained<br />
under a Part 3 procedure<br />
379 289<br />
1,952 951<br />
152
(2) The information required by subsection (1) (eb) to (eg) must be provided together with a<br />
breakdown of those totals according to the ethnicity of the persons from whom the samples<br />
were taken, and the number of young persons from whom samples were taken, so far as that<br />
information is known by the Police.<br />
Ethnicity 2012/13 2013/14 2014/15<br />
Young<br />
persons<br />
2012/13<br />
Young<br />
persons<br />
2013/14<br />
Young<br />
persons<br />
2014/15<br />
(eb)<br />
The number of<br />
occasions on<br />
which a bodily<br />
sample has been<br />
taken under<br />
Part 2B<br />
Asian<br />
European<br />
Indian<br />
Latin American<br />
Māori<br />
245<br />
5,078<br />
351<br />
19<br />
4,767<br />
226<br />
3,975<br />
302<br />
20<br />
3,805<br />
217<br />
4,543<br />
355<br />
12<br />
4,584<br />
Middle Eastern<br />
62<br />
54<br />
84<br />
Native African<br />
60<br />
48<br />
60<br />
Pacific Islander<br />
1,368<br />
1,125<br />
1,224<br />
Other<br />
57<br />
63<br />
58<br />
Unknown<br />
43<br />
30<br />
72<br />
Total<br />
558 332 366<br />
(ec)<br />
The number of<br />
occasions on<br />
which a DNA<br />
profile was<br />
derived from a<br />
bodily sample<br />
taken under<br />
Part 2B<br />
Asian<br />
European<br />
Indian<br />
Latin American<br />
Maori<br />
Middle Eastern<br />
269<br />
4,672<br />
330<br />
18<br />
4,737<br />
57<br />
212<br />
3,655<br />
282<br />
19<br />
3,460<br />
52<br />
214<br />
4,208<br />
339<br />
12<br />
4,171<br />
79<br />
Native African<br />
54<br />
44<br />
55<br />
Pacific Islander<br />
1,247<br />
1,023<br />
1,128<br />
Other<br />
54<br />
59<br />
57<br />
Unknown<br />
39<br />
28<br />
70<br />
Total<br />
558 293 340<br />
(ed)<br />
The number of<br />
occasions on<br />
which a DNA<br />
profile derived<br />
from a bodily<br />
sample taken<br />
under Part 2B<br />
matched with<br />
DNA information<br />
referred to in<br />
section 24R(1)(a)<br />
Asian<br />
European<br />
Indian<br />
Latin American<br />
Maori<br />
Middle Eastern<br />
Native African<br />
Pacific Islander<br />
3<br />
257<br />
5<br />
0<br />
581<br />
4<br />
0<br />
153<br />
8<br />
276<br />
11<br />
0<br />
608<br />
3<br />
3<br />
176<br />
8<br />
306<br />
16<br />
0<br />
962<br />
2<br />
5<br />
208<br />
13<br />
110<br />
49<br />
Other<br />
0<br />
2<br />
8<br />
2<br />
Unknown<br />
0<br />
0<br />
0<br />
Total<br />
125<br />
174 195<br />
ANNUAL REPORT 2014 2015 153
Ethnicity 2012/13 2013/14 2014/15<br />
Young<br />
persons<br />
2012/13<br />
Young<br />
persons<br />
2013/14<br />
Young<br />
persons<br />
2014/15<br />
(ee)<br />
The number of<br />
occasions on<br />
which a DNA<br />
profile derived<br />
from a bodily<br />
sample taken<br />
under Part 2B<br />
matched DNA<br />
information<br />
collected from<br />
the scene of<br />
the offence<br />
in respect of<br />
which the bodily<br />
sample was<br />
taken<br />
Asian<br />
European<br />
Indian<br />
Latin American<br />
Maori<br />
Middle Eastern<br />
Native African<br />
Pacific Islander<br />
Other<br />
Unknown<br />
Total<br />
0<br />
14<br />
0<br />
0<br />
26<br />
0<br />
0<br />
9<br />
0<br />
0<br />
3<br />
21<br />
2<br />
0<br />
29<br />
1<br />
1<br />
4<br />
1<br />
0<br />
3<br />
22<br />
2<br />
0<br />
36<br />
0<br />
0<br />
4<br />
0<br />
0<br />
8<br />
1<br />
5<br />
2<br />
1<br />
9 6<br />
(ef)<br />
The number<br />
of occasions<br />
on which<br />
a constable used<br />
reasonable force<br />
under section<br />
54A(2)<br />
European<br />
Maori<br />
Native African<br />
Pacific Islander<br />
Total<br />
2<br />
4<br />
0<br />
0<br />
3<br />
0<br />
0<br />
0<br />
5<br />
5<br />
0<br />
0<br />
0 0 0<br />
(eg)<br />
The total number<br />
of DNA profiles<br />
stored on a Part<br />
2B temporary<br />
databank at the<br />
end of the period<br />
under review<br />
Ethnicity<br />
information not<br />
captured<br />
4,829 1,508 1,912 n/a* n/a* n/a*<br />
(*) ESR systems<br />
no longer<br />
allow for this<br />
information to<br />
be identified<br />
154
www.police.govt.nz