

THE NEW ZEALAND LIBRARY & INFORMATION MANAGEMENT JOURNAL NGĀ PŪRONGO
NZLIMJ%20Vol%2055%20Issue%203
NZLIMJ%20Vol%2055%20Issue%203

Create successful ePaper yourself
Turn your PDF publications into a flip-book with our unique Google optimized e-Paper software.
<strong>NEW</strong> <strong>ZEALAND</strong> <strong>LIBRARY</strong> & <strong>INFORMATION</strong> <strong>MANAGEMENT</strong> <strong>JOURNAL</strong> • <strong>NGĀ</strong> <strong>PŪRONGO</strong> VOL 55, ISSUE NO. 3 • OCTOBER 2015<br />
The following could be inferred from Table 3 (lower triangle):<br />
• All correlations are positive, i.e. there are positive<br />
associations between ranks. In other words, if the<br />
people to whom men went for information are higher<br />
ranked in one age group they will be also higher ranked<br />
in the other age group.<br />
• However, the strength of association, i.e. correlations<br />
decrease with an increase in the distance between age<br />
groups. For instance, the rank list of the youngest age<br />
group (15-24) almost perfectly matches the rank list of<br />
the next age group (25-34). The Spearman’s rank-order<br />
correlation is 0.90 and statistically significant at the 1%<br />
level. However, correlation between the rank list of the<br />
youngest age group (15-24) and the oldest age group<br />
(65+) decreases to only 0.41 and is not statistically<br />
significant.<br />
Therefore, we would reject the null hypothesis (H1a) and<br />
conclude that the information-seeking behaviors of New<br />
Zealand men are changing with age. When they are young<br />
they would approach different people for information, help and<br />
support when they feel stressed, than when they are seniors.<br />
Of course the explanation for these changes in the<br />
information-seeking behavior is partly quite trivial. Namely,<br />
when they are young they might not have spouse/partner and<br />
children to ask for information and help. Therefore, spouse/<br />
partner and children would be ranked lower on their list of<br />
people. Similarly, with the last two age groups, most of the men<br />
would not have at that age mother or father to approach and<br />
ask for information and help. Therefore these people (mothers<br />
and fathers) would be ranked lower on the list than it is the case<br />
with the younger age groups.<br />
4.1.2 Ethnicity<br />
We repeated the analysis using the ethnicity variable with<br />
three ethnic groups. The rank lists in Table 4 are quite similar<br />
are no differences between ethnic groups when New Zealand<br />
men decide to whom they will go to for information, help and<br />
support when they are experiencing life difficulties.<br />
Table 5: Correlation matrix (ethnicity)<br />
The following could be inferred from Table 5 (lower triangle):<br />
• All correlations are positive, i.e. there are positive<br />
associations between ranks. In other words, if the people<br />
to whom men went for information are higher ranked in<br />
one ethnic group they will be also higher ranked in the<br />
other ethnic group.<br />
• The strength of association, i.e. correlations are quite<br />
high and all are significant to at least a 5% level. In other<br />
words, rank lists are quite stable across ethnic groups.<br />
Therefore, we can’t reject the null hypothesis (H1b) and we<br />
conclude that the information seeking behavior of New Zealand<br />
men are quite similar across the three ethnic groups.<br />
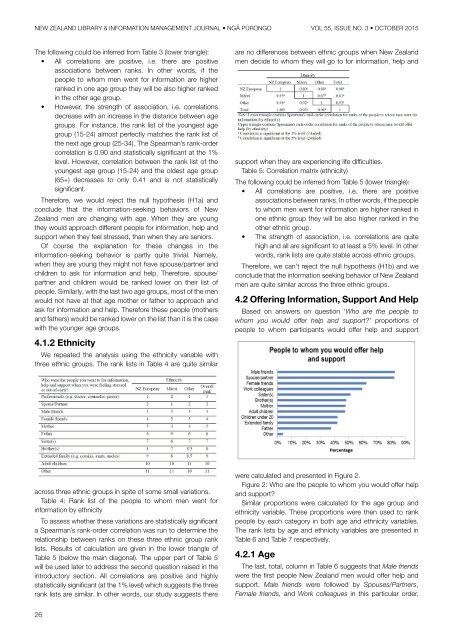
4.2 Offering Information, Support And Help<br />
Based on answers on question ‘Who are the people to<br />
whom you would offer help and support?’ proportions of<br />
people to whom participants would offer help and support<br />
across three ethnic groups in spite of some small variations.<br />
Table 4: Rank list of the people to whom men went for<br />
information by ethnicity<br />
To assess whether these variations are statistically significant<br />
a Spearman’s rank-order correlation was run to determine the<br />
relationship between ranks on these three ethnic group rank<br />
lists. Results of calculation are given in the lower triangle of<br />
Table 5 (below the main diagonal). The upper part of Table 5<br />
will be used later to address the second question raised in the<br />
introductory section. All correlations are positive and highly<br />
statistically significant (at the 1% level) which suggests the three<br />
rank lists are similar. In other words, our study suggests there<br />
were calculated and presented in Figure 2.<br />
Figure 2: Who are the people to whom you would offer help<br />
and support?<br />
Similar proportions were calculated for the age group and<br />
ethnicity variable. These proportions were then used to rank<br />
people by each category in both age and ethnicity variables.<br />
The rank lists by age and ethnicity variables are presented in<br />
Table 6 and Table 7 respectively.<br />
4.2.1 Age<br />
The last, total, column in Table 6 suggests that Male friends<br />
were the first people New Zealand men would offer help and<br />
support. Male friends were followed by Spouses/Partners,<br />
Female friends, and Work colleagues in this particular order.<br />
26