

NATIONAL
nsb201510
nsb201510

You also want an ePaper? Increase the reach of your titles
YUMPU automatically turns print PDFs into web optimized ePapers that Google loves.
C. Assessing the Condition of Pathways – Participation and Equity<br />
The long-term strength of our workforce requires that the full range of STEM and non-STEM career<br />
pathways be available to all Americans. This imperative is undergirded by two foundational principles:<br />
first, that every individual in the United States is afforded the opportunity to reap the benefits of<br />
advancements in science and technology; second, that our ability to respond to national needs<br />
and remain globally competitive will require the capabilities and ingenuity of individuals of diverse<br />
backgrounds.<br />
Our Nation’s failure to meet this charge fully takes on increased importance amid national and global<br />
developments. 98 Within the United States, the demographic composition of our future labor force is<br />
changing. As of fall 2014, the U.S. Department of Education notes that whites are a minority of our<br />
public school students. 99 And minorities are expected to compose the majority of the U.S. population<br />
before mid-century. At the same time, women and some racial and ethnic minorities (blacks, Hispanics,<br />
and American Indians/Alaska Natives) are underrepresented in the U.S. S&E workforce compared to<br />
their overall labor force participation.<br />
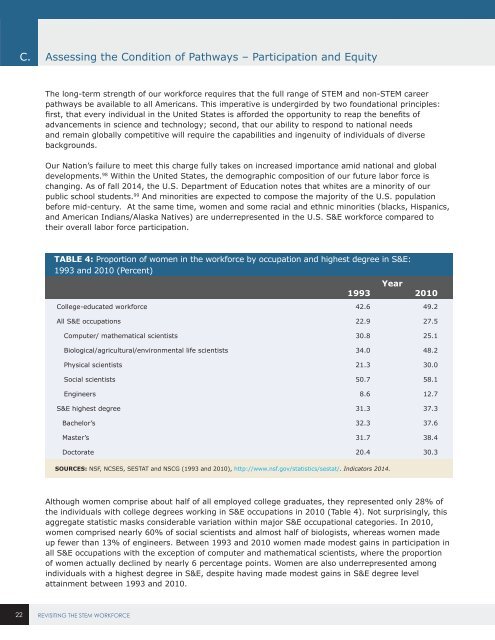
TABLE 4: Proportion of women in the workforce by occupation and highest degree in S&E:<br />
1993 and 2010 (Percent)<br />
Year<br />
1993 2010<br />
College-educated workforce 42.6 49.2<br />
All S&E occupations 22.9 27.5<br />
Computer/ mathematical scientists 30.8 25.1<br />
Biological/agricultural/environmental life scientists 34.0 48.2<br />
Physical scientists 21.3 30.0<br />
Social scientists 50.7 58.1<br />
Engineers 8.6 12.7<br />
S&E highest degree 31.3 37.3<br />
Bachelor’s 32.3 37.6<br />
Master’s 31.7 38.4<br />
Doctorate 20.4 30.3<br />
SOURCES: NSF, NCSES, SESTAT and NSCG (1993 and 2010), http://www.nsf.gov/statistics/sestat/. Indicators 2014.<br />
Although women comprise about half of all employed college graduates, they represented only 28% of<br />
the individuals with college degrees working in S&E occupations in 2010 (Table 4). Not surprisingly, this<br />
aggregate statistic masks considerable variation within major S&E occupational categories. In 2010,<br />
women comprised nearly 60% of social scientists and almost half of biologists, whereas women made<br />
up fewer than 13% of engineers. Between 1993 and 2010 women made modest gains in participation in<br />
all S&E occupations with the exception of computer and mathematical scientists, where the proportion<br />
of women actually declined by nearly 6 percentage points. Women are also underrepresented among<br />
individuals with a highest degree in S&E, despite having made modest gains in S&E degree level<br />
attainment between 1993 and 2010.<br />
22 REVISITING THE STEM WORKFORCE