

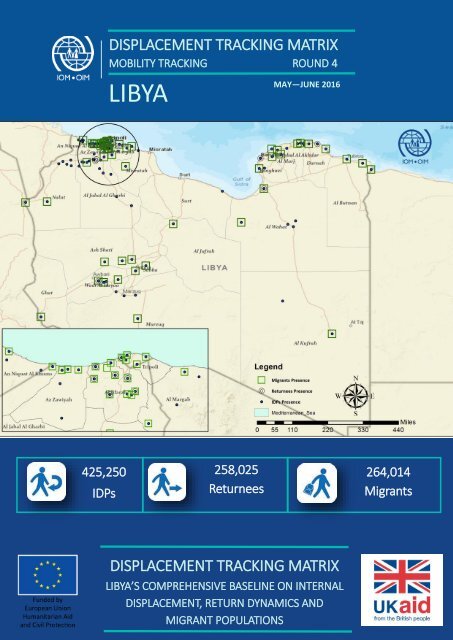
LIBYA
Libya%20Displacement%20Tracking%20Matrix%20(DTM)%20Round%20Four%20Report%20-%20IOM
Libya%20Displacement%20Tracking%20Matrix%20(DTM)%20Round%20Four%20Report%20-%20IOM

Create successful ePaper yourself
Turn your PDF publications into a flip-book with our unique Google optimized e-Paper software.
DISPLACEMENT TRACKING MATRIX<br />
MOBILITY TRACKING ROUND 4<br />
<strong>LIBYA</strong><br />
MAY—JUNE 2016<br />
425,250<br />
IDPs<br />
258,025<br />
Returnees<br />
264,014<br />
Migrants<br />
DISPLACEMENT TRACKING MATRIX<br />
<strong>LIBYA</strong>’S COMPREHENSIVE BASELINE ON INTERNAL<br />
DISPLACEMENT, RETURN DYNAMICS AND<br />
MIGRANT POPULATIONS<br />
1<br />
DTM Round 4: May –June 2016
<strong>LIBYA</strong> AREA REFERENCE MAP<br />
Figure 1: Reference Map of Areas in Libya<br />
DTM is designed to support the humanitarian community with demographic baselines needed to coordinate evidence-based<br />
interventions. DTM’s Mobility Tracking package includes analytical reports, datasets, maps, interactive dashboards and websites on the<br />
numbers, demographics, locations of origin, displacement and movement patterns, and primary needs of mobile populations.<br />
DTM Libya<br />
Co-funded by the European Union* and DFID, the Displacement Tracking Matrix (DTM) in Libya tracks and monitors population<br />
movements in order to collate, analyze and share information packages on Libya’s Internally Displaced Persons (IDPs), returnees and<br />
migrant populations.<br />
*This document covers humanitarian aid activities implemented with the financial assistance of the European Union. The views<br />
expressed herein should not be taken, in any way, to reflect the official opinion of the European Union, and the European Commission<br />
is not responsible for any use that may be made of the information it contains.<br />
2<br />
DTM Round 4: May –June 2016
1<br />
SITUATION<br />
<strong>LIBYA</strong><br />
UPDATE<br />
Ongoing conflict in many parts of Libya has produced new<br />
displacements during the Round 4 reporting period.<br />
Growing insecurity with the escalation of the military<br />
conflict in Sirte between forces loyal to the Government of<br />
National Accord and Da’esh militants has led many of those<br />
living in Sirte to flee to neighbouring areas since the<br />
beginning of May. As the conflict continues, there is a<br />
concern that further displacement will take place in the<br />
region.<br />
Other issues exacerbating Libya’s displacement crisis include<br />
a limitation in basic public services being provided by the<br />
government, including the extension of electricity, clean<br />
water, and basic infrastructural repair; economically, the<br />
country is facing high inflation and cash liquidity constraints.<br />
Limitations on the amount of cash Libyans can access,<br />
combined with delays in the payment of salaries to public<br />
service employees and a rise in informal market activity, has<br />
rendered many basic and necessary items such as food and<br />
rent unaffordable for many of those displaced.<br />
This has also placed additional pressure on host<br />
communities, which are having difficulty in obtaining such<br />
items to meet their own needs let alone the needs of the<br />
IDPs they host. While no significant tensions have been<br />
reported between IDPs and the communities hosting them,<br />
humanitarian organizations have indicated that the<br />
increased stress might make these relations unsustainable in<br />
the long-term. While the central bank has been extending<br />
credit and printing bank notes to ease this constraint,<br />
concerns continue about the sustainability of such policies.<br />
Communities hosting IDPs have reported a need for such<br />
items as refrigerators to keep food from spoiling and water<br />
cold, needs which become particularly apparent now during<br />
the warmer summer months and the Ramadan season. Fuel<br />
shortages and poor road conditions have made it difficult to<br />
transport food and other items between cities.<br />
At the same time, large parts of the country are<br />
experiencing a restoration of calm following the cessation of<br />
conflict or signing of reconciliation agreements between<br />
different factions. As a result, an increasing number of<br />
returnees has been recorded by DTM’s Mobility Tracking.<br />
Returnees face the additional challenge of reconstruction<br />
and repair of their communities. Some neighbourhoods<br />
where conflict has ended continue to await demining,<br />
corpse management and pest control teams to undertake<br />
work there, before further returns can be safely facilitated.<br />
In this round, DTM’s Mobility Tracking identified 264,014<br />
migrants residing in Libya. During May, several maritime<br />
incidents that occurred in the western coastal areas of the<br />
country highlighted the limitations in the capacity of actors<br />
involved in Search and Rescue in Libya. This is constraining<br />
their ability to optimize the safety and effectiveness of their<br />
operations.<br />
DTM continues to inform and support the international<br />
community’s humanitarian response in Libya: data reported<br />
by DTM has provided the information base for other<br />
agencies to plan interventions and deliver assistance. DTM is<br />
also informing Libya’s Humanitarian Response Plan.<br />
In Round 4, DTM identified 425,250 IDPs, 258,025<br />
returnees and 264,014 migrants (findings on migrants also<br />
may include persons who originate from refugee producing<br />
countries) in Libya. DTM Libya maintained its geographic<br />
coverage established in Round 3, conducting assessments<br />
in all accessible areas of the country, covering 100 out of<br />
104 areas. Field assessments were conducted in 516 out of<br />
a total of 667 locations: an increase of 64 locations covered<br />
since Round 3.<br />
Table 1: DTM Coverage Across Rounds 2,3, and 4<br />
Change R2 to R3<br />
Change R3 to R4<br />
R2 # Ind % R3 # Ind % R4<br />
Areas Assessed 99 1 1% 100 - 0% 100<br />
Locaions Assessed 476 -24 -5% 452 64 14% 516<br />
Identified IDPs (# Ind) 331,622 85,501 26% 417,123 8,127 2% 425,250<br />
Identified Returnees (#Ind) 150,362 -1202 -1% 149,160 108,865 73% 258,025<br />
Identified Migrants (#Ind) 142,370 92,299 65% 234,669 29,345 13% 264,014<br />
Notes: In Round 3, Benghazi was added to areas of coverage, explaining the large increase in IDP figures.<br />
Between Round 2 and Round 3, DTM modified the indicators for returnees. In Round 2, returnee patterns between 2011 and 2015 were captured.<br />
From Round 3 onwards, DTM returnee patterns from 2015 and 2016 were captured.<br />
3<br />
DTM Round 4: May –June 2016
2<br />
KEY<br />
INTERNALLY DISPLACED PERSONS (IDPs)<br />
POINTS<br />
425,250 IDPs IDENTIFIED IN 95 OF 100 ASSESSED AREAS (84,750 households)<br />
88.3 % OF IDENTIFIED IDPS HAVE BEEN DISPLACED SINCE MID-2014<br />
OVERVIEW<br />
In its fourth round of data collection, DTM identified and located 425,250 IDP individuals (84,750 households) in 95 of 100<br />
assessed areas.<br />
Figure 2: Areas of Current Residence for IDPs<br />
IDPs BY TIME OF DISPLACEMENT<br />
The 84,750 IDP households (425,250 individuals) identified<br />
in the current round of data collection are the result of<br />
three waves of displacement.<br />
The first wave of displacement took place in 2011, at the<br />
time of the Libyan revolution. Of those who were<br />
displaced, an estimated 8,049 households continue to be<br />
in a situation of displacement across 31 areas. 73.7% are<br />
from Tawergha (5,932 households), 14.9% from Benghazi<br />
(1,200 households), and 8.9% from Misratah (720<br />
households). The remaining 2.4% (197 households) who<br />
were displaced at the time are from Mashashiya, Gwalesh,<br />
Kikla, Al Qal’ah and Mizdah.<br />
Table 2: Time of IDP Displacement<br />
Time #HH %<br />
Current Areas of<br />
Displacement<br />
In 2011 8,049 9.5% 31<br />
2012 to mid-2014 1,876 2.2% 14<br />
Since mid-2014 74,825 88.3% 85<br />
Total 84,750 100.0%<br />
4<br />
DTM Round 4: May –June 2016
2<br />
KEY<br />
INTERNALLY DISPLACED PERSONS (IDPs)<br />
POINTS<br />
IDPs IN <strong>LIBYA</strong> WERE DISPLACED OVER THREE PERIODS BETWEEN 2011 AND PRESENT<br />
BENGHAZI, SIRTE AND TAWERGHA ARE THE TOP THREE AREAS OF ORIGIN FOR ALL IDPs IN <strong>LIBYA</strong><br />
Table 3: Areas of Origin for Majority of IDPs displaced in 2011<br />
Area of Origin # HH %<br />
1 Tawergha 5,932 73.7%<br />
2 Benghazi 1,200 14.9%<br />
3 Misratah 720 8.9%<br />
4 Mashashiya 90 1.1%<br />
5 Gwalesh 51 0.6%<br />
6 Kikla 48 0.6%<br />
7 Al Qal'ah 5 0.1%<br />
8 Mizdah 3 0.0%<br />
Total 8,049 100.0%<br />
The second wave, which was between February 2012 and<br />
mid-2014, saw 1,876 households displaced during various<br />
clashes between armed groups. 1,204 (64.2%) of these are<br />
from Tawergha, 213 (11.4%) from Sirte and 190 (10.1%)<br />
from Al Kufrah. The remaining 14.3% of IDPs who were<br />
displaced during this time are from Az Zahrah (181<br />
households), Mashashiya (50 households) and Awbari (38<br />
households).<br />
Table 4: Areas of Origin for Majority of IDPs displaced between<br />
2012 and mid-2014<br />
Area of Origin # HH %<br />
1 Tawergha 1,204 64.2%<br />
2 Sirte 213 11.4%<br />
3 Al Kufrah 190 10.1%<br />
4 Az Zahrah 181 9.6%<br />
5 Mashashiya 50 2.7%<br />
6 Awbari 38 2.0%<br />
Total 1,876 100.0%<br />
The third and largest wave of displacement has lasted since<br />
mid-2014 to present. The top three areas of origin for<br />
households displaced since mid-2014 are Benghazi, Sirte,<br />
and Derna, which combined account for 76.5% of IDPs displaced<br />
during this period (36,610 households displaced<br />
from Benghazi, 16,092 households from Sirte, and 4,530<br />
households from Derna).<br />
Table 5: Areas of Origin for Majority of IDPs displaced since<br />
mid-2014<br />
Area of Origin # HH %<br />
1 Benghazi 36,610 48.9%<br />
2 Sirte 16,092 21.5%<br />
3 Derna 4,530 6.1%<br />
4 Abu Salim 3,885 5.2%<br />
5 Tawergha 2,747 3.7%<br />
6 Az Zahrah 2,367 3.2%<br />
7 Awbari 2,311 3.1%<br />
8 Janzour 1,397 1.9%<br />
9 Al Mayah 1,260 1.7%<br />
10 Al Kufrah 1,105 1.5%<br />
11 Mashashiya 564 0.8%<br />
12 As Sidr 512 0.7%<br />
13 Kikla 500 0.7%<br />
14 Al Ajaylat 350 0.5%<br />
15 Tripoli 310 0.4%<br />
16 Aljmail 250 0.3%<br />
17 Tarhuna 35 0.0%<br />
Total 74,825 100.0%<br />
TOP AREAS OF ORIGIN FOR ALL IDPs<br />
The IDPs identified in this reporting period originate mainly<br />
from 21 areas in Libya. The top 3 areas of origin (Benghazi,<br />
Sirte, and Tawergha) account for 75.3% of all IDPs<br />
displaced at present. The population of Benghazi has been<br />
most severely impacted by conflict: 37,810 out of the<br />
84,570 households currently displaced in Libya are from<br />
Benghazi (44.5%). There are an estimated 16,305 IDP<br />
households from Sirte (19.2% of total IDPs), and 9,838 IDP<br />
households from Tawergha (11.6%).<br />
Table 6: IDP Areas of Origin Across all Three Waves of<br />
Displacement<br />
Area #HH # Ind %<br />
1 Benghazi 37,810 189,413 44.5%<br />
2 Sirte 16,305 81,674 19.2%<br />
3 Tawergha 9,838 49,191 11.6%<br />
4 Derna 4,530 23,008 5.4%<br />
5 Abu Salim 3,885 19,425 4.6%<br />
6 Az Zahrah 2,548 12,784 3.0%<br />
7 Awbari 2,349 12,334 2.9%<br />
8 Janzour 1,397 6,985 1.6%<br />
9 Al Mayah 1,305 6,525 1.5%<br />
10 Al Kufrah 1,295 6,475 1.5%<br />
Other (11 areas) 3,488 17,436 4.1%<br />
Total 84,750 425,250 100.0%<br />
5<br />
DTM Round 4: May –June 2016
2<br />
INTERNALLY DISPLACED PERSONS (IDPs)<br />
KEY POINTS<br />
<br />
The following table lists the top 10 areas of origin for the majority of IDPs in Libya and the areas to which they are have<br />
been displaced.<br />
Table 7: IDP Individuals by Areas of Origin and Current Residence<br />
Area of Origin Total IDPs Area of Current Residence # Ind %<br />
Benghazi 115,000 60.7%<br />
1 Benghazi 189,413<br />
Al Bayda 21,500 11.4%<br />
Ajdabiya 16,520 8.7%<br />
Other (19 areas) 36,393 19.2%<br />
Bani Waled 32,400 39.7%<br />
2 Sirte 81,674<br />
Abu Salim 14,240 17.4%<br />
Tarhuna 9,350 11.4%<br />
Other (15 areas) 25,684 31.4%<br />
Ajdabiya 12,620 25.7%<br />
3 Tawergha 49,191<br />
Abu Salim 5,885 12.0%<br />
Sabha 5,365 10.9%<br />
Other (35 areas) 25,321 51.5%<br />
Tobruk 16,043 69.7%<br />
4 Derna 23,008<br />
Derna 4,380 19.0%<br />
Shahat 1,525 6.6%<br />
Umm ar Rizam 1,060 4.6%<br />
5 Abu Salim 19,425 Alzintan 19,425 100.0%<br />
Az Zawiyah 8,650 67.7%<br />
6 Az Zahrah 12,784<br />
Al Mayah 2,400 18.8%<br />
Al Ajaylat 1,350 10.6%<br />
Riqdalin 384 3.0%<br />
Al Ghurayfah 3,133 25.4%<br />
7 Awbari 12,334<br />
Dirj 1,975 16.0%<br />
Murzuq 1,960 15.9%<br />
Other (10 areas) 5,266 42.7%<br />
8 Janzour 6,985 Janzour 6,985 100.0%<br />
Az Zahrah 2,825 43.3%<br />
9 Al Mayah 6,525 Al Aziziyah 2,200 33.7%<br />
Sabratah 1,500 23.0%<br />
Jalu 2,500 38.6%<br />
10 Al Kufrah 6,475<br />
Al Sharqiyah 2,135 33.0%<br />
Ajdabiya 950 14.7%<br />
Other (2 areas) 890 13.7%<br />
Other (11 areas) 17,436<br />
Total 425,250<br />
6<br />
DTM Round 4: May –June 2016
2<br />
KEY<br />
INTERNALLY DISPLACED PERSONS (IDPs)<br />
POINTS<br />
52.4% OF <strong>LIBYA</strong>’S IDP POPULATION IS CURRENTLY RESIDING IN FIVE AREAS: BENGHAZI, BANI WALED, AJDABIYA, AL<br />
BAYDA AND ABU SALIM<br />
IDP AREAS OF CURRENT RESIDENCE<br />
95 of the 100 assessed areas in Libya are currently hosting IDPs. The top five areas where IDPs are currently residing are<br />
Benghazi (115,000 individuals), Bani Waled (36,000 individuals), Ajdabiya (30,090 individuals), Al Bayda (21,500 individuals),<br />
and Abu Salim (20,125 individuals), together hosting 52.4% of the country’s IDP population. Some areas, like Benghazi and<br />
Al Bayda, are hosting IDPs originating primarily from one area only. Others, such as Bani Waled and Ajdabiya are hosting<br />
IDPS coming from a number of different areas of origin.<br />
Benghazi alone is hosting an estimated 115,000 IDP individuals. Bani Waled is hosting IDPs primarily from Sirte and<br />
Misratah. Ajdabiya is hosting IDPs primarily from Benghazi, Tawergha, and Al Kufrah.<br />
The table below provides a breakdown of top 10 areas of current residence of IDPs and their primary areas of origin.<br />
Table 8: IDPs by Current Residence and Main Areas of Origin<br />
Area of Current Residence Total IDPs Area of Origin IDPs (#Ind) %<br />
1 Benghazi 115,000 Benghazi 115,000 100.0%<br />
2 Bani Waled 36,000<br />
Misratah 3,600 10.0%<br />
Sirte 32,400 90.0%<br />
Al Kufrah 950 3.2%<br />
3 Ajdabiya 30,090 Benghazi 16,520 54.9%<br />
Tawergha 12,620 41.9%<br />
4 Al Bayda 21,500 Benghazi 21,500 100.0%<br />
5 Abu Salim 20,125<br />
Sirte 14,240 70.8%<br />
Tawergha 5,885 29.2%<br />
6 Alzintan 19,425 Abu Salim 19,425 100.0%<br />
7 Tobruk 16,733<br />
8 Tarhuna 11,850<br />
9 Janzour 10,105<br />
10 Az Zawiyah 8,890<br />
Derna 16,043 95.9%<br />
Tawergha 690 4.1%<br />
Sirte 9,350 78.9%<br />
Tawergha 2,500 21.1%<br />
Janzour 6,985 69.1%<br />
Tawergha 3,120 30.9%<br />
Az Zahrah 8,650 97.3%<br />
Kikla 240 2.7%<br />
Other (85 areas) 135,532<br />
Total 425,250<br />
7<br />
DTM Round 4: May –June 2016
2<br />
INTERNALLY<br />
DISPLACED PERSONS (IDPs)<br />
Figure 3: Movement of IDPs from Top 5 Areas of Origin<br />
The map below displays the movement patterns of IDPs from the top 5 areas of origin in Libya.<br />
8<br />
DTM Round 4: May –June 2016
2<br />
INTERNALLY<br />
DISPLACED PERSONS (IDPs)<br />
KEY POINTS<br />
95.7% OF IDPs CITED FEAR OF GENERAL CONFLICT AND ARMED GROUP PRESENCE AS MAIN DISPLACEMENT DRIVER<br />
IDP DISPLACEMENT PATTERNS DETERMINING AREA OF RESIDENCE INFLUENCED BY SOCIAL TIES<br />
IDPs FROM TAWERGHA ARE THE MOST WIDELY DISPERSED, RESIDING IN 38 DIFFERENT AREAS IN <strong>LIBYA</strong><br />
IDP DISPLACEMENT PATTERNS<br />
Fear from general conflict and the presence of armed<br />
groups has been the primary reported displacement<br />
driver for identified IDPs, accounting for the displacement<br />
of an estimated 81,064 households (95.7%).<br />
IDP displacement patterns in Libya are strongly governed<br />
by social ties. These social bonds mean that IDPs are often<br />
hosted by family members or other members of their<br />
social network if they are unable to pay for their own<br />
accommodation. The most vulnerable are IDPs who, as a<br />
result of socio-economic, ethnic or political<br />
marginalization do not have access to such social capital,<br />
and are residing in public or informal settings.<br />
Table 9: Reasons for IDP Displacement<br />
Reason for IDP Displacement #HH %<br />
Threat/fear from general conflict<br />
and armed group presence 81,064 95.7%<br />
Other security related issues (e.g.<br />
political affiliation) 2,351 2.8%<br />
Economic reasons 1,335 1.6%<br />
Total 84,750 100.0%<br />
IDPs from Benghazi were displaced to 22 areas of the country. 60.7% of them (115,000 individuals) were displaced within<br />
Benghazi itself, and the remainder left either to nearby areas, including Al Bayda, Ajdabiya, Slukh, and Tocra, with others<br />
travelling further away, to Al Kufrah, or Zliten. The following table provides a more detailed breakdown of the top 10<br />
current areas of residence for IDPs originating from Benghazi.<br />
Similarly, IDPs from Sirte and Tawergha were displaced across a large number of areas. IDPs from Sirte are reported to be<br />
residing in 18 different areas, the primary ones being Bani Waled, Abu Salim and Tarhuna. IDPs from Tawergha are the<br />
most widely dispersed across the country, reported to be residing in 38 different areas across the country.<br />
IDPs from Derna, Abu Salim, and Az Zahra, on the other hand, were displaced across a smaller geographical area. IDPs from<br />
Derna are reported to be residing in Tobruk, Derna, Shahat and Umm ar Rizam. Al Zintan is the main area of residence for<br />
IDPs identified as originating from Abu Salim. IDPs from Az Zahra however are dispersed across four areas: Az Zawiyah, Al<br />
Mayah, Al Ajaylat, and Riqdalin.<br />
IDPs FROM TAWERGHA<br />
Tawerghans are the third largest population of IDPs and are<br />
the most widely dispersed across the country, currently<br />
residing in 38 areas all around Libya, with large<br />
concentrations in Ajdabiya, Abu Salim, Sabha and Janzour.<br />
Tawergha populations are particularly vulnerable, many of<br />
them having been displaced multiple times over the course<br />
of the past five years: for example, most Tawerghans who<br />
were displaced to Benghazi in 2011, were displaced again<br />
due to the escalation of conflict in Benghazi in mid-2014.<br />
Many currently live in public or informal settings,<br />
experiencing physical insecurity due to the prevalence of<br />
raids and crime in their areas of residence, and socioeconomic<br />
marginalization. The following are the top 10<br />
areas of residence for IDPs from Tawergha.<br />
Table 10: Main Areas of Residence for IDPs from Tawergha<br />
Area of Current Residence # Ind %<br />
1 Ajdabiya 12,620 25.7%<br />
2 Abu Salim 5,885 12.0%<br />
3 Sabha 5,365 10.9%<br />
4 Janzour 3,120 6.3%<br />
5 Tarhuna 2,500 5.1%<br />
6 Baten Al Jabal 2,250 4.6%<br />
7 Surman 2,165 4.4%<br />
8 Adiri 1,535 3.1%<br />
9 Ain Zara 1,425 2.9%<br />
10 Sawani Bin Adam 1,425 2.9%<br />
Other (28 areas) 10,901 22.2%<br />
Total 49,191 100.0%<br />
9<br />
DTM Round 4: May –June 2016
2<br />
INTERNALLY DISPLACED PERSONS (IDPs)<br />
Figure 4: Displacement of IDPs from Tawergha to Current Areas of Residence<br />
10<br />
DTM Round 4: May –June 2016
2<br />
INTERNALLY DISPLACED PERSONS (IDPs)<br />
KEY POINTS<br />
AN INCREASE IN DISPLACEMENT FROM SIRTE WAS RECORDED IN ROUND 4<br />
THE TOP AREAS CURRENTLY HOSTING IDPS FROM SIRTE ARE BANI WALED, ABU SALIM AND MISRATAH<br />
SPOTLIGHT: DISPLACEMENT FROM SIRTE<br />
During the fourth round of data collection, a large number<br />
of IDPs were displaced from Sirte to the surrounding area.<br />
Conflict broke out on May 6th following a period of rising<br />
insecurity, and in the weeks that followed, residents of Sirte<br />
have fled primarily to Bani Waled, Abu Salim, Misratah,<br />
Figure 5: Displacement of IDPs from Sirte to Current Areas of<br />
Residence*<br />
number of IDPs identified as originating from Sirte between<br />
Round 3 and Round 4, and interviews with local<br />
humanitarian organizations during the reporting period<br />
indicated that further displacement was expected if the<br />
conflict were to escalate or continue.<br />
The recent influx of IDPs from Sirte has left host<br />
communities facing challenges in accommodating their<br />
shelter, medical, WASH and protection needs. A Rapid IDP<br />
Protection Needs Assessment conducted by UNHCR/Reach<br />
on IDPs from Sirte in May 2016 found that only 1 – 25% of<br />
IDP families from Sirte are currently self—sufficient, and<br />
protection services are insufficient or very insufficient in<br />
their current area of residence. Furthermore, high rent has<br />
been cited as a significant concern, with IDPs being unable<br />
to afford renting accommodation, or facing threat of<br />
eviction from their residence. Water and sanitation<br />
conditions in IDP camps are poor and deteriorating, and<br />
hospitals are facing both a shortage of medical supplies and<br />
space to accommodate the communities they are serving ii .<br />
Humanitarian actors have indicated that the biggest<br />
challenges faced in reception and assistance of IDPs has<br />
been related to furnishing and preparing basic shelter<br />
facilities quickly enough to accommodate incoming<br />
households. If the conflict continues, there will be a need to<br />
work on longer-term solutions to address the needs of IDPs<br />
displaced in these areas.<br />
*Displacement to Misratah not mapped<br />
Tarhuna, Tripoli, and Al Jufrah. The map above shows<br />
movement of IDPs from Sirte to their areas of current<br />
residence.<br />
35.8% (32,400 individuals) of all IDPs who have been<br />
displaced from Sirte to date are being hosted in Bani Waled;<br />
Abu Salim is hosting 14,240 individuals (15.7%), Misratah is<br />
hosting 8,775 individuals (9.7%) i and Tarhuna 9,350<br />
individuals (10.3%). There was a 49% increase in the<br />
Table 11: Current Residence of IDPs from Sirte<br />
Area # Ind %<br />
1 Bani Waled 32,400 35.8%<br />
2 Abu Salim 14,240 15.7%<br />
3 Misratah** 8,775 9.7%<br />
4 Tarhuna 9,350 10.3%<br />
5 Tripoli 6,250 6.9%<br />
6 Al Jufrah 6,011 6.7%<br />
7 Al Khums 4,440 4.9%<br />
8 Ain Zara 2,405 2.7%<br />
9 Mizdah 1,250 1.4%<br />
10 Garaboli 1,250 1.4%<br />
11 Other (9 areas) 4,078 4.5%<br />
Total 90,449 100.0%<br />
*Estimate obtained from the Misratah Local Crisis Committee during an<br />
UNSMIL-UNCT inter-agency assessment conducted on June 6, 2016 in<br />
Misratah.<br />
11<br />
DTM Round 4: May –June 2016
2<br />
KEY<br />
INTERNALLY DISPLACED PERSONS (IDPs)<br />
POINTS<br />
50.6% OF IDPS SAMPLED WERE REPORTED AS FEMALE<br />
50.3% OF THE SAMPLE WAS BELOW THE AGE OF 18<br />
SEX AND AGE DISAGGREGATED IDP DATA<br />
Figure 6: IDP Ratio as Determined by Sample<br />
46,074 individuals were sampled to obtain sex and age<br />
disaggregated data (SADD) over the last three rounds of<br />
reporting. Based on the information provided, 49.4% of<br />
those sampled were identified as male and 50.6% as<br />
female. Half (50.3%) of the sample was below the age of<br />
18, 39.7% was an adult population under the age of 60,<br />
and the remaining 10% consisted of an older adult<br />
population over the age of 60. The average household size<br />
emerging in the survey was 5 members.<br />
Half of the IDP population sampled is below the age of 18.<br />
Local organizations reported increases in trauma and<br />
psychosocial issues that children in IDP households are<br />
experiencing. Concerns for youth included an excess of<br />
free time and boredom, occasionally leading to unhealthy<br />
social behaviour due to the lack of opportunities and<br />
outlets for them.<br />
Female-headed IDP households face particular challenges,<br />
in spite of the strong social ties within the Libyan<br />
population that can provide a social safety net. In<br />
Benghazi, for example, while widows are guaranteed a<br />
pension and social security by the state, the difficulty in<br />
accessing legal and administrative institutions has<br />
hindered their ability to register and claim their pensions.<br />
Many local humanitarian organizations are thus focusing<br />
on assisting women to access income through microprojects<br />
to provide them with a means of sustaining their<br />
livelihood.<br />
Table 12: Age and Sex Disaggregation of IDPs<br />
Age M % M F % F Total % of Total<br />
0-1 1,894 8% 1,619 7% 3,513<br />
7.6%<br />
1 – 5 3,753 17% 4,386 19% 8,139<br />
17.7%<br />
6 – 17 5,666 25% 5,846 25% 11,512 25.0%<br />
18 – 59 9,000 40% 9,308 40% 18,308<br />
39.7%<br />
60+ 2,426 11% 2,176 9% 4,602<br />
10.0%<br />
Total 22,739 100% 23,335 100% 46,074<br />
100.0%<br />
12<br />
DTM Round 4: May –June 2016
2<br />
KEY<br />
INTERNALLY DISPLACED PERSONS (IDPs)<br />
POINTS<br />
19.7% OF IDPS (16,701 HOUSEHOLDS) ARE REPORTED TO BE LIVING IN PUBLIC OR INFORMAL SETTINGS<br />
PUBLIC OR INFORMAL SHELTERS ARE LOCATED MAINLY IN BENGHAZI, BANI WALED AND ABU SALIM<br />
TYPE OF ACCOMMODATION FOR IDPs<br />
Of the 84,705 IDP households identified in the fourth round<br />
of data collection, 50,563 households (59.7%) live in private<br />
accommodation, either self-paying (37,762 households),<br />
staying with host families who are relatives (10,049<br />
households), host families who are not relatives (2,047<br />
households), or in rented accommodation paid by others<br />
(705 households). Another 16,701 households (19.7%) live<br />
in informal or public settings which can include schools<br />
(8,916 households), tents, caravans, or makeshift shelters<br />
(2,950 households), unfinished buildings (2,976<br />
households), deserted resorts (763 households), or they<br />
may be squatting on other peoples’ properties (75<br />
households). The remaining 17,486 IDP households (20.6%)<br />
are in an unknown shelter setting.<br />
There are different types of challenges IDPs face specific to<br />
the type of accommodation they are living in. Inflation in<br />
Libya, along with a liquidity crisis that limits the amount of<br />
money people can withdraw on a monthly basis, makes the<br />
threat of eviction a primary concern for those who are<br />
renting. Those living in public and informal settings are the<br />
most vulnerable populations, experiencing lack of access to<br />
basic services, poor WASH facilities, overcrowding and a<br />
lack of privacy.<br />
Camps are often spaces of physical insecurity, being sites of<br />
crime, raids, or other forms of violence. Furthermore, IDPs<br />
in such settings experience socio-economic marginalization,<br />
having impaired access to financial assistance or livelihood<br />
opportunities. In shelters where access to toilets is difficult,<br />
many women and children experience additional challenges<br />
in maintaining their personal safety and security.<br />
Table 13: Types of Accommodation for IDPs<br />
Shelter Type # HH %<br />
44.8%<br />
Rented accommodation (self-pay) 37,762<br />
11.8%<br />
Host families who are relatives 10,049<br />
2.4%<br />
Host families who are not relatives 2,047<br />
Rented accommodation (paid by<br />
0.8%<br />
others) 705<br />
10.5%<br />
Schools 8,916<br />
Informal settings (e.g. tents, caravans,<br />
3.5%<br />
makeshift shelters) 2,950<br />
3.5%<br />
Unfinished buildings 2,976<br />
1.2%<br />
Other public buildings 1,021<br />
0.9%<br />
Deserted resorts 763<br />
Squatting on other people’s properties<br />
0.1%<br />
(e.g. in farms, flats, houses) 75<br />
20.6%<br />
Unknown 17,486<br />
Total 84,705<br />
100.0%<br />
In areas where schools are being used as shelters for IDPs,<br />
functioning educational facilities are experiencing<br />
overcrowding and a lack of capacity as they work to meet<br />
the needs of all students. To accommodate students,<br />
schools operate over multiple shifts within the day and<br />
week; yet often their poor condition, which can include<br />
inadequate WASH facilities, makes them inaccessible<br />
especially for female students.<br />
13<br />
DTM Round 4: May –June 2016
2<br />
INTERNALLY<br />
DISPLACED PERSONS (IDPs)<br />
AREAS WITH IDP COLLECTIVE AND INFORMAL SHELTERS<br />
Figure 7: IDP Collective and Informal Shelters<br />
14<br />
DTM Round 4: May –June 2016
2<br />
AREAS WITH IDP COLLECTIVE AND INFORMAL SHELTERS<br />
INTERNALLY DISPLACED PERSONS (IDPs)<br />
Total 2,950 763 8,916 1,021 2,976 75 50,563 17,486 84,750 59.7% 19.7% 20.6%<br />
Other (85 areas) 296 174 202 467 926 75 35,406 - 37,546 5.7% 94.3% 0.0%<br />
Al Marj - - - - 260 - 380 - 640 59.4% 40.6% 0.0%<br />
Qaminis - 140 - 130 - - 370 - 640 57.8% 42.2% 0.0%<br />
Ghat - - - - 450 - - - 450 0.0% 100.0% 0.0%<br />
Tarhuna 470 - - - - - 1,900 - 2,370 80.2% 19.8% 0.0%<br />
Al Kufrah - - - - 600 - 240 - 840 28.6% 71.4% 0.0%<br />
Janzour - 449 - 424 - - 1,148 - 2,021 56.8% 43.2% 0.0%<br />
Ajdabiya 1,080 - - - - - 4,938 - 6,018 82.1% 17.9% 0.0%<br />
Abu Salim 664 - - - 740 - 2,621 - 4,025 65.1% 34.9% 0.0%<br />
Bani Waled 440 - 3,200 - - - 3,560 - 7,200 49.4% 50.6% 0.0%<br />
Benghazi - - 5,514 - - - - 17,486 23,000 0.0% 24.0% 76.0%<br />
Area<br />
#HH in # HH in<br />
Informal Abandoned<br />
Settings Resorts<br />
# HH in<br />
Schools<br />
# HH in # HH in<br />
# HH<br />
Public Unfinished<br />
Squatting<br />
Buildings Buildings<br />
# HH in<br />
Private<br />
Settings<br />
# HH in<br />
unknown<br />
shelter<br />
types<br />
% in<br />
Total # HH private<br />
settings<br />
% in public<br />
settings<br />
%<br />
Unknown<br />
Table 14: Top 10 Areas with IDPs in Public/Informal Settings<br />
15<br />
DTM Round 4: May –June 2016
3<br />
INTERNALLY<br />
DISPLACED PERSONS - RETURNS<br />
KEY POINTS<br />
258,025 RETURNEES WERE IDENTIFIED IN 13 AREAS IN ROUND 4<br />
TOP 3 AREAS WHERE RETURNS WERE REPORTED ARE AL MAYAH, AZ ZAHRAH AND BENGHAZI<br />
Figure 8: Areas with Returnees<br />
Although some areas in Libya continue to experience conflict, in many areas of the country a sufficient level of calm and<br />
security has been restored following ceasefires or reconciliation agreements for those who had left their homes to begin<br />
the process of return.<br />
In Round 4 , 258,025 returnees (51,605 households) are reported to have returned to 13 different areas from the start of<br />
2015 to the present in Libya. 69.8% of all returns recorded were in three areas: Al Mayah (70,000 individuals), Az Zahrah<br />
(60,000 individuals), and Benghazi (50,000 individuals).<br />
The largest increase in reported returns since Round 3 were in Al Mayah, Az Zahrah and Al Aziziyah. Al Mayah had a 73%<br />
increase in returnees between Round 3 and Round 4, from 40,550 individuals to 70,000 individuals, and returnees to Az<br />
Zahrah rose by 63% from 36,775 to 60,000 individuals. Other returns to Al Aziziyah, Awbari, Sawani Bin Adam and Kikla,<br />
are ongoing following the cessation of conflict in those areas.<br />
16<br />
DTM Round 4: May –June 2016
3<br />
INTERNALLY DISPLACED PERSONS - RETURNS<br />
KEY POINTS<br />
<br />
<br />
IN BENGHAZI, RETURNS TO LAITHI, BUATNI AND BALOUN DISTRICTS WERE REPORTED<br />
MANY IDPs ARE AWAITING REPAIR OF INFRASTRUCTURE AND RESTORATION OF UTILITIES BEFORE RETURNING<br />
RETURN TRENDS<br />
Return comes with its own set of challenges. High inflation<br />
and the devaluation of the Libyan dinar, combined with<br />
restrictions on cash withdrawals, have meant an increase in<br />
the cost of rent and basic food stuffs. This has left many<br />
IDPs struggling to afford rent in their current<br />
accommodation, and facing the risk of eviction. With their<br />
financial resources being channelled towards covering the<br />
expenses of daily life, little is left to dedicate to rebuilding<br />
or repairing their original homes. Many IDPs are also<br />
awaiting the completion of basic infrastructure repairs<br />
(extension of electricity and clean water) being carried out<br />
by government authorities before returning.<br />
In Benghazi, fighting was concentrated in urban spaces,<br />
leaving many homes looted and damaged, and schools and<br />
roads destroyed. To date, 50,000 individuals (19.4% of all<br />
returnees) are reported to have returned to Benghazi,<br />
particularly to the Laithi, Buatni, and Baloun districts where<br />
the majority of residents are now back. An appraisal<br />
committee in Benghazi has been formed to evaluate the<br />
number of damaged homes to b able to identify the<br />
number of IDPs who are unable to return more accurately.<br />
IDPs are reported to be returning to the Hawari district, and<br />
are expected to return to the Gwarsha district during the<br />
coming weeks. However, it is unknown when IDPs will<br />
return to the Sabri district and the center of Benghazi, as<br />
the army has prohibited returns until those areas are<br />
cleared of mines.<br />
Table 15: Primary Areas of Return, 2015—2016<br />
Current Area # Ind # HH %<br />
1 Al Mayah 70,000 14,000 27.1%<br />
2 Az Zahrah 60,000 12,000 23.3%<br />
3 Benghazi 50,000 10,000 19.4%<br />
4 Al Aziziyah 32,900 6,580 12.8%<br />
5 Sawani Bin Adam 16,275 3,255 6.3%<br />
6 Qasr Bin Ghashir 10,750 2,150 4.2%<br />
7 Awbari 10,000 2,000 3.9%<br />
8 Kikla 2,950 590 1.1%<br />
9 Hai Alandalus 1,750 350 0.7%<br />
10 Derna 1,500 300 0.6%<br />
11 Sidi al Saeh 1,000 200 0.4%<br />
12 Gwalesh 500 100 0.2%<br />
13 Ajdabiya 400 80 0.2%<br />
Total 258,025 51,605 100%<br />
Aside from concerns about physical infrastructure and<br />
access to services, returnees are also worried about the<br />
level of crime and looting incidents in their areas. In the<br />
absence of rule of law and prevalence of criminal activity,<br />
many returnees are taking their personal safety into<br />
consideration when making the decision to return, and it is<br />
expected that with a restoration of legal institutions and<br />
law enforcement, further returns will take place.<br />
Although security in Awbari has been restored to a<br />
sufficient level for some returnees to go back to their<br />
homes, the area still requires significant infrastructure<br />
repair and maintenance work . As a result, It is expected<br />
that returns to the area will increase over the coming<br />
months as progress is made to this end.<br />
17<br />
DTM Round 4: May –June 2016
4<br />
MIGRANTS<br />
KEY POINTS<br />
DTM ROUND 4 IDENTIFIED AND LOCATED 264,014 MIGRANTS IN 55 AREAS IN <strong>LIBYA</strong><br />
<br />
MAIN AREAS WITH MIGRANTS REPORTED AS PRESENT ARE AIN ZARA, ABU SALIM AND TAJOURA<br />
To date, DTM Mobility Tracking has identified and located<br />
264,014 migrants, in 55 areas and 316 locations across the<br />
country.<br />
IOM defines a migrant as any person who is moving or has<br />
moved across an international border or within a state away<br />
from his/her habitual place of residence, regardless of (1)<br />
the person’s legal status; (2) whether the movement is<br />
voluntary or involuntary; (3) what the causes for the<br />
movement are; or (4) what the length of the stay is. For<br />
DTM programmatic purposes in Libya, a migrant is<br />
considered any person present in Libya who does not<br />
possess Libyan nationality. As such, DTM does not<br />
differentiate between migrant statuses, length of residence<br />
in the country, or migratory intentions. It counts as migrants<br />
those who may have come from refugee producing<br />
countries, along with long-term residents and labour<br />
migrants who engage in a circular migration pattern<br />
between Libya and their homes*.<br />
Libya has traditionally been a country of destination, transit<br />
and circular migration. Libyan non-nationals in the country<br />
tend to work in a variety of sectors including restaurants,<br />
vocational industries including carpentry or the marble<br />
industry, construction, agriculture, shepherding, domestic<br />
work, public or municipal cleaning services, or the<br />
healthcare industry. Some may have left their countries due<br />
to a lack of economic opportunities, while others may have<br />
left due to the prevalence of conflict or insecurity.<br />
There are several methodological complications associated<br />
with identifying and locating migrants, and determining<br />
their motives which will often adapt to their changing<br />
circumstances. Migrants may be in Libya having intended to<br />
engage in circular labour migration, whereby they travel to<br />
and from their country regularly as a way of gaining income.<br />
However, along their journey or once in Libya, they may<br />
decide, or be coerced, into embarking on a journey to<br />
Europe. Conversely, other migrants may arrive to Libya<br />
intending only to transit, with Europe as their final<br />
destination. Yet for a number of reasons that could include<br />
a shortage of money, detainment, or fear of making the<br />
risky journey across the Mediterranean, they may decide<br />
instead to end their journey in Libya, working and<br />
accumulating savings, or returning home.<br />
The wide range of circumstances and motivations of<br />
migrants are thus important to keep in mind when looking<br />
at migrant statistics in Libya. Awareness is also necessary of<br />
migrants’ often precarious situation and heightened<br />
vulnerability as visible minorities. Irregular migrants<br />
especially, or migrants who may have lost their documents<br />
when they were displaced from different parts of the<br />
country, are at risk of being arrested and detained at any<br />
time when out in public. Many times, they are kidnapped<br />
and held by militias and only freed once a ransom is paid by<br />
their family or social network.<br />
The four main areas together hosting 48% of all migrants<br />
residing in the country are in the north-western part of<br />
Libya: 45,810 individuals (17.4%) were recorded as residing<br />
in Ain Zara, 39,308 individuals in Abu Salim (14.9%), 21,492<br />
in Tajoura (8.1%) and 20,160 in Msallata (7.6%). There are<br />
also larger migrant populations further south in Al Jufrah<br />
(15,000 individuals) and in Sebha (11,770). The following<br />
table lists the top 10 areas where migrants were reported to<br />
be present in the fourth round of data collection.<br />
Table 16: Areas with Migrant Presence<br />
Area #Ind %<br />
1 Ain Zara 45,810 17.4%<br />
2 Abu Salim 39,308 14.9%<br />
3 Tajoura 21,492 8.1%<br />
4 Msallata 20,160 7.6%<br />
5 Al Jufrah 15,000 5.7%<br />
6 Sabha 11,770 4.5%<br />
7 Alzintan 11,030 4.2%<br />
8 Garaboli 9,415 3.6%<br />
9 Hai Alandalus 8,550 3.2%<br />
10 Ajdabiya 7,650 2.9%<br />
Other (45 areas) 73,829 28.0%<br />
Total 264,014 100.0%<br />
*For specific figures on refugees and asylum seekers in Libya please refer to UNHCR’s latest Monthly Registration Fact Sheet:<br />
18 https://www.humanitarianresponse.info/en/system/files/documents/files/unhcr_registration_fact_sheet_may_2016.pdf<br />
DTM Round 4: May –June 2016
4<br />
MIGRATION<br />
KEY POINTS<br />
MAIN REPORTED NATIONALITIES OF MIGRANTS ARE NIGER, EGYPT, CHAD, GHANA AND SUDAN<br />
<br />
83.3% REPORTED AS MALE, 11.2% AS FEMALE, AND 5.5% AS MINORS<br />
Figure 9: Areas with Migrant Presence<br />
MIGRANT NATIONALITIES<br />
KI’s have reported a number of different nationalities for<br />
migrants identified as residing in their areas. The countries<br />
of origin most frequently cited were Niger, Egypt, Chad,<br />
Ghana and Sudan, in addition to other nationalities from<br />
West Africa, the Horn of Africa, South Asia and the Middle<br />
East.<br />
Table 17: Top Reported Nationalities of Migrants Present in Libya<br />
Nationalities<br />
1 Niger 6 Mali<br />
2 Egypt 7 Nigeria<br />
3 Chad 8 Bangladesh<br />
4 Ghana 9 Gambia<br />
5 Sudan 10 Senegal<br />
MIGRANT DEMOGRAPHICS<br />
83.3% of migrants present in Libya were reported as male<br />
and 11.2% as female. Accompanied children made up<br />
5.3% of the population, with unaccompanied children<br />
making up the remaining 0.2%.<br />
Figure 9: Demographic Breakdown of Identified Migrants<br />
19<br />
DTM Round 4: May –June 2016
4<br />
MIGRATION<br />
KEY POINTS<br />
2016 DID NOT MARK A SIGNIFICANT INCREASE IN ARRIVALS TO ITALY FROM THE MEDITERRANEAN<br />
<br />
IOM’S MISSING MIGRANTS PROJECT RECORDED 2,061 DEATHS ON THE CENTRAL MEDITERRANEAN ROUTE<br />
BETWEEN JANUARY AND MAY 2016<br />
<strong>LIBYA</strong> AND REGIONAL MIGRATION<br />
Migration patterns in and through Libya are interlinked<br />
with regional migrant activity. Interviews with Libyan<br />
humanitarian organizations highlighted the circular<br />
patterns of movement that migrants from Niger engage in<br />
between the two neighbouring countries. interviews<br />
suggest the existence of strong economic and social<br />
linkages between Niger and Libya, with Nigeriens having a<br />
long history of settling and engaging in business activities<br />
in Libya. Analysis done by DTM Niger in its April 2016<br />
Quarterly Flow Monitoring Report supports this, reporting<br />
that 85% of migrants recorded as travelling from Libya to<br />
Niger have Nigerien nationality iii .<br />
Migrants of other nationalities entering Libya through its<br />
southern borders tend to follow similar mobility patterns<br />
in the country*, traveling through the desert to more<br />
densely populated urban areas - a journey that is both<br />
difficult and dangerous. Crossing the desert, migrants face<br />
the risk of dehydration, contact with criminal networks, or<br />
crossing through areas with unexploded mines. Many<br />
make their way up through Sabha to more densely<br />
populated urban areas in either the west or east coast.<br />
Libya has also witnessed an increase in activity in its<br />
coastal areas: during the last two weeks of May, a large<br />
number of search and rescue operations were conducted<br />
in Libyan waters. The onset of warmer weather months is<br />
usually accompanied by an increase of boats crossing<br />
through the Central Mediterranean route. However, the<br />
slight increase in numbers should be put in the broader<br />
context of year-to-date trends, as compared with 2015.<br />
Between 1 January and 31 May 2016, 47,851 migrants<br />
have arrived to Italy from the Mediterranean, as recorded<br />
by the Italian Ministry of Interior. This represents an<br />
increase of a few hundred migrants from last year’s<br />
figures, when 47,452 migrants arrived to Italy during the<br />
same time period. The top recorded nationalities of those<br />
who have arrived to Italy in 2016 to date are from Eritrea,<br />
Nigeria, Gambia, Somalia, and Côte d’Ivoire, according to<br />
figures released by the Italian Ministry of Interior ii .<br />
IOM’s Missing Migrants project has recorded 2,061<br />
migrants as dead or missing between January and May this<br />
year, a 15% increase over the number recorded last year<br />
during the same period iii . This year, reports by both Italian<br />
and Libyan Coast Guards indicate that migrants are using<br />
increasingly poorly constructed and equipped boats to<br />
make their journeys across the Mediterranean than in<br />
previous years. The boats are overcrowded, and smugglers<br />
do not provide sufficient fuel to carry the boats for the full<br />
journey across the sea: as such, migrants travelling by sea<br />
are fully dependent on a successful search and rescue<br />
operation to take place for them to arrive to their<br />
destination.<br />
Using information provided by the Libyan Coast Guard, the<br />
Libyan Red Crescent and local humanitarian organizations<br />
providing assistance to migrants, IOM Libya has tracked<br />
the number of maritime incidents in which migrants were<br />
rescued and brought back to Libya so far in 2016. The<br />
majority of search and rescue operations have occurred in<br />
the western coastal areas of Libya, near Az Zawiyah,<br />
Sabratah, and Zuwara. Rescued migrants are transferred to<br />
detention centres near their points of disembarkation<br />
upon arrival back to Libya.<br />
*DTM Libya will be launching its Flow Monitoring module in July 2016 that aims to collect data on migrant flows across transit locations<br />
across Libya. DTM Libya will publish statistical reports on the data collected and integrate findings into regional reporting on migration<br />
trends.”<br />
20<br />
DTM Round 4: May –June 2016
4<br />
MIGRATION<br />
KEY POINTS<br />
31 SEARCH AND RESCUE OPERATIONS IN <strong>LIBYA</strong> HAVE BEEN RECORDED IN 2016<br />
<br />
AN ESTIMATED 6,995 MIGRANTS WERE RESCUED AND BROUGHT BACK TO <strong>LIBYA</strong><br />
Table 18: Maritime Incidents Recorded in Libya in 2016<br />
Date Incidents Estimated on Board Rescued Bodies Retrieved Estimated Missing<br />
6/7/2016 1 117 117 0 0<br />
5/28/2016 1 200 200 0<br />
5/27/2016 1 122 120 2 0<br />
5/26/2016 1 713 580 133 0<br />
05/26/2016 1 304 300 4 0<br />
5/24/2016 1 370 370 0 0<br />
5/24/2016 1 550 550 0 0<br />
5/24/2016 1 130 130 0 0<br />
5/23/2016 1 450 450 0 0<br />
5/22/2016 1 833 833 0 0<br />
5/22/2016 1 120 120 0 0<br />
5/15/2016 1 115 115 0 0<br />
5/1/2016 1 120 0 0 120<br />
4/30/2016 1 97 97 0 0<br />
4/12/2016 2 450 450 0 0<br />
4/12/2016 1 210 210 0 0<br />
4/11/2016 1 111 111 0 0<br />
3/30/2016 1 120 30 0 90<br />
3/28/2016 1 85 1 0 84<br />
3/24/2016 3 620 620 0 0<br />
3/21/2016 2 280 280 0 0<br />
3/19/2016 1 515 515 0 0<br />
3/18/2016 1 117 117 0 0<br />
3/17/2016 1 201 187 14 0<br />
2/21/2016 1 120 120 0 0<br />
1/05/2016 1 242 242 0 0<br />
Total 31 7,442 6,865 153 294<br />
For regularly updated numbers, please refer to IOM’s biweekly Migration and Assistance Overview reports<br />
at https://drive.google.com/folderview?id=0B_3VYzW3ndOTR19LcWhOVU9xQUE&usp=drive_web<br />
21<br />
DTM Round 4: May –June 2016
5<br />
NOTES ON THE DATA<br />
KEY POINTS<br />
DTM INTERVIEWED 944 KEY INFORMANTS DURING ROUND 4<br />
42% OF KEY INFORMANTS WERE REPRESENTATIVES OF THE LOCAL CRISIS COMMITTEES<br />
96% OF THE COLLECTED DATA WAS RECORDED AS ‘MOSTLY’ OR ‘VERY’ CREDIBLE<br />
DATA SOURCE<br />
During the fourth round, the DTM team assessed 100 areas,<br />
covering 516 locations; 412 of these locations reported an<br />
IDP presence, 73 had returnees, and 316 had migrants<br />
present. The four areas not assessed were Harawa, Sirte, Al<br />
Jaghbub and Misratah, inaccessible due to security reasons.<br />
This round did not conduct new assessments in Benghazi;<br />
instead, Round 3 baseline data for Benghazi was used.<br />
Finally, Benghazi, Tarhuna, Tawergha, and Suq al Jumah<br />
were assessed at area level only, as no access was possible<br />
to location level.<br />
In the assessed locations, the DTM team interviewed 944<br />
Key Informants (sources of information) with an average of<br />
two KIs interviewed in each location. The greatest number<br />
of the KIs interviewed were representatives of the Local<br />
Crisis Committees (41.9%), followed by other<br />
representatives from the Baladiya office such as the Social<br />
Affairs or Muhalla affairs divisions (24.8%). Humanitarian<br />
and social organization representatives, community and<br />
tribal leaders, IDP representatives, and school<br />
representatives were also among the KIs.<br />
7% of the interviewed KI’s were females, and 93% were<br />
males. Although this is an improvement over the previous<br />
round, DTM aims to continue increasing female KI<br />
participation in the coming rounds. The table below<br />
illustrates the type and count of KIs interviewed in the<br />
assessed locations during the DTM fourth round.<br />
Table 19: Data Source for Round 4<br />
DATA CREDIBILITY<br />
Through DTM’s methodology to rate the credibility of data collected from different KIs, data were considered very credible<br />
in 4% of the 516 assessed locations during the fourth round. 96% of the data captured was considered “very” or “mostly”<br />
credible, whilst only 4% of the assessed locations were considered as having somehow credible data. This represents an<br />
improvement from Round 3, when 92% of the data was categorized as “very”, or “mostly” credible, and 8% had “somehow<br />
credible” data.<br />
Figure 10: Data Credibility<br />
22<br />
DTM Round 4: May –June 2016
6<br />
METHODOLOGY<br />
In an effort to build the capacity of local partners and<br />
harmonize approaches of data collection on the displaced<br />
and migrant population in Libya, IOM successfully trained a<br />
selected a group of enumerators and team leaders from<br />
local NGOs on DTM’s Mobility tracking methodology and<br />
approach. Different actors served as Key Informants: local<br />
Crisis Committee representatives, humanitarian and social<br />
organizations; community and tribal representatives;<br />
representatives of displaced groups; other representation<br />
from the baladiya office (Social Affairs; Muhalla Affairs; etc.),<br />
representatives of education facilities, and representatives<br />
of health facilities.<br />
THREE POPULATIONS OF CONCERN are targeted as part of<br />
the DTM assessment: IDPs, returnees and migrants.<br />
An IDP is any “persons or groups of persons who have been<br />
forced or obliged to flee or to leave their homes or places of<br />
habitual residence, in particular as a result of or in order to<br />
avoid the effects of armed conflict, situations of generalized<br />
violence, violations of human rights or natural or humanmade<br />
disasters, and who have not crossed an<br />
internationally recognized state border”.<br />
A returnee is any person who was displaced internally or<br />
across an international border, but has since returned to<br />
his/her place of habitual residence.<br />
IOM defines a migrant as any person who is moving or has<br />
moved across an international border or within a state away<br />
from his/her habitual place of residence, regardless of (1)<br />
the person’s legal status; (2) whether the movement is<br />
voluntary or involuntary; (3) what the causes for the<br />
movement are; or (4) what the length of the stay is. For<br />
DTM programmatic purposes in Libya, a migrant is<br />
considered any person present in Libya who does not<br />
possess Libyan nationality. As such, DTM does not<br />
differentiate between migrant statuses, length of residence<br />
in the country, or migratory intentions. It counts as migrants<br />
those who may have come from refugee producing<br />
countries, along with long-term residents and labour<br />
migrants who engage in a circular migration pattern<br />
between Libya and their homes.<br />
The DTM’s methodology to track migrants is two-fold, firstly<br />
to regularly identify locations with migrant populations and<br />
estimate the numbers of migrants currently residing in each<br />
one, and secondly to regularly identify and map transit<br />
points where migrants are observed/known to pass<br />
through.<br />
DTM will continue to expand its field network and enhance<br />
approaches to track migrants, hoping to gain a more<br />
comprehensive picture through additional flow monitoring<br />
modules in future DTM rounds.<br />
DEFINITION OF AREA, LOCATION AND SITE<br />
IOM considered each baladiya (municipality) listed in the<br />
Elections List of Baladiyas (dated June 2015) as one area.<br />
Based on this list, there are a total of 104 baladiyas in Libya.<br />
It is acknowledged that clarifications of administrative<br />
divisions in Libya are still ongoing and the number of<br />
baladiyas is subject to change. As such, the logic<br />
underpinning data collection efforts is purely operational<br />
and not meant to indicate any endorsement of the current<br />
administrative divisions.<br />
The muhalla is considered a location. A muhalla can be one<br />
village or a small collection of villages in rural settings, whilst<br />
in urban settings it equates to a neighbourhood. As with the<br />
baladiyas, there are some contestations about the total<br />
number of muhallas and how they are administratively<br />
linked to the baladiyas. DTM has adopted a list of 667<br />
Muhallas as counted by the Bureau of Statistics and Census.<br />
For IOM, the list of muhallas compiled from the first round<br />
of data collection is used for operational purposes and does<br />
not indicate endorsement of administrative boundaries.<br />
A collective site is defined as any site which comprises five<br />
IDP households or more: these can include, but are not<br />
limited to: schools, other public buildings, people’s<br />
properties (farms, flats, and houses), unfinished buildings,<br />
and deserted resorts. More dispersed settings which would<br />
not be counted as an IDP site in the host community include<br />
IDPs staying in rented accommodation (self-paid, or paid by<br />
others), or in host families with relatives or non-relatives.<br />
23<br />
DTM Round 4: May –June 2016
6<br />
METHODOLOGY<br />
AREA ASSESSMENTS<br />
The information collected by the DTM at the area level<br />
includes information about outflow and inflow, i.e.<br />
displacement originating from the municipality and<br />
displacement in the municipality, IDP number estimates<br />
(household and individual), identification of settlements<br />
within the municipality with displaced populations, location<br />
of origin, time of departure/arrival of IDPs, reasons for<br />
displacement, and type of displacement locations. The<br />
assessment also captures information on the presence of<br />
migrants within the concerned municipality and a list of<br />
locations where such migrants are known to transit/stay,<br />
with an estimate of numbers and locations. The results of<br />
the municipality level area assessments, most importantly<br />
the indication of the presence of internally displaced and<br />
migrant households, is utilized to advise whether or not to<br />
continue assessments at the lower level (location<br />
assessments).<br />
LOCATION ASSESSMENTS<br />
The data collected at location level includes basic<br />
information about the displaced population (number of HH<br />
and individuals, time of arrival, origin, reason for<br />
displacement, type of shelter) as well as a listing of all sites<br />
where IDPs are staying. IDP sites are targeted for more<br />
detailed assessments and identified at the location level. In<br />
future rounds of data collection, the location assessment<br />
forms will include a needs analysis for the displaced and<br />
host communities (shelter, WASH, health etc.). The results<br />
of the location assessments are used to verify the<br />
information collected at the area level. The location<br />
assessment is carried out in all those settlements identified<br />
as having IDP populations or migrants in the area<br />
assessment form.<br />
RATING THE CREDIBILITY OF COLLECTED DATA<br />
DTM area and location assessments employ a number of<br />
indictors to measure the credibility of collected data from<br />
various key informants (KIs) in order to rate to which extent<br />
the information can be trusted. These indicators measure<br />
the similarity of the data provided, its correspondence to<br />
expectations based on general available information and<br />
knowledge, as well as methods of managing and<br />
24<br />
DTM Round 4: May –June 2016<br />
documenting the data within the same area. These factors<br />
together with the number of KIs involved, and whether field<br />
visits and direct observation were used as a method of<br />
verification, are used to rate the credibility of the data in<br />
each of the assessed areas. A color coding credibility<br />
method is used to rate the level of trust towards the data<br />
provided by DTM KIs in each area, with green indicating<br />
highest credibility rate, followed by yellow for mostly<br />
credible data, orange for somehow credible information,<br />
and red for low credibility data. With this method in place,<br />
DTM aims to enhance and expand its field network, and<br />
enable continuous improvement of data credibility.<br />
LIMITATIONS AND WAY FORWARD<br />
While IOM still faces security and access constraints this<br />
round of the DTM offers a baseline for full country coverage.<br />
IOM was able to undertake assessments in 100 out of 104<br />
areas in Libya with four non-assessed areas (Harawa, Sirte,<br />
Al Jaghbub and Misratah) due to security constraints. Data<br />
on Benghazi was drawn from the third round of data<br />
collection. Enumerators have also highlighted the worsened<br />
security situation, disrupted communication, limited<br />
transportation as a result of increased fuel prices and<br />
limited cooperation from local authorities as challenges<br />
preventing full coverage of all IDP and migrant hosting<br />
areas.<br />
Following the analysis of this DTM baseline and building on<br />
the data collection and information management activities<br />
conducted by different organizations, DTM in coordination<br />
with the Protection Working Group (PWG) and<br />
Humanitarian Country Team (HCT) will begin to assess and<br />
plan for an in-depth IDP and migrant location/site<br />
assessment comprised of core multi-sectorial indicators<br />
during the third quarter of 2016. The assessment will aim to<br />
enhance the understanding of sectorial needs and<br />
vulnerabilities of the IDP and migrant populations, support a<br />
warning system for sectorial attention in specific sites<br />
towards affected populations, and hence support a faster<br />
and improved response to provide services to the most<br />
vulnerable. Flow monitoring components may also be<br />
established to better capture migration trends throughout<br />
Libya.
ACKNOWLEDGEMENTS<br />
REFERENCES AND DISCLAIMERS<br />
i: Due to restrictions in access, DTM did not collect data on IDPs in Misratah in this round of reporting. However, data<br />
obtained from an inter-agency mission arranged by OCHA and UNSMIL to Misratah on June 6 th cites an estimated 8,775<br />
IDPs from Sirte to be living in Misratah, either with relatives or in rented private accommodation around the city, according<br />
to data provided by the Local Crisis Committee.<br />
ii: UNHCR/Reach (May 2016). Rapid IDP Protection Needs Assessment. <br />
iii: DTM Niger. Flow Monitoring Analysis. Quarterly Report. Reporting period Feb - Apr 2016. , p. 3<br />
iv: IOM. Mixed Migration Flows in the Mediterranean and Beyond. Compilation of Available Data and Information, 19 May<br />
– 1 June 2016 <br />
v: IOM Missing Migrants Project/Recorded Deaths in the Mediterranean by Month 2014 – 2016. <br />
DTM findings on migrants may include persons who originate from refugee producing countries.<br />
Base Map Source: ESRI. Maps are for illustration purposes only. Names and boundaries on the maps do not imply official<br />
DTM PARTNERS<br />
International Organization for Migration - IOM<br />
Libya Mission<br />
Résidence Les Ambassadeurs<br />
Bloc A—1st Floor<br />
Cité Les Pins Lac II 1053<br />
Tunis<br />
Tunisia<br />
Email: dtmlibya@iom.int<br />
25<br />
DTM Round 4: May –June 2016