

Q1 2016
28ZyPAr
28ZyPAr

Create successful ePaper yourself
Turn your PDF publications into a flip-book with our unique Google optimized e-Paper software.
www.pwc.com/auto<br />
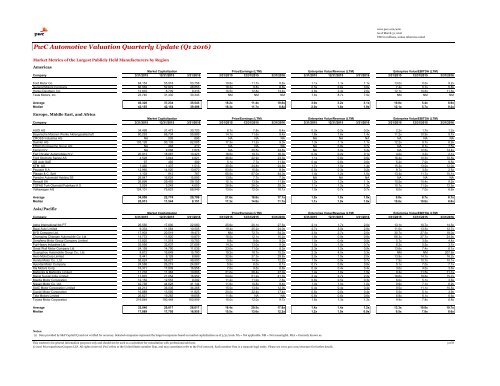
As of March 31, <strong>2016</strong><br />
USD in millions, unless otherwise noted<br />
PwC Automotive Valuation Quarterly Update (<strong>Q1</strong> <strong>2016</strong>)<br />
Market Metrics of the Largest Publicly Held Manufacturers by Region<br />
Americas<br />
Market Capitalization Price/Earnings (LTM) Enterprise Value/Revenue (LTM) .<br />
Enterprise Value/EBITDA (LTM)<br />
Company 3/31/2015 12/31/2015 3/31/<strong>2016</strong> 3/31/2015 12/31/2015 3/31/<strong>2016</strong> 3/31/2015 12/31/2015 3/31/<strong>2016</strong> 3/31/2015 12/31/2015 3/31/<strong>2016</strong><br />
Ford Motor Co. 64,154 55,918 53,758 19.8x 11.7x 8.6x 1.1x 1.1x 1.1x 13.0x 0.0x 9.2x<br />
General Motors Company 60,569 52,879 48,653 18.3x 9.8x 8.8x 0.5x 0.6x 0.6x 7.4x 5.7x 5.8x<br />
Harley-Davidson, Inc. 12,816 8,709 9,416 16.5x 12.8x 14.4x 2.8x 2.4x 2.6x 12.1x 10.6x 11.6x<br />
Tesla Motors, Inc. 23,740 31,430 30,343 NM NM NM 7.6x 8.7x 7.9x NM NM NM<br />
Average 40,320 37,234 35,543 18.2x 11.4x 10.6x 3.0x 3.2x 3.1x 10.8x 5.4x 8.9x<br />
Median 42,155 42,154 39,498 18.3x 11.7x 8.8x 2.0x 1.8x 1.9x 12.1x 5.7x 9.2x<br />
Europe, Middle East, and Africa<br />
Market Capitalization Price/Earnings (LTM) Enterprise Value/Revenue (LTM) .<br />
Enterprise Value/EBITDA (LTM)<br />
Company 3/31/2015 12/31/2015 3/31/<strong>2016</strong> 3/31/2015 12/31/2015 3/31/<strong>2016</strong> 3/31/2015 12/31/2015 3/31/<strong>2016</strong> 3/31/2015 12/31/2015 3/31/<strong>2016</strong><br />
AUDI AG 34,498 31,473 30,720 8.7x 7.8x 8.4x 0.3x 0.2x 0.2x 2.2x 1.7x 1.2x<br />
Bayerische Motoren Werke Aktiengesellschaft 80,293 68,734 59,989 14.1x 11.6x 9.4x 1.8x 1.6x 1.4x 11.2x 10.9x 9.7x<br />
CROSS Industries AG NA 905 896 NA NA NA NA NA NA NA NA NA<br />
Daimler AG 103,128 90,139 82,085 17.3x 11.2x 9.3x 1.3x 1.1x 1.1x 12.2x 9.7x 6.9x<br />
EDAG Engineering Group AG NA 484 412 NA NA NA NA 0.8x 0.7x NA 8.7x 7.5x<br />
Ferrari N.V. NA 9,068 7,878 NA 25.5x 24.6x NA 3.0x 3.3x NA 12.6x 14.4x<br />
Fiat Chrysler Automobiles N.V. 20,913 18,087 10,423 18.5x 19.7x 16.3x 0.3x 0.2x 0.1x 4.0x 3.2x 2.1x<br />
Ford Otomotiv Sanayi AS 4,528 3,644 4,621 46.6x 22.9x 23.3x 1.1x 0.8x 0.9x 16.4x 10.5x 10.5x<br />
GB Auto SAE 97 483 309 5.1x 7.7x 11.6x 0.4x 0.6x 0.6x 5.2x 7.0x 8.5x<br />
KTM AG 1,460 1,437 1,513 30.5x 24.8x 24.8x 1.7x 1.5x 1.4x 15.3x 13.0x 12.0x<br />
Peugeot S.A. 12,960 14,020 13,670 83.6x 15.6x 9.9x 0.5x 0.3x 0.2x 8.7x 3.5x 2.5x<br />
Piaggio & C. SpA 1,103 912 767 65.5x 57.0x 44.0x 1.4x 1.2x 1.0x 13.4x 11.7x 10.1x<br />
Porsche Automobil Holding SE 29,947 16,624 15,895 13.6x 7.7x 7.0x NA NA NA NA NA NA<br />
Renault SA 26,698 29,493 29,155 15.1x 13.9x 11.8x 1.2x 1.2x 1.1x 10.5x 10.4x 9.2x<br />
TOFAS Turk Otomobil Fabrikasi A.S. 3,029 3,249 4,053 26.8x 26.0x 29.3x 1.1x 1.2x 1.3x 10.7x 11.5x 12.5x<br />
Volkswagen AG 124,101 75,623 68,949 13.0x 12.0x 10.1x 1.0x 0.7x 0.7x 8.0x 7.0x 6.6x<br />
Average 34,058 22,774 20,709 27.6x 18.8x 17.1x 1.0x 1.0x 1.0x 9.8x 8.7x 8.1x<br />
Median 20,913 11,544 9,151 17.3x 14.8x 11.7x 1.1x 1.0x 1.0x 10.6x 10.0x 8.8x<br />
Asia/Pacific<br />
Market Capitalization Price/Earnings (LTM) Enterprise Value/Revenue (LTM) .<br />
Enterprise Value/EBITDA (LTM)<br />
Company 3/31/2015 12/31/2015 3/31/<strong>2016</strong> 3/31/2015 12/31/2015 3/31/<strong>2016</strong> 3/31/2015 12/31/2015 3/31/<strong>2016</strong> 3/31/2015 12/31/2015 3/31/<strong>2016</strong><br />
Astra International tbk PT 26,550 17,600 22,060 25.6x 20.1x 27.5x 2.1x 1.7x 2.0x 13.1x 10.7x 14.5x<br />
Bajaj Auto Limited 9,334 11,064 10,505 19.4x 25.2x 24.0x 2.7x 3.0x 2.9x 11.0x 13.5x 12.7x<br />
BYD Company Ltd. 17,903 20,519 19,473 NM 72.7x 54.3x 2.5x 2.7x 2.0x 30.7x 27.5x 18.0x<br />
Chongqing Changan Automobile Co. Ltd. 14,772 11,820 10,879 18.5x 12.1x 10.2x 1.8x 0.9x 0.8x 66.3x 27.7x 24.9x<br />
Dongfeng Motor Group Company Limited 13,825 11,518 10,753 9.8x 9.6x 9.2x 1.0x 0.4x 0.5x 5.7x 3.5x 4.4x<br />
Fuji Heavy Industries Ltd. 25,956 32,637 27,608 14.2x 13.0x 9.0x 1.0x 1.0x 0.7x 6.2x 5.5x 3.7x<br />
Great Wall Motor Company Ltd. 24,159 14,790 11,035 23.0x 11.0x 8.3x 2.3x 1.2x 0.9x 13.6x 7.4x 6.1x<br />
Guangzhou Automobile Group Co., Ltd. 8,812 16,649 15,790 19.2x 18.7x 15.2x 2.3x 4.0x 3.3x NM NM 207.6x<br />
Hero MotoCorp Limited 8,441 8,128 8,869 32.8x 27.3x 29.8x 2.0x 1.9x 2.0x 13.9x 14.7x 16.2x<br />
Honda Motor Co., Ltd. 58,624 58,627 49,500 13.9x 14.9x 12.2x 1.0x 0.9x 0.7x 7.9x 10.7x 10.1x<br />
Hyundai Motor Company 24,586 26,219 24,067 5.9x 6.0x 6.1x 0.7x 0.8x 0.8x 5.1x 7.0x 7.1x<br />
Kia Motors Corp. 16,371 17,809 16,958 7.0x 9.6x 8.8x 0.3x 0.4x 0.4x 3.0x 4.0x 3.6x<br />
Mahindra & Mahindra Limited 11,216 11,363 10,803 21.0x 28.4x 27.0x 1.4x 1.6x 1.5x 9.3x 11.5x 11.1x<br />
Maruti Suzuki India Limited 17,875 21,054 16,952 54.0x 51.2x 41.3x 2.4x 2.7x 2.2x 18.6x 19.6x 15.7x<br />
Mazda Motor Corporation 12,152 12,553 9,292 11.2x 11.0x 7.6x 0.6x 0.5x 0.3x 6.0x 5.1x 3.6x<br />
Nissan Motor Co. Ltd. 42,768 44,628 41,144 11.6x 10.8x 8.4x 1.0x 1.0x 1.0x 9.9x 7.1x 6.9x<br />
SAIC Motor Corporation Limited 44,213 36,036 34,268 15.5x 13.6x 12.9x 0.4x 0.4x 0.4x 9.5x 11.1x 10.5x<br />
Suzuki Motor Corporation 16,889 13,592 11,825 20.0x 22.4x 17.4x 0.6x 0.6x 0.4x 5.5x 5.1x 3.9x<br />
Tata Motors Limited 26,627 19,283 19,658 11.8x NA NA 0.8x 0.6x 0.6x 6.8x 6.1x 6.6x<br />
Toyota Motor Corporation 219,849 190,448 160,909 15.0x 12.0x 9.7x 1.6x 1.3x 1.2x 9.9x 7.8x 6.8x<br />
Average 32,046 29,817 26,617 18.4x 20.5x 17.8x 1.4x 1.4x 1.2x 13.3x 10.8x 19.7x<br />
Median 17,889 17,705 16,955 15.5x 13.6x 12.2x 1.2x 1.0x 0.9x 9.5x 7.8x 8.6x<br />
Notes:<br />
(1) Data provided by S&P Capital IQ and not verified for accuracy. Selected companies represent the largest companies based on market capitalization as of 3/31/<strong>2016</strong>. NA = Not applicable. NM = Not meaningful. FKA = Formerly known as.<br />
This content is for general information purposes only and should not be used as a substitute for consultation with professional advisors. 3 of 8<br />
© <strong>2016</strong> PricewaterhouseCoopers LLP. All rights reserved. PwC refers to the United States member firm, and may sometimes refer to the PwC network. Each member firm is a separate legal entity. Please see www.pwc.com/structure for further details.