

Latham Letter
LL_16_SP
LL_16_SP

You also want an ePaper? Increase the reach of your titles
YUMPU automatically turns print PDFs into web optimized ePapers that Google loves.
and Statistical Manual of Mental<br />
Disorders (DSM-5), used to diagnose<br />
some disabilities such as ADHD and<br />
Learning Disabilities, is reviewed<br />
and modified about every 10-15 years<br />
(DSM5.org), reflecting updates in brain<br />
and behavior research. Your Humane<br />
Education lessons and the observations<br />
you make in student growth will<br />
contribute to the larger movement of<br />
understanding all of our students.<br />
Roll Call: Who Are<br />
These Students with<br />
Special Needs?<br />
“Special Education” is an umbrella term<br />
that refers to the services provided to<br />
meet the educational needs of students<br />
with disabilities. These needs can<br />
range from class-work modifications,<br />
to small group instruction, to physical<br />
assistance. These services can be<br />
provided by a teacher, aide, or specialist,<br />
in the general education room, a visit to<br />
a different classroom for part of the day,<br />
or in a specialized classroom.<br />
An important trend is that students<br />
with special needs are included in<br />
general education classrooms<br />
as much as possible. Consider<br />
this: in 2000, just under 50%<br />
of students with disabilities<br />
spent 80% or more of their<br />
days in general education<br />
classrooms. About 30% of<br />
these students spent 40-<br />
79% of their day in general<br />
education settings, and only<br />
about 20% of students with<br />
disabilities spent less than<br />
40% of their day in general<br />
education classrooms. Twelve<br />
years later, in the 2012-13<br />
school year, over 60% of<br />
students with disabilities<br />
spend the vast majority (80%<br />
or more) of their day in general education. And about 15% of these students are<br />
in general education less than 40% of their day. (See page 10 Works Cited)<br />
So what do these kids look like? The answer is simple: they look like kids.<br />
Sometimes their challenges are physically obvious, but most often, these are kids in<br />
classrooms where you already teach! Yes, you have already reached and celebrated<br />
these students! Now, it’s time to increase your awareness and hone your skills.<br />
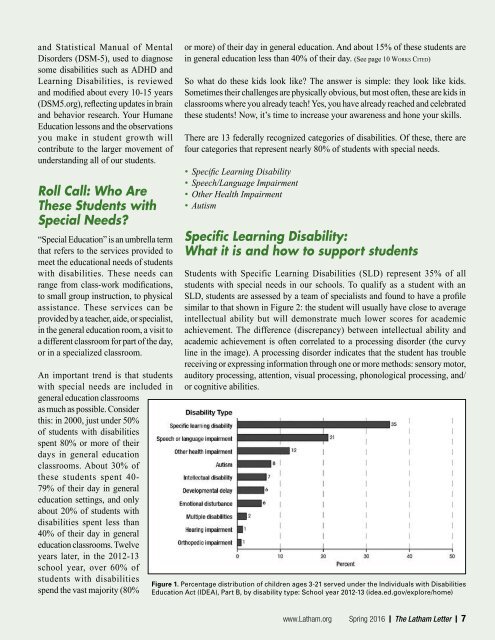
There are 13 federally recognized categories of disabilities. Of these, there are<br />
four categories that represent nearly 80% of students with special needs.<br />
• Specific Learning Disability<br />
• Speech/Language Impairment<br />
• Other Health Impairment<br />
• Autism<br />
Specific Learning Disability:<br />
What it is and how to support students<br />
Students with Specific Learning Disabilities (SLD) represent 35% of all<br />
students with special needs in our schools. To qualify as a student with an<br />
SLD, students are assessed by a team of specialists and found to have a profile<br />
similar to that shown in Figure 2: the student will usually have close to average<br />
intellectual ability but will demonstrate much lower scores for academic<br />
achievement. The difference (discrepancy) between intellectual ability and<br />
academic achievement is often correlated to a processing disorder (the curvy<br />
line in the image). A processing disorder indicates that the student has trouble<br />
receiving or expressing information through one or more methods: sensory motor,<br />
auditory processing, attention, visual processing, phonological processing, and/<br />
or cognitive abilities.<br />
Figure 1. Percentage distribution of children ages 3-21 served under the Individuals with Disabilities<br />
Education Act (IDEA), Part B, by disability type: School year 2012-13 (idea.ed.gov/explore/home)<br />
www.<strong>Latham</strong>.org Spring 2016 | The <strong>Latham</strong> <strong>Letter</strong> | 7