
Create successful ePaper yourself
Turn your PDF publications into a flip-book with our unique Google optimized e-Paper software.
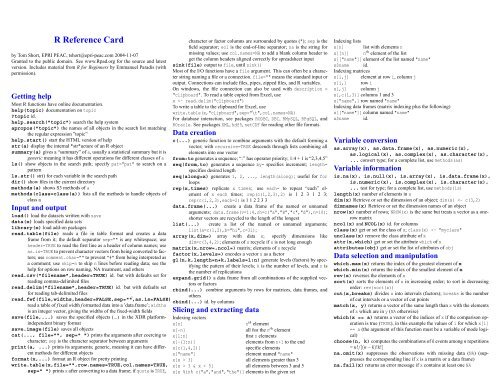
R Reference Card<br />
by Tom <strong>Short</strong>, EPRI PEAC, tshort@epri-peac.com 2004-11-07<br />
Granted to the public domain. See www.Rpad.org for the source and latest<br />
version. Includes material from R for Beginners by Emmanuel Paradis (with<br />
permission).<br />
Getting help<br />
Most R functions have online documentation.<br />
help(topic) documentation on topic<br />
?topic id.<br />
help.search("topic") search the help system<br />
apropos("topic") the names of all objects in the search list matching<br />
the regular expression ”topic”<br />
help.start() start the HTML version of help<br />
str(a) display the internal *str*ucture of an R object<br />
summary(a) gives a “summary” of a, usually a statistical summary but it is<br />
generic meaning it has different operations for different classes of a<br />
ls() show objects in the search path; specify pat="pat" to search on a<br />
pattern<br />
ls.str() str() for each variable in the search path<br />
dir() show files in the current directory<br />
methods(a) shows S3 methods of a<br />
methods(class=class(a)) lists all the methods to handle objects of<br />
class a<br />
Input and output<br />
load() load the datasets written with save<br />
data(x) loads specified data sets<br />
library(x) load add-on packages<br />
read.table(file) reads a file in table format and creates a data<br />
frame from it; the default separator sep="" is any whitespace; use<br />
header=TRUE to read the first line as a header of column names; use<br />
as.is=TRUE to prevent character vectors from being converted to factors;<br />
use comment.char="" to prevent "#" from being interpreted as<br />
a comment; use skip=n to skip n lines before reading data; see the<br />
help for options on row naming, NA treatment, and others<br />
read.csv("filename",header=TRUE) id. but with defaults set for<br />
reading comma-delimited files<br />
read.delim("filename",header=TRUE) id. but with defaults set<br />
for reading tab-delimited files<br />
read.fwf(file,widths,header=FALSE,sep="⁀",as.is=FALSE)<br />
read a table of f ixed width f ormatted data into a ’data.frame’; widths<br />
is an integer vector, giving the widths of the fixed-width fields<br />
save(file,...) saves the specified objects (...) in the XDR platformindependent<br />
binary format<br />
save.image(file) saves all objects<br />
cat(..., file="", sep=" ") prints the arguments after coercing to<br />
character; sep is the character separator between arguments<br />
print(a, ...) prints its arguments; generic, meaning it can have different<br />
methods for different objects<br />
format(x,...) format an R object for pretty printing<br />
write.table(x,file="",row.names=TRUE,col.names=TRUE,<br />
sep=" ") prints x after converting to a data frame; if quote is TRUE,<br />
character or factor columns are surrounded by quotes ("); sep is the<br />
field separator; eol is the end-of-line separator; na is the string for<br />
missing values; use col.names=NA to add a blank column header to<br />
get the column headers aligned correctly for spreadsheet input<br />
sink(file) output to file, until sink()<br />
Most of the I/O functions have a file argument. This can often be a character<br />
string naming a file or a connection. file="" means the standard input or<br />
output. Connections can include files, pipes, zipped files, and R variables.<br />
On windows, the file connection can also be used with description =<br />
"clipboard". To read a table copied from Excel, use<br />
x 3] all elements greater than 3<br />
x[x > 3 & x < 5] all elements between 3 and 5<br />
x[x %in% c("a","and","the")] elements in the given set<br />
Indexing lists<br />
x[n] list with elements n<br />
x[[n]] n th element of the list<br />
x[["name"]] element of the list named "name"<br />
x$name id.<br />
Indexing matrices<br />
x[i,j] element at row i, column j<br />
x[i,] row i<br />
x[,j] column j<br />
x[,c(1,3)] columns 1 and 3<br />
x["name",] row named "name"<br />
Indexing data frames (matrix indexing plus the following)<br />
x[["name"]] column named "name"<br />
x$name id.<br />
Variable conversion<br />
as.array(x), as.data.frame(x), as.numeric(x),<br />
as.logical(x), as.complex(x), as.character(x),<br />
... convert type; for a complete list, use methods(as)<br />
Variable information<br />
is.na(x), is.null(x), is.array(x), is.data.frame(x),<br />
is.numeric(x), is.complex(x), is.character(x),<br />
... test for type; for a complete list, use methods(is)<br />
length(x) number of elements in x<br />
dim(x) Retrieve or set the dimension of an object; dim(x)
unique(x) if x is a vector or a data frame, returns a similar object but with<br />
the duplicate elements suppressed<br />
table(x) returns a table with the numbers of the differents values of x<br />
(typically for integers or factors)<br />
subset(x, ...) returns a selection of x with respect to criteria (...,<br />
typically comparisons: x$V1 < 10); if x is a data frame, the option<br />
select gives the variables to be kept or dropped using a minus sign<br />
sample(x, size) resample randomly and without replacement size elements<br />
in the vector x, the option replace = TRUE allows to resample<br />
with replacement<br />
prop.table(x,margin=) table entries as fraction of marginal table<br />
Math<br />
sin,cos,tan,asin,acos,atan,atan2,log,log10,exp<br />
max(x) maximum of the elements of x<br />
min(x) minimum of the elements of x<br />
range(x) id. then c(min(x), max(x))<br />
sum(x) sum of the elements of x<br />
diff(x) lagged and iterated differences of vector x<br />
prod(x) product of the elements of x<br />
mean(x) mean of the elements of x<br />
median(x) median of the elements of x<br />
quantile(x,probs=) sample quantiles corresponding to the given probabilities<br />
(defaults to 0,.25,.5,.75,1)<br />
weighted.mean(x, w) mean of x with weights w<br />
rank(x) ranks of the elements of x<br />
var(x) or cov(x) variance of the elements of x (calculated on n−1); if x is<br />
a matrix or a data frame, the variance-covariance matrix is calculated<br />
sd(x) standard deviation of x<br />
cor(x) correlation matrix of x if it is a matrix or a data frame (1 if x is a<br />
vector)<br />
var(x, y) or cov(x, y) covariance between x and y, or between the<br />
columns of x and those of y if they are matrices or data frames<br />
cor(x, y) linear correlation between x and y, or correlation matrix if they<br />
are matrices or data frames<br />
round(x, n) rounds the elements of x to n decimals<br />
log(x, base) computes the logarithm of x with base base<br />
scale(x) if x is a matrix, centers and reduces the data; to center only use<br />
the option center=FALSE, to reduce only scale=FALSE (by default<br />
center=TRUE, scale=TRUE)<br />
pmin(x,y,...) a vector which ith element is the minimum of x[i],<br />
y[i], . . .<br />
pmax(x,y,...) id. for the maximum<br />
cumsum(x) a vector which ith element is the sum from x[1] to x[i]<br />
cumprod(x) id. for the product<br />
cummin(x) id. for the minimum<br />
cummax(x) id. for the maximum<br />
union(x,y), intersect(x,y), setdiff(x,y), setequal(x,y),<br />
is.element(el,set) “set” functions<br />
Re(x) real part of a complex number<br />
Im(x) imaginary part<br />
Mod(x) modulus; abs(x) is the same<br />
Arg(x) angle in radians of the complex number<br />
Conj(x) complex conjugate<br />
convolve(x,y) compute the several kinds of convolutions of two sequences<br />
fft(x) Fast Fourier Transform of an array<br />
mvfft(x) FFT of each column of a matrix<br />
filter(x,filter) applies linear filtering to a univariate time series or<br />
to each series separately of a multivariate time series<br />
Many math functions have a logical parameter na.rm=FALSE to specify missing<br />
data (NA) removal.<br />
Matrices<br />
t(x) transpose<br />
diag(x) diagonal<br />
%*% matrix multiplication<br />
solve(a,b) solves a %*% x = b for x<br />
solve(a) matrix inverse of a<br />
rowsum(x) sum of rows for a matrix-like object; rowSums(x) is a faster<br />
version<br />
colsum(x), colSums(x) id. for columns<br />
rowMeans(x) fast version of row means<br />
colMeans(x) id. for columns<br />
Advanced data processing<br />
apply(X,INDEX,FUN=) a vector or array or list of values obtained by<br />
applying a function FUN to margins (INDEX) of X<br />
lapply(X,FUN) apply FUN to each element of the list X<br />
tapply(X,INDEX,FUN=) apply FUN to each cell of a ragged array given<br />
by X with indexes INDEX<br />
by(data,INDEX,FUN) apply FUN to data frame data subsetted by INDEX<br />
merge(a,b) merge two data frames by common columns or row names<br />
xtabs(a b,data=x) a contingency table from cross-classifying factors<br />
aggregate(x,by,FUN) splits the data frame x into subsets, computes<br />
summary statistics for each, and returns the result in a convenient<br />
form; by is a list of grouping elements, each as long as the variables<br />
in x<br />
stack(x, ...) transform data available as separate columns in a data<br />
frame or list into a single column<br />
unstack(x, ...) inverse of stack()<br />
reshape(x, ...) reshapes a data frame between ’wide’ format with<br />
repeated measurements in separate columns of the same record and<br />
’long’ format with the repeated measurements in separate records;<br />
use (direction=”wide”) or (direction=”long”)<br />
Strings<br />
paste(...) concatenate vectors after converting to character; sep= is the<br />
string to separate terms (a single space is the default); collapse= is<br />
an optional string to separate “collapsed” results<br />
substr(x,start,stop) substrings in a character vector; can also assign,<br />
as substr(x, start, stop) ), seq(), and difftime() are useful.<br />
Date also allows + and −. ?DateTimeClasses gives more information. See<br />
also package chron.<br />
as.Date(s) and as.POSIXct(s) convert to the respective class;<br />
format(dt) converts to a string representation. The default string<br />
format is “2001-02-21”. These accept a second argument to specify a<br />
format for conversion. Some common formats are:<br />
%a, %A Abbreviated and full weekday name.<br />
%b, %B Abbreviated and full month name.<br />
%d Day of the month (01–31).<br />
%H Hours (00–23).<br />
%I Hours (01–12).<br />
%j Day of year (001–366).<br />
%m Month (01–12).<br />
%M Minute (00–59).<br />
%p AM/PM indicator.<br />
%S Second as decimal number (00–61).<br />
%U Week (00–53); the first Sunday as day 1 of week 1.<br />
%w Weekday (0–6, Sunday is 0).<br />
%W Week (00–53); the first Monday as day 1 of week 1.<br />
%y Year without century (00–99). Don’t use.<br />
%Y Year with century.<br />
%z (output only.) Offset from Greenwich; -0800 is 8 hours west of.<br />
%Z (output only.) Time zone as a character string (empty if not available).<br />
Where leading zeros are shown they will be used on output but are optional<br />
on input. See ?strftime.<br />
Plotting<br />
plot(x) plot of the values of x (on the y-axis) ordered on the x-axis<br />
plot(x, y) bivariate plot of x (on the x-axis) and y (on the y-axis)<br />
hist(x) histogram of the frequencies of x<br />
barplot(x) histogram of the values of x; use horiz=FALSE for horizontal<br />
bars<br />
dotchart(x) if x is a data frame, plots a Cleveland dot plot (stacked plots<br />
line-by-line and column-by-column)<br />
pie(x) circular pie-chart<br />
boxplot(x) “box-and-whiskers” plot<br />
sunflowerplot(x, y) id. than plot() but the points with similar coordinates<br />
are drawn as flowers which petal number represents the number<br />
of points<br />
stripplot(x) plot of the values of x on a line (an alternative to<br />
boxplot() for small sample sizes)<br />
coplot(x˜y | z) bivariate plot of x and y for each value or interval of<br />
values of z<br />
interaction.plot (f1, f2, y) if f1 and f2 are factors, plots the<br />
means of y (on the y-axis) with respect to the values of f1 (on the<br />
x-axis) and of f2 (different curves); the option fun allows to choose<br />
the summary statistic of y (by default fun=mean)
matplot(x,y) bivariate plot of the first column of x vs. the first one of y,<br />
the second one of x vs. the second one of y, etc.<br />
fourfoldplot(x) visualizes, with quarters of circles, the association between<br />
two dichotomous variables for different populations (x must<br />
be an array with dim=c(2, 2, k), or a matrix with dim=c(2, 2) if<br />
k = 1)<br />
assocplot(x) Cohen–Friendly graph showing the deviations from independence<br />
of rows and columns in a two dimensional contingency table<br />
mosaicplot(x) ‘mosaic’ graph of the residuals from a log-linear regression<br />
of a contingency table<br />
pairs(x) if x is a matrix or a data frame, draws all possible bivariate plots<br />
between the columns of x<br />
plot.ts(x) if x is an object of class "ts", plot of x with respect to time, x<br />
may be multivariate but the series must have the same frequency and<br />
dates<br />
ts.plot(x) id. but if x is multivariate the series may have different dates<br />
and must have the same frequency<br />
qqnorm(x) quantiles of x with respect to the values expected under a normal<br />
law<br />
qqplot(x, y) quantiles of y with respect to the quantiles of x<br />
contour(x, y, z) contour plot (data are interpolated to draw the<br />
curves), x and y must be vectors and z must be a matrix so that<br />
dim(z)=c(length(x), length(y)) (x and y may be omitted)<br />
filled.contour(x, y, z) id. but the areas between the contours are<br />
coloured, and a legend of the colours is drawn as well<br />
image(x, y, z) id. but with colours (actual data are plotted)<br />
persp(x, y, z) id. but in perspective (actual data are plotted)<br />
stars(x) if x is a matrix or a data frame, draws a graph with segments or a<br />
star where each row of x is represented by a star and the columns are<br />
the lengths of the segments<br />
symbols(x, y, ...) draws, at the coordinates given by x and y, symbols<br />
(circles, squares, rectangles, stars, thermometres or “boxplots”)<br />
which sizes, colours . . . are specified by supplementary arguments<br />
termplot(mod.obj) plot of the (partial) effects of a regression model<br />
(mod.obj)<br />
The following parameters are common to many plotting functions:<br />
add=FALSE if TRUE superposes the plot on the previous one (if it exists)<br />
axes=TRUE if FALSE does not draw the axes and the box<br />
type="p" specifies the type of plot, "p": points, "l": lines, "b": points<br />
connected by lines, "o": id. but the lines are over the points, "h":<br />
vertical lines, "s": steps, the data are represented by the top of the<br />
vertical lines, "S": id. but the data are represented by the bottom of<br />
the vertical lines<br />
xlim=, ylim= specifies the lower and upper limits of the axes, for example<br />
with xlim=c(1, 10) or xlim=range(x)<br />
xlab=, ylab= annotates the axes, must be variables of mode character<br />
main= main title, must be a variable of mode character<br />
sub= sub-title (written in a smaller font)<br />
Low-level plotting commands<br />
points(x, y) adds points (the option type= can be used)<br />
lines(x, y) id. but with lines<br />
text(x, y, labels, ...)<br />
adds text given by labels at coordinates<br />
(x,y); a typical use is: plot(x, y, type="n"); text(x, y,<br />
names)<br />
mtext(text, side=3, line=0, ...) adds text given by text in<br />
the margin specified by side (see axis() below); line specifies the<br />
line from the plotting area<br />
segments(x0, y0, x1, y1) draws lines from points (x0,y0) to points<br />
(x1,y1)<br />
arrows(x0, y0, x1, y1, angle= 30, code=2) id. with arrows<br />
at points (x0,y0) if code=2, at points (x1,y1) if code=1, or both if<br />
code=3; angle controls the angle from the shaft of the arrow to the<br />
edge of the arrow head<br />
abline(a,b) draws a line of slope b and intercept a<br />
abline(h=y) draws a horizontal line at ordinate y<br />
abline(v=x) draws a vertical line at abcissa x<br />
abline(lm.obj) draws the regression line given by lm.obj<br />
rect(x1, y1, x2, y2) draws a rectangle which left, right, bottom, and<br />
top limits are x1, x2, y1, and y2, respectively<br />
polygon(x, y) draws a polygon linking the points with coordinates given<br />
by x and y<br />
legend(x, y, legend) adds the legend at the point (x,y) with the symbols<br />
given by legend<br />
title() adds a title and optionally a sub-title<br />
axis(side, vect) adds an axis at the bottom (side=1), on the left (2),<br />
at the top (3), or on the right (4); vect (optional) gives the abcissa (or<br />
ordinates) where tick-marks are drawn<br />
rug(x) draws the data x on the x-axis as small vertical lines<br />
locator(n, type="n", ...) returns the coordinates (x,y) after the<br />
user has clicked n times on the plot with the mouse; also draws symbols<br />
(type="p") or lines (type="l") with respect to optional graphic<br />
parameters (...); by default nothing is drawn (type="n")<br />
Graphical parameters<br />
These can be set globally with par(...); many can be passed as parameters<br />
to plotting commands.<br />
adj controls text justification (0 left-justified, 0.5 centred, 1 right-justified)<br />
bg specifies the colour of the background (ex. : bg="red", bg="blue", . . .<br />
the list of the 657 available colours is displayed with colors())<br />
bty controls the type of box drawn around the plot, allowed values are: "o",<br />
"l", "7", "c", "u" ou "]" (the box looks like the corresponding character);<br />
if bty="n" the box is not drawn<br />
cex a value controlling the size of texts and symbols with respect to the default;<br />
the following parameters have the same control for numbers on<br />
the axes, cex.axis, the axis labels, cex.lab, the title, cex.main,<br />
and the sub-title, cex.sub<br />
col controls the color of symbols and lines; use color names: "red", "blue"<br />
see colors() or as "#RRGGBB"; see rgb(), hsv(), gray(), and<br />
rainbow(); as for cex there are: col.axis, col.lab, col.main,<br />
col.sub<br />
font an integer which controls the style of text (1: normal, 2: italics, 3:<br />
bold, 4: bold italics); as for cex there are: font.axis, font.lab,<br />
font.main, font.sub<br />
las an integer which controls the orientation of the axis labels (0: parallel to<br />
the axes, 1: horizontal, 2: perpendicular to the axes, 3: vertical)<br />
lty controls the type of lines, can be an integer or string (1: "solid",<br />
2: "dashed", 3: "dotted", 4: "dotdash", 5: "longdash", 6:<br />
"twodash", or a string of up to eight characters (between "0" and<br />
"9") which specifies alternatively the length, in points or pixels, of<br />
the drawn elements and the blanks, for example lty="44" will have<br />
the same effect than lty=2<br />
lwd a numeric which controls the width of lines, default 1<br />
mar a vector of 4 numeric values which control the space between the axes<br />
and the border of the graph of the form c(bottom, left, top,<br />
right), the default values are c(5.1, 4.1, 4.1, 2.1)<br />
mfcol a vector of the form c(nr,nc) which partitions the graphic window<br />
as a matrix of nr lines and nc columns, the plots are then drawn in<br />
columns<br />
mfrow id. but the plots are drawn by row<br />
pch controls the type of symbol, either an integer between 1 and 25, or any<br />
single character within ""<br />
1 ● 2 3 4 5 6 7 8 9 10 ● 11 12 13 ● 14 15<br />
16 ● 17 18 19 ● 20 ● 21 ● 22 23 24 25 * * . X X<br />
a a ? ?<br />
ps an integer which controls the size in points of texts and symbols<br />
pty a character which specifies the type of the plotting region, "s": square,<br />
"m": maximal<br />
tck a value which specifies the length of tick-marks on the axes as a fraction<br />
of the smallest of the width or height of the plot; if tck=1 a grid is<br />
drawn<br />
tcl a value which specifies the length of tick-marks on the axes as a fraction<br />
of the height of a line of text (by default tcl=-0.5)<br />
xaxt if xaxt="n" the x-axis is set but not drawn (useful in conjonction with<br />
axis(side=1, ...))<br />
yaxt if yaxt="n" the y-axis is set but not drawn (useful in conjonction with<br />
axis(side=2, ...))<br />
Lattice (Trellis) graphics<br />
xyplot(y˜x) bivariate plots (with many functionalities)<br />
barchart(y˜x) histogram of the values of y with respect to those of x<br />
dotplot(y˜x) Cleveland dot plot (stacked plots line-by-line and columnby-column)<br />
densityplot(˜x) density functions plot<br />
histogram(˜x) histogram of the frequencies of x<br />
bwplot(y˜x) “box-and-whiskers” plot<br />
qqmath(˜x) quantiles of x with respect to the values expected under a theoretical<br />
distribution<br />
stripplot(y˜x) single dimension plot, x must be numeric, y may be a<br />
factor<br />
qq(y˜x) quantiles to compare two distributions, x must be numeric, y may<br />
be numeric, character, or factor but must have two ‘levels’<br />
splom(˜x) matrix of bivariate plots<br />
parallel(˜x) parallel coordinates plot<br />
levelplot(z˜x*y|g1*g2) coloured plot of the values of z at the coordinates<br />
given by x and y (x, y and z are all of the same length)<br />
wireframe(z˜x*y|g1*g2) 3d surface plot<br />
cloud(z˜x*y|g1*g2) 3d scatter plot
In the normal Lattice formula, y x|g1*g2 has combinations of optional conditioning<br />
variables g1 and g2 plotted on separate panels. Lattice functions<br />
take many of the same arguments as base graphics plus also data= the data<br />
frame for the formula variables and subset= for subsetting. Use panel=<br />
to define a custom panel function (see apropos("panel") and ?llines).<br />
Lattice functions return an object of class trellis and have to be print-ed to<br />
produce the graph. Use print(xyplot(...)) inside functions where automatic<br />
printing doesn’t work. Use lattice.theme and lset to change Lattice<br />
defaults.<br />
Optimization and model fitting<br />
optim(par, fn, method = c("Nelder-Mead", "BFGS",<br />
"CG", "L-BFGS-B", "SANN") general-purpose optimization;<br />
par is initial values, fn is function to optimize (normally minimize)<br />
nlm(f,p) minimize function f using a Newton-type algorithm with starting<br />
values p<br />
lm(formula) fit linear models; formula is typically of the form response<br />
termA + termB + ...; use I(x*y) + I(xˆ2) for terms made of<br />
nonlinear components<br />
glm(formula,family=) fit generalized linear models, specified by giving<br />
a symbolic description of the linear predictor and a description of<br />
the error distribution; family is a description of the error distribution<br />
and link function to be used in the model; see ?family<br />
nls(formula) nonlinear least-squares estimates of the nonlinear model<br />
parameters<br />
approx(x,y=) linearly interpolate given data points; x can be an xy plotting<br />
structure<br />
spline(x,y=) cubic spline interpolation<br />
loess(formula) fit a polynomial surface using local fitting<br />
Many of the formula-based modeling functions have several common arguments:<br />
data= the data frame for the formula variables, subset= a subset of<br />
variables used in the fit, na.action= action for missing values: "na.fail",<br />
"na.omit", or a function. The following generics often apply to model fitting<br />
functions:<br />
predict(fit,...) predictions from fit based on input data<br />
df.residual(fit) returns the number of residual degrees of freedom<br />
coef(fit) returns the estimated coefficients (sometimes with their<br />
standard-errors)<br />
residuals(fit) returns the residuals<br />
deviance(fit) returns the deviance<br />
fitted(fit) returns the fitted values<br />
logLik(fit) computes the logarithm of the likelihood and the number of<br />
parameters<br />
AIC(fit) computes the Akaike information criterion or AIC<br />
Statistics<br />
aov(formula) analysis of variance model<br />
anova(fit,...) analysis of variance (or deviance) tables for one or more<br />
fitted model objects<br />
density(x) kernel density estimates of x<br />
binom.test(), pairwise.t.test(), power.t.test(),<br />
prop.test(), t.test(), ... use help.search("test")<br />
Distributions<br />
rnorm(n, mean=0, sd=1) Gaussian (normal)<br />
rexp(n, rate=1) exponential<br />
rgamma(n, shape, scale=1) gamma<br />
rpois(n, lambda) Poisson<br />
rweibull(n, shape, scale=1) Weibull<br />
rcauchy(n, location=0, scale=1) Cauchy<br />
rbeta(n, shape1, shape2) beta<br />
rt(n, df) ‘Student’ (t)<br />
rf(n, df1, df2) Fisher–Snedecor (F) (χ 2 )<br />
rchisq(n, df) Pearson<br />
rbinom(n, size, prob) binomial<br />
rgeom(n, prob) geometric<br />
rhyper(nn, m, n, k) hypergeometric<br />
rlogis(n, location=0, scale=1) logistic<br />
rlnorm(n, meanlog=0, sdlog=1) lognormal<br />
rnbinom(n, size, prob) negative binomial<br />
runif(n, min=0, max=1) uniform<br />
rwilcox(nn, m, n), rsignrank(nn, n) Wilcoxon’s statistics<br />
All these functions can be used by replacing the letter r with d, p or q to<br />
get, respectively, the probability density (dfunc(x, ...)), the cumulative<br />
probability density (pfunc(x, ...)), and the value of quantile (qfunc(p,<br />
...), with 0 < p < 1).<br />
Programming<br />
function( arglist ) expr function definition<br />
return(value)<br />
if(cond) expr<br />
if(cond) cons.expr else alt.expr<br />
for(var in seq) expr<br />
while(cond) expr<br />
repeat expr<br />
break<br />
next<br />
Use braces {} around statements<br />
ifelse(test, yes, no) a value with the same shape as test filled<br />
with elements from either yes or no<br />
do.call(funname, args) executes a function call from the name of<br />
the function and a list of arguments to be passed to it