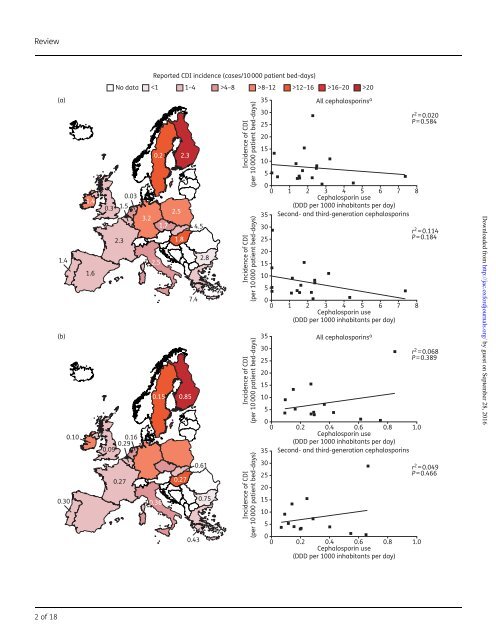
Review Reported CDI incidence (cases/10 000 patient bed-days) No data 4–8 >8–12 >12–16 >16–20 >20 (a) 0.2 2.3 Incidence of CDI (per 10 000 patient bed-days) 35 30 25 20 15 10 5 All cephalosporins a r 2 = 0.020 P = 0.584 1.4 (b) 0.10 0.30 1.4 1.6 0.3 0.09 0.03 1.5 2.3 0.29 0.16 0.27 3.2 2.5 1.7 2.5 1.8 0.15 0.85 0.36 0.27 7.4 4.5 0.43 2.8 0.61 0.75 Incidence of CDI (per 10 000 patient bed-days) Incidence of CDI (per 10 000 patient bed-days) Incidence of CDI (per 10 000 patient bed-days) 0 0 1 2 3 4 5 6 7 8 Cephalosporin use (DDD per 1000 inhabitants per day) 35 Second- and third-generation cephalosporins 30 r 2 = 0.114 25 P = 0.184 20 15 10 5 0 0 1 2 3 4 5 6 7 8 Cephalosporin use (DDD per 1000 inhabitants per day) 35 All cephalosporins a 30 25 20 15 10 5 0 0 0.2 0.4 0.6 0.8 1.0 Cephalosporin use (DDD per 1000 inhabitants per day) 35 Second- and third-generation cephalosporins 30 25 20 15 10 5 0 0 0.2 0.4 0.6 0.8 1.0 Cephalosporin use r 2 = 0.068 P = 0.389 r 2 = 0.049 P = 0.466 Downloaded from <strong>http</strong>://<strong>jac</strong>.<strong>oxfordjournals</strong>.<strong>org</strong>/ by guest on September 28, 2016 (DDD per 1000 inhabitants per day) 2of18
Review JAC antibiotics. 13 Additional potential sources of bias include sampling bias (meaning that commonly prescribed antibiotics will be more often reported as being associated with cases), selection of inappropriate controls and misclassification of C. difficile. In addition, studies may be open to clinical susceptibility bias, whereby patients with illnesses requiring antibiotics may have inherent increased risks of developing CDI, and cases may therefore be falsely attributed solely to the clinically indicated use of antibiotics. 13 Furthermore, there were between-study differences in patient populations which, importantly, may have included different levels of exposure to C. difficile. 13 Notably, most of the data on CDI have been collected from observational studies in the context of outbreaks, 14 and therefore may not reflect the risk of CDI in the non-epidemic setting. Finally, the assumption that all antibiotics within a given class are equally associated with CDI risk is not well founded. Notably, differences in pharmacokinetics among cephalosporins, particularly the route of excretion, can mean that exposures of the gut microbiome and C. difficile vary markedly. Antibiotic stewardship programmes have been established in an attempt to optimize and sustain the utility of antibiotics; this includes reducing the rates of resistance and hospital-associated CDI. Some policies are focused on the restriction of cephalosporin prescribing. 15 For example, in 2008, the UK Department of Health and Public Health England recommended that NHS hospitals should develop restrictive antibiotic guidelines specifying the use of narrow-spectrum agents alone or as combination therapy. 16 The guidelines specifically highlighted that the use of clindamycin and second- and third-generation cephalosporins should be avoided, especially in the elderly; reduced use of fluoroquinolones and carbapenems was also advocated. 16 As data accumulate linking other broad-spectrum antibiotics to CDI, we consider it timely to reassess the evidence for the potential association of CDI with cephalosporins in Europe, to explore whether cephalosporins still have a role in the era of CDI. Pattern of cephalosporin use and incidence of CDI across Europe EUCLID (the EUropean, multicentre, prospective biannual point prevalence study of CLostridium difficile Infection in hospitalized patients with Diarrhoea) is the largest and most comprehensive study of CDI epidemiology ever performed in Europe. 17 The study involved a total of 482 hospitals in 20 European countries. Hospitals provided details on local policies for CDI testing and reporting, and the laboratory methods used for CDI diagnosis, together with local testing rates and CDI rates. 17 Data were collected from participating hospitals for the periods September 2011–August 2012 and September 2012–August 2013. In addition, on two sampling days (one day in winter 2012–13 and one day in summer 2013), hospitals sent all diarrhoeal samples submitted to their microbiology laboratory for standardized CDI testing at national coordinating laboratories. 17 The results obtained by optimized testing were compared with local data. EUCLID documented an increase in the reported annual incidence of CDI from 6.6 cases per 10000 patient bed-days in 2011– 12 to 7.3 cases per 10000 patient bed-days in 2012–13. 17 Furthermore, analysis of data from the two sampling days revealed that 23% of CDI cases were missed owing to lack of clinical suspicion [i.e. samples that were not originally tested by the participating hospital tested positive for CDI (defined as testing positive for both glutamate dehydrogenase and C. difficile toxin) at the national coordinating laboratory]. Overall, and taking into account false negatives from local hospitals, each hospital missed an average of 82 cases per year. Across the 482 participating hospitals, there could be as many as 40000 inpatients per year not diagnosed with CDI as a result of suboptimal testing or lack of clinical suspicion. 17 Cephalosporin use and incidence of CDI in individual European countries Data on the reported incidence of CDI by country across Europe for 2012–13 are presented in Figure 1. CDI incidence (given in cases per 10000 patient bed-days) varied widely across Europe, ranging from ,1 inBulgariato.20 in Finland. 17 When the EUCLID CDI rates are assessed in relation to data for overall cephalosporin usage across Europe (in both hospital and community settings), there is no clear association between cephalosporin prescribing and incidence of CDI (Figure 1). Antibiotic surveillance data from the ECDC show that although the use of any cephalosporin in the community setting varied widely across countries, from a defined daily dose (DDD) per 1000 inhabitants per day of 0.03 in the Netherlands to 7.4 in Greece, 18 there is no apparent association with CDI incidence [r 2 ¼ 0.020 (P ¼ 0.584); Figure 1a]; in fact, there is a weak inverse relationship, i.e. CDI incidence decreases as cephalosporin use increases. For example, cephalosporin usage in Sweden was among the lowest in Europe (0.2 DDD per 1000 inhabitants per day), 18 while the reported CDI incidence was among the highest (13.3 cases/10000 patient bed-days). 17 In addition, considerable variation in cephalosporin usage was observed across countries with similar reported CDI incidence, such as the UK and France (0.3 and 2.3 DDD per 1000 inhabitants per day, respectively). Confining the analysis to second- and thirdgeneration cephalosporins (the use of which should be restricted, accordingtoUKguidelines 16 ) produces similar results, with no apparent association observed between cephalosporin use and CDI incidence [r 2 ¼0.114 (P¼0.184); Figure 1a]. Similarly, there is no significant correlation between cephalosporin use and CDI incidence in the hospital setting [r 2 ¼ 0.068 (P¼0.389); Figure 1b]; apart from one country, as seen for community data (Figure 1a), there is a weak inverse relationship between CDI incidence and cephalosporin prescribing. For example, cephalosporin usage in the hospital setting in Bulgaria was among the highest in Europe (0.75 DDD per 1000 inhabitants per day), while reported Downloaded from <strong>http</strong>://<strong>jac</strong>.<strong>oxfordjournals</strong>.<strong>org</strong>/ by guest on September 28, 2016 Figure 1. Incidence of CDI and overall cephalosporin use in (a) the community and (b) hospital settings during 2012–13. The text overlay reports usage of first-, second-, third- and fourth-generation cephalosporins in EU/EEA countries in 2013, expressed as DDD per 1000 inhabitants and per day, if available. Community/hospital usage of second- and third-generation cephalosporins (as a percentage of first-, second-, third- and fourth-generation usage) is: Belgium, 92.8/53.6; Bulgaria, 82.1/87.0; Czech Republic, 94.5/NA; Finland, 2.6/77.9; France, 97.7/75.0; Germany, 97.8/NA; Greece, 100/94.1; Hungary, 99.4/90.1; Ireland, 85.3/95.8; Italy, 96.4/78.8; Netherlands, 100/71.3; Poland, 95.2/NA; Portugal, 77.6/67.4; Slovakia, 95.6/ 89.2; Spain, 99.4/NA; Sweden, 18.8/94.0; UK, 11.8/73.1. Data are from the ECDC. 18 Regression analyses are based on least-squares means. CDI incidence data for 2012–13 are from Davies et al. 17 a Includes data for first-, second-, third- and fourth-generation cephalosporins. 3of18