“When
x8QZh
x8QZh

Create successful ePaper yourself
Turn your PDF publications into a flip-book with our unique Google optimized e-Paper software.
Oklahoma<br />
Volume 6, Issue 11 • November 30, 2016<br />
Economic Report TM<br />
News and analysis of Oklahoma’s economy<br />
A publication of the Office of the State Treasurer • Treasurer Ken Miller, Ph.D.<br />
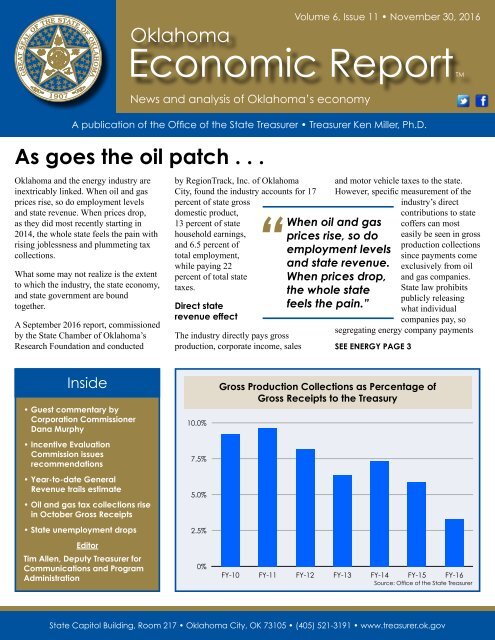
As goes the oil patch . . .<br />
Oklahoma and the energy industry are<br />
inextricably linked. When oil and gas<br />
prices rise, so do employment levels<br />
and state revenue. When prices drop,<br />
as they did most recently starting in<br />
2014, the whole state feels the pain with<br />
rising joblessness and plummeting tax<br />
collections.<br />
What some may not realize is the extent<br />
to which the industry, the state economy,<br />
and state government are bound<br />
together.<br />
A September 2016 report, commissioned<br />
by the State Chamber of Oklahoma’s<br />
Research Foundation and conducted<br />
by RegionTrack, Inc. of Oklahoma<br />
City, found the industry accounts for 17<br />
percent of state gross<br />
domestic product,<br />
13 percent of state<br />
household earnings,<br />
and 6.5 percent of<br />
total employment,<br />
while paying 22<br />
percent of total state<br />
taxes.<br />
Direct state<br />
revenue effect<br />
The industry directly pays gross<br />
production, corporate income, sales<br />
<strong>“When</strong> oil and gas<br />
prices rise, so do<br />
employment levels<br />
and state revenue.<br />
When prices drop,<br />
the whole state<br />
feels the pain.”<br />
and motor vehicle taxes to the state.<br />
However, specific measurement of the<br />
industry’s direct<br />
contributions to state<br />
coffers can most<br />
easily be seen in gross<br />
production collections<br />
since payments come<br />
exclusively from oil<br />
and gas companies.<br />
State law prohibits<br />
publicly releasing<br />
what individual<br />
companies pay, so<br />
segregating energy company payments<br />
SEE ENERGY PAGE 3<br />
Inside<br />
• Guest commentary by<br />
Corporation Commissioner<br />
Dana Murphy<br />
• Incentive Evaluation<br />
Commission issues<br />
recommendations<br />
• Year-to-date General<br />
Revenue trails estimate<br />
• Oil and gas tax collections rise<br />
in October Gross Receipts<br />
• State unemployment drops<br />
Editor<br />
Tim Allen, Deputy Treasurer for<br />
Communications and Program<br />
Administration<br />
10.0%<br />
7.5%<br />
5.0%<br />
2.5%<br />
0%<br />
Gross Production Collections as Percentage of<br />
Gross Receipts to the Treasury<br />
FY-10 FY-11 FY-12 FY-13 FY-14 FY-15 FY-16<br />
Source: Office of the State Treasurer<br />
State Capitol Building, Room 217 • Oklahoma City, OK 73105 • (405) 521-3191 • www.treasurer.ok.gov
Oklahoma Economic Report TM November 30, 2016<br />
Guest Commentary<br />
By Dana Murphy, Corporation Commissioner<br />
The more things change . . .<br />
On December 3, 1934, Oklahoma<br />
Governor-elect E.W. Marland<br />
met with the governors of Texas and<br />
Kansas. On the agenda: A bold new<br />
plan being pushed by Oklahoma to<br />
bring states together in a cooperative<br />
arrangement to foster the sound<br />
development of oil and natural gas<br />
resources. From these talks came<br />
the Interstate Oil and Gas Compact<br />
Commission.<br />
Back then, the issue was what was<br />
called “waste.” In part, this was the<br />
result of a gold-rush mentality and<br />
uncontrolled development, which was<br />
itself brought about by advances in<br />
drilling technology. “Waste” included<br />
large amounts of oil spilled on the<br />
ground, rather than making it to<br />
market.<br />
Nowadays we would categorize such<br />
a problem as both environmental<br />
and financial. Oklahoma was among<br />
the first of the large producing<br />
states to adopt “anti-waste” law,<br />
laying the groundwork for modern<br />
environmental regulation that seeks<br />
to ensure that Oklahoma’s oil and<br />
gas resources are developed in a safe,<br />
economically beneficial manner.<br />
The idea of bringing states together to<br />
work on the problem to their mutual<br />
benefit was very much “outside the<br />
box” thinking, and represented a<br />
fresh, creative approach to a new<br />
problem.<br />
Fast-forward more than 80 years<br />
and one finds that “the more things<br />
change, the more they stay the same.”<br />
The sweep of technological change in<br />
the oil and gas industry, particularly<br />
over the past decade, cannot be<br />
overstated.<br />
“America has gone<br />
from an oil and gas<br />
‘has-been’ to being a<br />
real threat to OPEC’s<br />
and Russia’s market<br />
dominance – so<br />
much so that a price<br />
war was launched<br />
that in part targeted<br />
U.S. producers.”<br />
Horizontal drilling using the<br />
technologies undreamed of only a<br />
relatively short time ago has unlocked<br />
oil and natural gas resources to an<br />
extent that America has gone from<br />
an oil and gas “has-been” to being a<br />
real threat to OPEC’S and Russia’s<br />
market dominance – so much so that<br />
a price war was launched that in part<br />
targeted U.S. producers.<br />
But with all that change has<br />
come new problems. Just as our<br />
counterparts of 1934, we face a<br />
changed world and the need for<br />
fresh new approaches to solving the<br />
challenges presented by that change.<br />
Horizontal drilling has not only<br />
unlocked huge amounts of oil<br />
and natural gas; it also unlocked<br />
vast amounts of water from the<br />
formations that must be disposed of<br />
without raising the risk for induced<br />
earthquakes while still protecting our<br />
precious fresh water.<br />
The rules and laws that served to<br />
protect the rights of mineral owners<br />
and producers were written when<br />
prominent development was through<br />
vertical wells. Applying a vertical<br />
regulatory scheme to one now<br />
dominated by horizontal wells is the<br />
proverbial square peg in a round hole.<br />
The difficulties and complexities<br />
created by this “horizontal world”<br />
SEE MURPHY PAGE 3<br />
www.treasurer.ok.gov • Page 2
Oklahoma Economic Report TM November 30, 2016<br />
Murphy<br />
FROM PAGE 2<br />
seem overwhelming at times.<br />
However, in order to tackle a<br />
problem, one has to admit to its<br />
existence.<br />
Those who gathered in 1934 faced no<br />
less daunting a set of circumstances.<br />
They and others joined together to<br />
meet the challenges. Oklahoma’s<br />
oil and gas history has been a long<br />
series of chapters of challenges and<br />
changes.<br />
I see that same effort every day in<br />
countless ways, and it is largely<br />
a cooperative one. Industry,<br />
government, and researchers are<br />
working to meet today’s challenges<br />
with an eye toward the future’s<br />
challenges.<br />
The journey may be different, but<br />
the goal is the same: Meeting the<br />
energy needs of the nation in an<br />
economically and environmentally<br />
safe manner.<br />
I am honored to have the opportunity<br />
to be part of today’s and tomorrow’s<br />
solutions for Oklahoma and the<br />
nation.<br />
Energy<br />
FROM PAGE 1<br />
into the other revenue streams is not<br />
possible.<br />
As shown in the graph on page 1, in<br />
the past seven fiscal years – FY-10<br />
through FY-16 – gross production taxes<br />
accounted for between 9.6 percent and<br />
3.3 percent of total Gross Receipts to<br />
the Treasury. Collections ranged from<br />
just more than $978 million in FY-11,<br />
when the average price of benchmark<br />
West Texas Intermediate Crude Oil sold<br />
for $85.22 per barrel, to a low of $367<br />
million in FY-16, when benchmark<br />
crude sold for $43.71 per barrel.<br />
$110.00<br />
Crude Oil – Price vs. Gross Production Collections<br />
$60<br />
During those years, monthly natural gas<br />
prices have ranged from $6 per million<br />
Btu in February 2014 to $1.73 in March<br />
2016.<br />
Price per barrel<br />
$82.50<br />
$55.00<br />
$27.50<br />
$0<br />
West Texas Intermediate Crude Oil Prices<br />
Crude Oil Gross Production Tax Collections<br />
Jan-11<br />
Feb-11<br />
Mar-11<br />
Apr-11<br />
May-11<br />
Jun-11<br />
Jul-11<br />
Aug-11<br />
Sep-11<br />
Oct-11<br />
Nov-11<br />
Dec-11<br />
Jan-12<br />
Feb-12<br />
Mar-12<br />
Apr-12<br />
May-12<br />
Jun-12<br />
Jul-12<br />
Aug-12<br />
Sep-12<br />
Oct-12<br />
Nov-12<br />
Dec-12<br />
Jan-13<br />
Feb-13<br />
Mar-13<br />
Apr-13<br />
May-13<br />
Jun-13<br />
Jul-13<br />
Aug-13<br />
Sep-13<br />
Oct-13<br />
Nov-13<br />
Dec-13<br />
Jan-14<br />
Feb-14<br />
Mar-14<br />
Apr-14<br />
May-14<br />
Jun-14<br />
Jul-14<br />
Aug-14<br />
Sep-14<br />
Oct-14<br />
Nov-14<br />
Dec-14<br />
Jan-15<br />
Feb-15<br />
Mar-15<br />
Apr-15<br />
May-15<br />
Jun-15<br />
Jul-15<br />
Aug-15<br />
Sep-15<br />
Oct-15<br />
Nov-15<br />
Dec-15<br />
Jan-16<br />
Feb-16<br />
Mar-16<br />
Apr-16<br />
May-16<br />
Jun-16<br />
Jul-16<br />
Sources: U.S. Energy Information Administration and Oklahoma Tax Commission<br />
$45<br />
$30<br />
$15<br />
$0<br />
Gross Production collections in $ millions<br />
Drilling activity has also varied greatly<br />
for both oil and natural gas. Monthly rig<br />
counts for oil have ranged from 199 in<br />
October 2014 to 14 in June 2010. For<br />
natural gas, rig counts from ranged from<br />
140 in September and October of 2011<br />
to 1 in May 2015.<br />
The graph on this page shows the direct<br />
link between benchmark crude prices<br />
and oil gross production collections. A<br />
comparison of natural gas prices to gas<br />
gross production collections shows the<br />
same linkage.<br />
SEE ENERGY PAGE 4<br />
Opinions and positions cited in the Oklahoma Economic Report TM<br />
are not necessarily those of Oklahoma State Treasurer Ken Miller or<br />
his staff, with the exception of the Treasurer’s Commentary, which of course, is the viewpoint of the treasurer.<br />
www.treasurer.ok.gov • Page 3
Oklahoma Economic Report TM November 30, 2016<br />
Energy<br />
FROM PAGE 3<br />
A cursory analysis of gross production<br />
collections has yet to show the effect of<br />
changes approved in tax rates in 2015.<br />
All new production is now taxed at a<br />
rate of 2 percent for the first 36 months<br />
and then at a 7 percent rate. Previously,<br />
certain types of well, such as those<br />
horizontally drilled, were initially taxed<br />
at a 1 percent rate.<br />
Demonstrating the linkage<br />
The claim that oil and gas activity<br />
and prices have a profound effect on<br />
the state economy is perhaps best<br />
demonstrated by the graph at the bottom<br />
of this page.<br />
It compares Gross Receipts to the<br />
Treasury to employment levels in the<br />
Mining and Logging supersector, which<br />
in Oklahoma equates to oil and gas jobs.<br />
As the number of those employed in<br />
the oil fields rises and falls, so, too, do<br />
Oil & Gas Employment<br />
gross state tax receipts within a two to<br />
four month lag. For example, during<br />
the Great Recession employment levels<br />
turned downward in November 2008<br />
and state gross receipts followed suit<br />
in January 2009, two months later. The<br />
recovery in gross receipts began four<br />
months after employment levels began<br />
to rebound.<br />
The latest downturn in revenue<br />
began three months after oil and gas<br />
employment levels began to fall.<br />
Total economic effect<br />
The indirect impact of an industry<br />
as large as oil and gas reaches deep<br />
into nearly every sector of the state’s<br />
economy.<br />
The State Chamber report states that<br />
in addition to $37.1 billion in average<br />
annual output of goods and services, the<br />
energy industry supports an estimated<br />
$28.6 billion in spillover. The industry,<br />
according to the report, is responsible<br />
Gross Receipts to the Treasury/Oil & Gas Employment<br />
January 2008 – October 2016<br />
65.0<br />
57.5<br />
50.0<br />
42.5<br />
Shaded area denotes U.S. recession<br />
$12.25<br />
$11.50<br />
$10.75<br />
$10.00<br />
12-Month Gross Receipts (in $ billions)<br />
Oil & Gas Employment (in thousands)<br />
35.0<br />
$9.25<br />
08 09 10 11 12 13 14 15 16 17<br />
12-Month Gross Receipts<br />
Sources: Bureau of Labor Statistics & State Treasurer<br />
for $65.7 million in total state output.<br />
When spillover is included, the report<br />
says 27 percent, or $32.6 billion, of total<br />
state household income is supported by<br />
the energy sector.<br />
In the labor market, almost 1 in 5<br />
wage and salary workers and the selfemployed<br />
are employed either directly<br />
or indirectly by the energy industry in<br />
Oklahoma, according to the report.<br />
Even though employment levels have<br />
decreased during the recent state<br />
recession, the economic study shows<br />
that on a five-year average the industry<br />
has employed 133,800 self-employed<br />
proprietors and wage and salary<br />
workers. That has generated total annual<br />
income of $15.35 billion, according to<br />
the study.<br />
The report estimates average annual<br />
purchases of $11.3 billion from statebased<br />
suppliers by the industry. Plus,<br />
an estimated $1.7 billion in oil and gas<br />
royalties were paid to Oklahomans in<br />
2015.<br />
As measured by the energy sector’s<br />
share of state household income, the<br />
Chamber report says Oklahoma remains<br />
as sensitive to the energy sector as in<br />
1982.<br />
Learn more<br />
Read the State Chamber’s Research<br />
Foundation report: Economic<br />
Impact of the Oil & Gas Industry on<br />
Oklahoma.<br />
Read the State Treasurer’s Gross<br />
Receipts to the Treasury reports.<br />
www.treasurer.ok.gov • Page 4
Oklahoma Economic Report TM November 30, 2016<br />
Incentive Evaluation Commission issues recommendations<br />
The Incentive Evaluation Commission<br />
(IEC), established by the Legislature<br />
in 2015 to make recommendations on<br />
changes to Oklahoma’s tax incentives,<br />
has issued its first annual report.<br />
The first incentive on the chopping<br />
block is the zero-emission tax credit<br />
for the wind power industry. Current<br />
law allows companies that come online<br />
before the beginning of 2021 to claim<br />
the credit, which IEC consultants say<br />
could cost the state $100 million each<br />
year through 2030.<br />
The IEC agreed with the consultant’s<br />
recommendation that the Legislature<br />
reconfigure the credit to either establish<br />
a program cap or accelerate closing<br />
the window for eligibility. The project<br />
team also recommended that facilities<br />
claiming a credit be required to provide<br />
monthly data relating to use of the<br />
credit.<br />
Year-to-date General Revenue trails estimate by 1.8 percent<br />
After one-third of FY-17, allocations<br />
to the General Revenue Fund (GRF)<br />
trail the estimate by $30.5 million, or<br />
1.8 percent, according to the Office of<br />
Management and Enterprise Services<br />
(OMES).<br />
At the end of October, two of the GRF’s<br />
four major revenue streams exceed the<br />
estimate.<br />
Net income tax and gross production tax<br />
top the estimate by a combined $19.8<br />
million. Sales tax and motor vehicle tax<br />
allocations are less than the estimate by<br />
a combined total of $46.6 million.<br />
In the first four months of the current<br />
fiscal year, GRF collections have been<br />
less than the estimate three times.<br />
In the 52 months since July 2012, the<br />
beginning of FY-13, GRF allocations<br />
have been less than the estimate 35<br />
times, or in just more than two-thirds of<br />
the months.<br />
In each of the past four fiscal years,<br />
total GRF collections have been below<br />
the official estimate. Except for FY-16<br />
when revenue failure was declared and<br />
across-the-board cuts were ordered for<br />
appropriated state agencies, total fiscal<br />
year allocations have been within the 5<br />
percent cushion established in the state<br />
constitution.<br />
Monthly General Revenue Fund Allocations vs. Estimate<br />
(percentage difference)<br />
40%<br />
FY-13<br />
-0.5%<br />
FY-14<br />
-4.8%<br />
FY-15<br />
-2.2%<br />
FY-16<br />
-9.4%<br />
FY-17 YTD<br />
-1.8%<br />
20%<br />
0%<br />
-20%<br />
Jul-12<br />
Oct-12<br />
Jan-13<br />
Apr-13<br />
Jul-13<br />
Oct-13<br />
Jan-14<br />
Apr-14<br />
Jul-14<br />
Oct-14<br />
Jan-15<br />
Apr-15<br />
Jul-15<br />
Oct-15<br />
Jan-16<br />
Apr-16<br />
Jul-16<br />
Oct-16<br />
Source: Office of Management and Enterprise Services<br />
www.treasurer.ok.gov • Page 5
Oklahoma Economic Report TM November 30, 2016<br />
October Gross<br />
Receipts &<br />
General Revenue<br />
compared<br />
October Gross Receipts to the<br />
Treasury totalled $886.2 million,<br />
while the General Revenue<br />
Fund (GRF), as reported by the<br />
Office of Management and<br />
Enterprise Services, received<br />
$390.9 million, or 44.1%, of the<br />
total.<br />
The GRF received between<br />
29.7% and 52.8% of monthly<br />
gross receipts during the past<br />
12 months.<br />
From October gross receipts,<br />
the GRF received:<br />
• Individual income tax: 55.4%<br />
• Corporate income tax: None<br />
• Sales tax: 43.4%<br />
Oil and gas tax collections rise in<br />
October Gross Receipts to the Treasury<br />
(Original release date: November 8,<br />
2016.)<br />
For the first time in almost two<br />
years, October tax<br />
collections from<br />
the production of<br />
oil and natural gas<br />
topped collections<br />
from the same month<br />
of the prior year,<br />
State Treasurer Ken<br />
Miller announced<br />
today as he released<br />
the monthly Gross<br />
Receipts to the<br />
Treasury report.<br />
While still significantly lower than<br />
collections prior to the ongoing oil<br />
price slump, October gross production<br />
collections of $35.1 million were above<br />
“It’s not yet time<br />
to sing ‘Happy<br />
Days Are Here<br />
Again,’ but this<br />
month’s gross<br />
production number<br />
is welcome news.”<br />
October 2015 collections by $2.9<br />
million, or 8.9 percent. The last time<br />
monthly gross production collections<br />
topped those of the prior year was in<br />
December 2014, when<br />
receipts totaled $72.1<br />
million.<br />
“It’s not yet time to<br />
sing ‘Happy Days<br />
Are Here Again,’ but<br />
this month’s gross<br />
production number is<br />
welcome news,” Miller<br />
said. “Since April,<br />
we’ve seen monthly<br />
gross production<br />
collections generally rise along with<br />
crude oil prices. Passing the prior year<br />
threshold this month is encouraging.”<br />
SEE REVENUE PAGE 7<br />
• Gross production-Gas: 67.2%<br />
• Gross production-Oil: 8.7%<br />
• Motor vehicle tax: 27.1%<br />
• Other sources: 37.6%<br />
$50<br />
$25<br />
Monthly Gross Receipts vs. Prior Year<br />
October GRF allocations are<br />
below the estimate by $47.3<br />
million, or 10.8%. Year-to-date<br />
GRF revenue trail the estimate<br />
by $30.5 million or 1.8%.<br />
October insurance premium<br />
taxes totaled $105,673, a<br />
decrease of $279,671, or 72.6%,<br />
from the prior year.<br />
Tribal gaming fees generated<br />
$11.2 million during the month,<br />
up by $503,942, or 4.7%, from<br />
last October.<br />
$0<br />
-$25<br />
-$50<br />
-$75<br />
-$100<br />
-$125<br />
Nov-15<br />
Income Tax<br />
Sales Tax<br />
Dec-15<br />
Jan-16<br />
Gross Production<br />
Motor Vehicle<br />
Feb-16<br />
Dollar change (in millions) from prior year<br />
Other<br />
Mar-16<br />
Apr-16<br />
May-16<br />
Jun-16<br />
Jul-16<br />
Aug-16<br />
Sep-16<br />
Oct-16<br />
Source: Office of the State Treasurer<br />
www.treasurer.ok.gov • Page 6
Oklahoma Economic Report TM November 30, 2016<br />
Revenue<br />
FROM PAGE 6<br />
October gross production collections<br />
are based on production activity from<br />
August when benchmark West Texas<br />
Intermediate crude oil sold for $44.72<br />
per barrel.<br />
An apparent trough was reached last<br />
April when gross production collections,<br />
(in millions)<br />
$100<br />
$80<br />
$60<br />
$40<br />
$20<br />
based on February prices of $30.32<br />
per barrel, dropped to a 17-year low of<br />
$20.8 million.<br />
Gross Production Tax Collections<br />
November 2013 – October 2016<br />
Current 12 months<br />
Oil and gas tax collections<br />
notwithstanding, all other major revenue<br />
streams – income, sales, and motor<br />
vehicle taxes – were lower in October<br />
and total monthly Gross Receipts to<br />
the Treasury continued a 20-month<br />
contraction. October collections, at<br />
$886.2 million, were down by 3.5<br />
percent from October of last year. The<br />
last time October collections were lower<br />
was in 2011. Collections during the<br />
past 12 months, at $10.9 billion, are the<br />
lowest since March 2012.<br />
About Gross Receipts to the<br />
Treasury<br />
Since March 2011, the Treasurer’s<br />
Office has issued the monthly Gross<br />
Receipts to the Treasury report, which<br />
provides a timely and broad view of the<br />
state’s macro economy.<br />
FOR RELEASE: November 18, 2016<br />
It is provided in conjunction with the<br />
General Revenue Fund (GRF) report<br />
from the Office of Management and<br />
OKLAHOMA EMPLOYMENT REPORT<br />
Enterprise Services,<br />
– October<br />
which provides<br />
2016<br />
information to state agencies for<br />
Oklahoma unemployment rate down<br />
budgetary<br />
slightly<br />
purposes.<br />
in<br />
The<br />
October<br />
GRF receives<br />
One year prior Two years prior<br />
about half of the state’s gross receipts<br />
Oklahoma’s seasonally adjusted unemployment rate edged down with 0.1 the percentage remainder point paid in to rebates 5.2 percent and in<br />
October, while the U.S. unemployment rate was little changed at refunds, 4.9 percent remitted in October. cities The and state’s counties, seasonal<br />
adjusted unemployment rate Source: was Oklahoma up by 1.0 Tax percentage Commission point compared and placed to into October earmarks 2015. to other funds.<br />
$0<br />
Nov Dec Jan Feb Mar Apr May Jun Jul Aug Sep Oct<br />
Unemp.<br />
State unemployment notches October 2016 down slightly in October<br />
rate*<br />
Oklahoma’s seasonally-adjusted<br />
unemployment rate fell by one-tenth<br />
of one percentage points in October,<br />
ending eight months of increases, figures<br />
released by the Oklahoma Employment<br />
Security Commission show.<br />
In addition, September’s state jobless<br />
rate was revised to 5.3 percent from<br />
a preliminary 5.2 percent. October<br />
marks the fourth consecutive month the<br />
Oklahoma unemployment rate has been<br />
higher than the national rate, which was<br />
set at 4.9 percent.<br />
Labor force* Employment* Unemployment*<br />
Oklahoma 5.2% 1,815,604 1,720,628 94,976<br />
United States 4.9% 159,712,000 151,925,000 7,787,000<br />
* Data adjusted for seasonal factors<br />
OKLAHOMA<br />
Oklahoma Unemployment Report<br />
October 2016<br />
Unemp.<br />
rate*<br />
Labor force* Employment* Unemployment*<br />
Oct '16 5.2% 1,815,604 1,720,628 94,976<br />
Sept '16 5.3% 1,815,694 1,720,369 95,325<br />
Aug '16 5.1% 1,821,459 1,729,204 92,255<br />
July '16 5.0% 1,834,543 1,743,047 91,496<br />
June '16 4.8% 1,850,770 1,761,046 89,724<br />
May '16 4.7% 1,864,194 1,776,399 87,795<br />
Oct '15 4.2% 1,845,974 1,768,887 77,087<br />
* Data adjusted for seasonal factors<br />
Source: OESC<br />
In October, statewide www.treasurer.ok.gov seasonally adjusted employment • Page 7 grew by 259 persons (0.0 percent), and
Oklahoma Economic Report TM<br />
November 30, 2016<br />
Economic Indicators<br />
11.0<br />
Unemployment Rate<br />
January 1980 – October 2016<br />
65.0<br />
Gross Receipts vs. Oil & Gas Employment<br />
January 2008 – October 2016<br />
$12.25<br />
9.0<br />
7.0<br />
5.0<br />
3.0<br />
U.S.<br />
Oklahoma<br />
1.0<br />
80 82 84 86 88 90 92 94 96 98 00 02 04 06 08 10 12 14 16<br />
Shaded areas denote U.S. recessions<br />
OK-5.2%<br />
U.S.-4.9%<br />
Source: Bureau of Labor Statistics<br />
Oil & Gas Employment<br />
57.5<br />
50.0<br />
42.5<br />
12-Month Gross Receipts (in $ billions)<br />
Oil & Gas Employment (in thousands)<br />
35.0<br />
$9.25<br />
08 09 10 11 12 13 14 15 16 17<br />
Shaded area denotes U.S. recession<br />
$11.50<br />
$10.75<br />
$10.00<br />
Sources: Bureau of Labor Statistics & State Treasurer<br />
12-Month Gross Receipts<br />
5.0<br />
2.5<br />
Leading Economic Index<br />
January 2001 – October 2016<br />
0<br />
U.S.<br />
8-2.5<br />
10 12 14 16<br />
-5.0<br />
Oklahoma<br />
01 02 03 04 05 06 07 08 09 10 11 12 13 14 15 16 17<br />
This graph predicts six-month economic movement by tracking leading indicators,<br />
including initial unemployment claims, interest rate spreads, manufacturing and earnings.<br />
Numbers above 0 indicate anticipated growth.<br />
Shaded areas denote U.S. recessions<br />
Source: Federal Reserve<br />
$70<br />
$50<br />
$30<br />
Avg. = $43.17<br />
Shaded area denotes U.S. recession<br />
Oklahoma Stock Index<br />
Top capitalized companies<br />
January 2009 – November 2016<br />
$43.70<br />
$10<br />
09 10 11 12 13 14 15 16 17<br />
Source: Office of the State Treasurer<br />
Oklahoma Natural Gas Prices & Active Rigs<br />
January 2011 – November 2016<br />
Oklahoma Oil Prices & Active Rigs<br />
January 2011 – November 2016<br />
200<br />
$8<br />
200<br />
Price<br />
$120<br />
Active Rigs<br />
150<br />
100<br />
50<br />
Price<br />
Active Rigs<br />
$6<br />
$4<br />
$2<br />
Price per MMBtu<br />
Active Rigs<br />
150<br />
100<br />
50<br />
Active<br />
Rigs<br />
$90<br />
$60<br />
$30<br />
Price per BBL<br />
0<br />
$0<br />
11 12 13 14 15 16 17<br />
Sources: Baker Hughes & U.S. Energy Information Administration<br />
0<br />
$0<br />
11 12 13 14 15 16 17<br />
Sources: Baker Hughes & U.S. Energy Information Administration<br />
www.treasurer.ok.gov • Page 8