Ten-Year Impacts of Burkina Faso’s BRIGHT Program
n?u=RePEc:mpr:mprres:2ecdd42bb503422b802ce20da2bf64b7&r=edu
n?u=RePEc:mpr:mprres:2ecdd42bb503422b802ce20da2bf64b7&r=edu

You also want an ePaper? Increase the reach of your titles
YUMPU automatically turns print PDFs into web optimized ePapers that Google loves.
APPENDIX C<br />
MATHEMATICA POLICY RESEARCH<br />
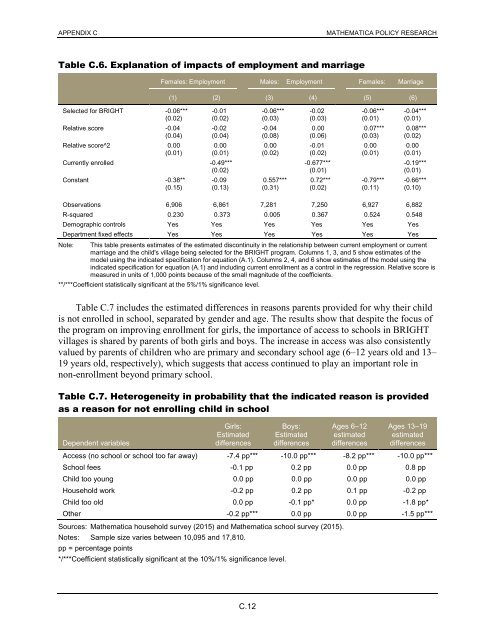
Table C.6. Explanation <strong>of</strong> impacts <strong>of</strong> employment and marriage<br />
Females: Employment Males: Employment Females: Marriage<br />
(1) (2) (3) (4) (5) (6)<br />
Selected for <strong>BRIGHT</strong> -0.06*** -0.01 -0.06*** -0.02 -0.06*** -0.04***<br />
(0.02) (0.02) (0.03) (0.03) (0.01) (0.01)<br />
Relative score -0.04 -0.02 -0.04 0.00 0.07*** 0.08***<br />
(0.04) (0.04) (0.08) (0.06) (0.03) (0.02)<br />
Relative score^2 0.00 0.00 0.00 -0.01 0.00 0.00<br />
(0.01) (0.01) (0.02) (0.02) (0.01) (0.01)<br />
Currently enrolled -0.49*** -0.677*** -0.19***<br />
(0.02) (0.01) (0.01)<br />
Constant -0.38** -0.09 0.557*** 0.72*** -0.79*** -0.66***<br />
(0.15) (0.13) (0.31) (0.02) (0.11) (0.10)<br />
Observations 6,906 6,861 7,281 7,250 6,927 6,882<br />
R-squared 0.230 0.373 0.005 0.367 0.524 0.548<br />
Demographic controls Yes Yes Yes Yes Yes Yes<br />
Department fixed effects Yes Yes Yes Yes Yes Yes<br />
Note:<br />
This table presents estimates <strong>of</strong> the estimated discontinuity in the relationship between current employment or current<br />
marriage and the child's village being selected for the <strong>BRIGHT</strong> program. Columns 1, 3, and 5 show estimates <strong>of</strong> the<br />
model using the indicated specification for equation (A.1). Columns 2, 4, and 6 show estimates <strong>of</strong> the model using the<br />
indicated specification for equation (A.1) and including current enrollment as a control in the regression. Relative score is<br />
measured in units <strong>of</strong> 1,000 points because <strong>of</strong> the small magnitude <strong>of</strong> the coefficients.<br />
**/***Coefficient statistically significant at the 5%/1% significance level.<br />
Table C.7 includes the estimated differences in reasons parents provided for why their child<br />
is not enrolled in school, separated by gender and age. The results show that despite the focus <strong>of</strong><br />
the program on improving enrollment for girls, the importance <strong>of</strong> access to schools in <strong>BRIGHT</strong><br />
villages is shared by parents <strong>of</strong> both girls and boys. The increase in access was also consistently<br />
valued by parents <strong>of</strong> children who are primary and secondary school age (6–12 years old and 13–<br />
19 years old, respectively), which suggests that access continued to play an important role in<br />
non-enrollment beyond primary school.<br />
Table C.7. Heterogeneity in probability that the indicated reason is provided<br />
as a reason for not enrolling child in school<br />
Dependent variables<br />
Girls:<br />
Estimated<br />
differences<br />
Boys:<br />
Estimated<br />
differences<br />
Ages 6–12<br />
estimated<br />
differences<br />
Ages 13–19<br />
estimated<br />
differences<br />
Access (no school or school too far away) -7.4 pp*** -10.0 pp*** -8.2 pp*** -10.0 pp***<br />
School fees -0.1 pp 0.2 pp 0.0 pp 0.8 pp<br />
Child too young 0.0 pp 0.0 pp 0.0 pp 0.0 pp<br />
Household work -0.2 pp 0.2 pp 0.1 pp -0.2 pp<br />
Child too old 0.0 pp -0.1 pp* 0.0 pp -1.8 pp*<br />
Other -0.2 pp*** 0.0 pp 0.0 pp -1.5 pp***<br />
Sources: Mathematica household survey (2015) and Mathematica school survey (2015).<br />
Notes: Sample size varies between 10,095 and 17,810.<br />
pp = percentage points<br />
*/***Coefficient statistically significant at the 10%/1% significance level.<br />
C.12