Ten-Year Impacts of Burkina Faso’s BRIGHT Program
n?u=RePEc:mpr:mprres:2ecdd42bb503422b802ce20da2bf64b7&r=edu
n?u=RePEc:mpr:mprres:2ecdd42bb503422b802ce20da2bf64b7&r=edu

You also want an ePaper? Increase the reach of your titles
YUMPU automatically turns print PDFs into web optimized ePapers that Google loves.
V. COST-EFFECTIVENESS AND COST-BENEFIT ANALYSIS MATHEMATICA POLICY RESEARCH<br />
Once we have the increased earnings for each cohort, we add up the additional earnings<br />
gained by all cohorts in the given year. So, for example, in 2009, only the 1994 cohort<br />
experiences an increase in earnings, whereas in 2010, the 1994 and 1995 cohorts are earning<br />
more. We then use the 10 percent discount rate to calculate the net present value <strong>of</strong> these<br />
earnings (as we did for the costs in each year); we present them in the second row <strong>of</strong> panels A<br />
and B in Table V.8.<br />
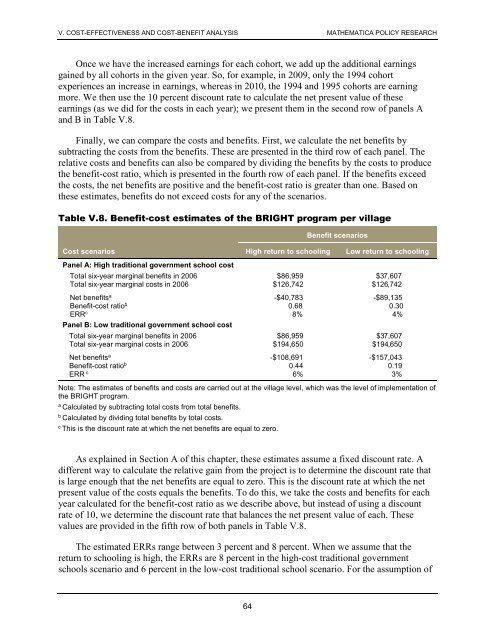
Finally, we can compare the costs and benefits. First, we calculate the net benefits by<br />
subtracting the costs from the benefits. These are presented in the third row <strong>of</strong> each panel. The<br />
relative costs and benefits can also be compared by dividing the benefits by the costs to produce<br />
the benefit-cost ratio, which is presented in the fourth row <strong>of</strong> each panel. If the benefits exceed<br />
the costs, the net benefits are positive and the benefit-cost ratio is greater than one. Based on<br />
these estimates, benefits do not exceed costs for any <strong>of</strong> the scenarios.<br />
Table V.8. Benefit-cost estimates <strong>of</strong> the <strong>BRIGHT</strong> program per village<br />
Benefit scenarios<br />
Cost scenarios High return to schooling Low return to schooling<br />
Panel A: High traditional government school cost<br />
Total six-year marginal benefits in 2006 $86,959 $37,607<br />
Total six-year marginal costs in 2006 $126,742 $126,742<br />
Net benefits a -$40,783 -$89,135<br />
Benefit-cost ratio b 0.68 0.30<br />
ERR c 8% 4%<br />
Panel B: Low traditional government school cost<br />
Total six-year marginal benefits in 2006 $86,959 $37,607<br />
Total six-year marginal costs in 2006 $194,650 $194,650<br />
Net benefits a -$108,691 -$157,043<br />
Benefit-cost ratio b 0.44 0.19<br />
ERR c 6% 3%<br />
Note: The estimates <strong>of</strong> benefits and costs are carried out at the village level, which was the level <strong>of</strong> implementation <strong>of</strong><br />
the <strong>BRIGHT</strong> program.<br />
a<br />
Calculated by subtracting total costs from total benefits.<br />
b<br />
Calculated by dividing total benefits by total costs.<br />
c<br />
This is the discount rate at which the net benefits are equal to zero.<br />
As explained in Section A <strong>of</strong> this chapter, these estimates assume a fixed discount rate. A<br />
different way to calculate the relative gain from the project is to determine the discount rate that<br />
is large enough that the net benefits are equal to zero. This is the discount rate at which the net<br />
present value <strong>of</strong> the costs equals the benefits. To do this, we take the costs and benefits for each<br />
year calculated for the benefit-cost ratio as we describe above, but instead <strong>of</strong> using a discount<br />
rate <strong>of</strong> 10, we determine the discount rate that balances the net present value <strong>of</strong> each. These<br />
values are provided in the fifth row <strong>of</strong> both panels in Table V.8.<br />
The estimated ERRs range between 3 percent and 8 percent. When we assume that the<br />
return to schooling is high, the ERRs are 8 percent in the high-cost traditional government<br />
schools scenario and 6 percent in the low-cost traditional school scenario. For the assumption <strong>of</strong><br />
64