

Working Papers
n?u=RePEc:war:wpaper:2016-36&r=ene
n?u=RePEc:war:wpaper:2016-36&r=ene

You also want an ePaper? Increase the reach of your titles
YUMPU automatically turns print PDFs into web optimized ePapers that Google loves.
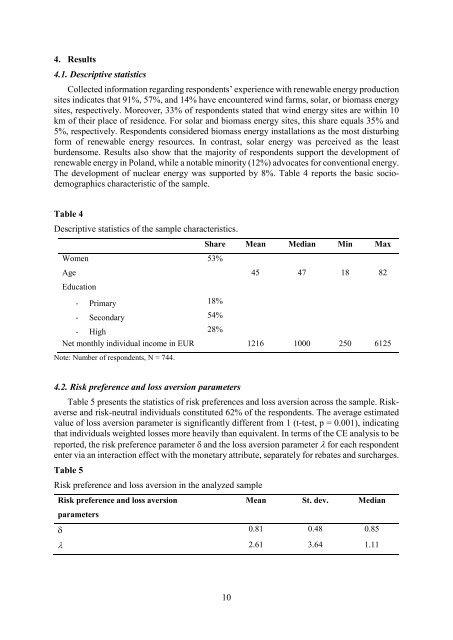
4. Results<br />
4.1. Descriptive statistics<br />
Collected information regarding respondents’ experience with renewable energy production<br />
sites indicates that 91%, 57%, and 14% have encountered wind farms, solar, or biomass energy<br />
sites, respectively. Moreover, 33% of respondents stated that wind energy sites are within 10<br />
km of their place of residence. For solar and biomass energy sites, this share equals 35% and<br />
5%, respectively. Respondents considered biomass energy installations as the most disturbing<br />
form of renewable energy resources. In contrast, solar energy was perceived as the least<br />
burdensome. Results also show that the majority of respondents support the development of<br />
renewable energy in Poland, while a notable minority (12%) advocates for conventional energy.<br />
The development of nuclear energy was supported by 8%. Table 4 reports the basic sociodemographics<br />
characteristic of the sample.<br />
Table 4<br />
Descriptive statistics of the sample characteristics.<br />
Women 53%<br />
Share Mean Median Min Max<br />
Age 45 47 18 82<br />
Education<br />
- Primary 18%<br />
- Secondary 54%<br />
- High 28%<br />
Net monthly individual income in EUR 1216 1000 250 6125<br />
Note: Number of respondents, N = 744.<br />
4.2. Risk preference and loss aversion parameters<br />
Table 5 presents the statistics of risk preferences and loss aversion across the sample. Riskaverse<br />
and risk-neutral individuals constituted 62% of the respondents. The average estimated<br />
value of loss aversion parameter is significantly different from 1 (t-test, p = 0.001), indicating<br />
that individuals weighted losses more heavily than equivalent. In terms of the CE analysis to be<br />
reported, the risk preference parameter and the loss aversion parameter for each respondent<br />
enter via an interaction effect with the monetary attribute, separately for rebates and surcharges.<br />
Table 5<br />
Risk preference and loss aversion in the analyzed sample<br />
Risk preference and loss aversion<br />
Mean St. dev. Median<br />
parameters<br />
0.81 0.48 0.85<br />
2.61 3.64 1.11<br />
10