Characterisation
2ikSYYV
2ikSYYV

Create successful ePaper yourself
Turn your PDF publications into a flip-book with our unique Google optimized e-Paper software.
4D Seismic Imaging<br />
Maersk Oil uses 4D seismic imaging as a key reservoir<br />
monitoring and production tool.<br />
Our recent survey of the Halfdan<br />
field in the Danish North Sea<br />
has produced what are arguably<br />
some of the best 4D images in<br />
the industry to date, and our<br />
proprietary technology has been<br />
responsible for a large part of<br />
that success.<br />
The fourth dimension in 4D<br />
seismic is time. When we repeat<br />
3D seismic surveys, months or<br />
years apart, we see changes in<br />
the seismic response, caused by<br />
fluid movements and changes in<br />
pressure due to the hydrocarbon<br />
production process, which in turn<br />
change the elastic properties of<br />
the rock.<br />
Changes in the subsurface cause<br />
both changes in the strength of<br />
reflections and subtle vertical<br />
shifts between seismic images.<br />
Rather than ignore the vertical<br />
shift, or merely correct for it,<br />
Jigsaw combines it with the<br />
reflection strength to enhance<br />
the 4D image.<br />
Integrating geostatistical<br />
constraints allows Jigsaw to<br />
reduce noise and produce<br />
coherent images which our<br />
engineers use to track processes<br />
such as where water goes when<br />
it is injected into the ground,<br />
and which parts of the reservoir<br />
benefit from the pressure support<br />
that water injection provides.<br />
Maersk Oil<br />
planned and<br />
executed the<br />
acquisition<br />
and processing<br />
of the data and<br />
performed all<br />
of the analysis<br />
and inversion<br />
projects for<br />
the 2005-<br />
2012 Danish<br />
Underground<br />
Consortium 4D<br />
project, which<br />
was used for<br />
30 inversion<br />
studies over<br />
4 major oil<br />
fields.<br />
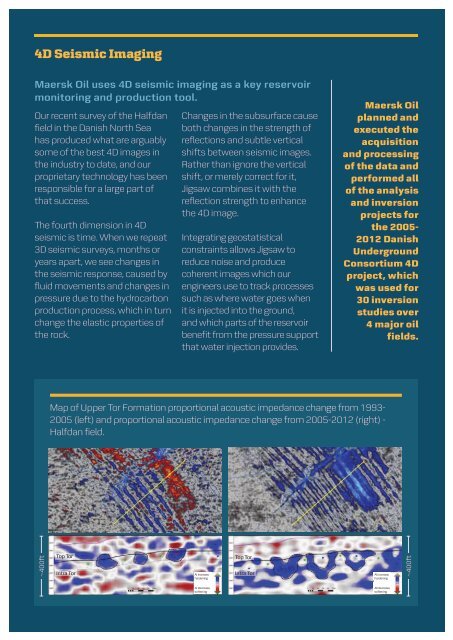
Map of Upper Tor Formation proportional acoustic impedance change from 1993-<br />
2005 (left) and proportional acoustic impedance change from 2005-2012 (right) -<br />
Halfdan field.<br />
~400ft<br />
Top Tor<br />
Intra Tor<br />
AI Increase,<br />
hardening<br />
Top Tor<br />
Intra Tor<br />
AI Increase,<br />
hardening<br />
~400ft<br />
AI Decrease,<br />
softening<br />
AI Decrease,<br />
softening