GEOmedia_3_2015_special_INTERGEO

Create successful ePaper yourself
Turn your PDF publications into a flip-book with our unique Google optimized e-Paper software.
<strong>INTERGEO</strong><br />
such as differences in<br />
hazard zones modeling<br />
and classification, coordinate<br />
systems, overlaps<br />
of different classification in<br />
cross-boundary areas, data<br />
availability and accessibility.<br />
Nevertheless it was possible to<br />
create a unified classification,<br />
in three hazard level, of all<br />
Italian flood areas, which may<br />
be substituted with new official<br />
data whose release is expected<br />
by June <strong>2015</strong>.<br />
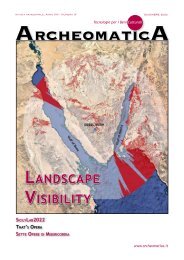
The combination of these two<br />
spatial datasets allow a quick<br />
evaluation of hazard exposure<br />
of insured assets overlapping<br />
buildings positions, generated<br />
by geocoding, and flood areas,<br />
with different hazard level:<br />
this superimposition is realized<br />
through a web-GIS tool accessible<br />
by insurance agents, providing<br />
a first feedback about<br />
properties at risk. When the<br />
feedback is positive agents may<br />
consider, depending on the value<br />
of the properties involved,<br />
whether to apply a standard<br />
fare related to the hazard level<br />
detected or to proceed with<br />
an on-site survey in order to<br />
acquire more detailed information<br />
about building position<br />
and features that might increase<br />
or reduce losses in case<br />
of flood.<br />
The pricing policy adopted by<br />
the insurance company follows<br />
a rewarding mechanism that<br />
make prices decrease when the<br />
hazard level is low or whenever<br />
flood-proofing measures, reducing<br />
buildings vulnerability,<br />
exist. On the contrary, policy<br />
premium for properties falling<br />
within frequently flooded areas<br />
with no mitigation measures<br />
adopted will increase. For this<br />
reason data collection on several<br />
parameters determining<br />
buildings vulnerability have to<br />
be submitted to the system in<br />
order to correctly define the<br />
Img. 3 - Flood areas and geocoded addresses in Vicenza city.<br />
policy price: such parameters<br />
concern, for instance, the<br />
accesses and openings elevation<br />
compared to the height<br />
reached by the water, the presence<br />
of underground floors,<br />
the position of values inside<br />
the building, the adoption of<br />
flood proofing measures.<br />
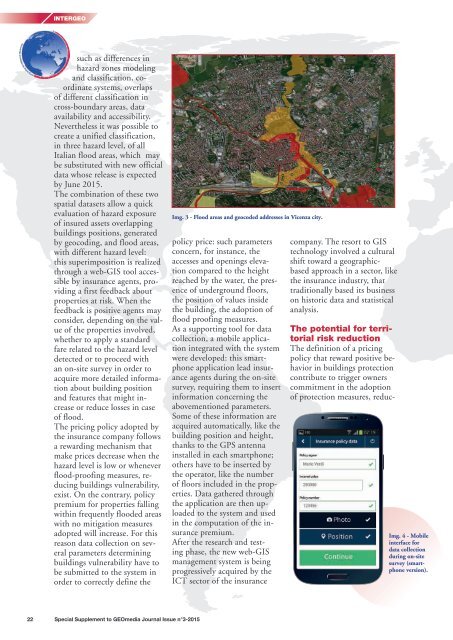
As a supporting tool for data<br />
collection, a mobile application<br />
integrated with the system<br />
were developed: this smartphone<br />
application lead insurance<br />
agents during the on-site<br />
survey, requiring them to insert<br />
information concerning the<br />
abovementioned parameters.<br />
Some of these information are<br />
acquired automatically, like the<br />
building position and height,<br />
thanks to the GPS antenna<br />
installed in each smartphone;<br />
others have to be inserted by<br />
the operator, like the number<br />
of floors included in the properties.<br />
Data gathered through<br />
the application are then uploaded<br />
to the system and used<br />
in the computation of the insurance<br />
premium.<br />
After the research and testing<br />
phase, the new web-GIS<br />
management system is being<br />
progressively acquired by the<br />
ICT sector of the insurance<br />
company. The resort to GIS<br />
technology involved a cultural<br />
shift toward a geographicbased<br />
approach in a sector, like<br />
the insurance industry, that<br />
traditionally based its business<br />
on historic data and statistical<br />
analysis.<br />
The potential for territorial<br />
risk reduction<br />
The definition of a pricing<br />
policy that reward positive behavior<br />
in buildings protection<br />
contribute to trigger owners<br />
commitment in the adoption<br />
of protection measures, reduc-<br />
Img. 4 - Mobile<br />
interface for<br />
data collection<br />
during on-site<br />
survey (smartphone<br />
version).<br />
22 Special Supplement to <strong>GEOmedia</strong> Journal Issue n°3-<strong>2015</strong>