

SPA 3e_ Teachers Edition _ Ch 6

You also want an ePaper? Increase the reach of your titles
YUMPU automatically turns print PDFs into web optimized ePapers that Google loves.
426<br />
C H A P T E R 6 • Sampling Distributions<br />
• The sampling distribution of p^ is less variable for larger samples. This is indicated<br />
by the !n in the denominator of the standard deviation formula.<br />
• The formula for the standard deviation of the distribution of p^ requires that the<br />
observations are independent. In practice, we are safe assuming independence<br />
when sampling without replacement as long as the sample size is less than 10%<br />
of the population size.<br />
Alternate Example<br />
Expensive ride?<br />
Mean and SD of the sampling<br />
distribution of p^<br />
PROBLEM: Suppose that 26% of all<br />
high school students at a large school<br />
spend about half or more of their<br />
earnings on a car. A random sample<br />
of 150 students from this school is<br />
surveyed. Let p^ 5 the proportion of<br />
students in the sample who spend about<br />
half or more of their earnings on a car.<br />
(a) Calculate the mean and standard<br />
deviation of the sampling distribution of p^ .<br />
(b) Interpret the standard deviation<br />
from part (a).<br />
SOLUTION:<br />
(a) m p^ = 0.26 and<br />
0.26(1− 0.26)<br />
s p^ =<br />
= 0.036<br />
Å 150<br />
(b) In SRSs of size n 5 150, the sample<br />
proportion of students who spend about<br />
half or more of their earnings on a car<br />
will typically vary by about 0.036 from<br />
the true proportion of p 5 0.26.<br />
a<br />
e XAMPLe<br />
What proportion of students have a smartphone?<br />
Mean and SD of the sampling distribution of p^<br />
PROBLEM: Suppose that 43% of students at a large high school own a smartphone. As part of a<br />
schoolwide technology study, the principal surveys an SRS of n 5 100 students. Let p^ 5 the proportion<br />
of students in the sample who own a smartphone.<br />
(a) Calculate the mean and the standard deviation of the sampling distribution of p^ .<br />
(b) Interpret the standard deviation from part (a).<br />
SOLUTION:<br />
0.43(1 − 0.43)<br />
(a) m p^ = 0.43 and s p^ = = 0.050<br />
Å 100<br />
(b) In SRSs of size n 5 100, the sample proportion of students<br />
who own a smartphone will typically vary by about 0.050 from<br />
the true proportion of p 5 0.43.<br />
d<br />
ThinK ABoUT iT Is the sampling distribution of p^ (the sample proportion of<br />
successes) related to the sampling distribution of X (the sample count of successes)?<br />
Yes!<br />
number of successes in sample<br />
p^ = = X sample size<br />
n<br />
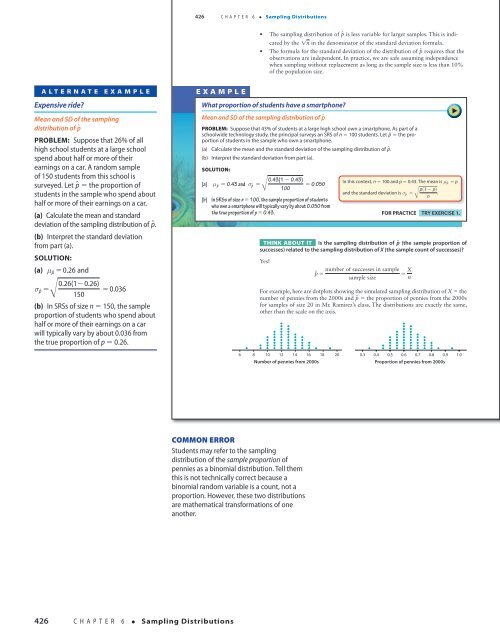
For example, here are dotplots showing the simulated sampling distribution of X 5 the<br />
number of pennies from the 2000s and p^ 5 the proportion of pennies from the 2000s<br />
for samples of size 20 in Mr. Ramirez’s class. The distributions are exactly the same,<br />
other than the scale on the axis.<br />
d<br />
d<br />
d<br />
d<br />
d<br />
d<br />
d<br />
d<br />
d<br />
d<br />
d<br />
d<br />
d<br />
d<br />
d<br />
d<br />
d<br />
d<br />
d<br />
d<br />
d<br />
d<br />
d<br />
d<br />
d<br />
d<br />
d<br />
d<br />
d<br />
d<br />
d<br />
d<br />
d<br />
6 8 10 12 14 16 18 20<br />
Number of pennies from 2000s<br />
d<br />
d<br />
d<br />
d<br />
d<br />
d<br />
d<br />
d<br />
d d<br />
d d<br />
d d d<br />
d<br />
In this context, n 5 100 and p 5 0.43. The mean is m p^ 5 p<br />
p(1 − p)<br />
and the standard deviation is s p^ 5 . Å n<br />
FOR PRACTICE TRY EXERCISE 1.<br />
d<br />
d d<br />
d d<br />
d d d<br />
d d d d<br />
d d d d d d<br />
d d d d d d<br />
d d d d d d d<br />
d d d d d d d d<br />
d d d d d d d d d d d<br />
0.3 0.4 0.5 0.6 0.7 0.8 0.9 1.0<br />
Proportion of pennies from 2000s<br />
Starnes_<strong>3e</strong>_CH06_398-449_Final.indd 426<br />
Common Error<br />
Students may refer to the sampling<br />
distribution of the sample proportion of<br />
pennies as a binomial distribution. Tell them<br />
this is not technically correct because a<br />
binomial random variable is a count, not a<br />
proportion. However, these two distributions<br />
are mathematical transformations of one<br />
another.<br />
18/08/16 5:01 PMStarnes_<strong>3e</strong>_CH0<br />
426<br />
C H A P T E R 6 • Sampling Distributions<br />
Starnes_<strong>3e</strong>_ATE_CH06_398-449_v3.indd 426<br />
11/01/17 3:56 PM

