

WIO bleaching alert-17-03-01
WIO bleaching alert-17-03-01
WIO bleaching alert-17-03-01

Create successful ePaper yourself
Turn your PDF publications into a flip-book with our unique Google optimized e-Paper software.
WESTERN INDIAN OCEAN – Regional coral <strong>bleaching</strong> <strong>alert</strong><br />
Bleaching Alert Level<br />
‘warning’ – indications of warmer<br />
conditions that may result in some<br />
<strong>bleaching</strong><br />
‘level 1’ – moderate <strong>bleaching</strong><br />
possible<br />
‘level 2’ – severe <strong>bleaching</strong> likely<br />
Letters in the brackets under the<br />
‘region’ column refer to the <strong>WIO</strong><br />
climatology regions, depicted in the<br />
map in the top right corner.<br />
DATE OF THIS ALERT: 1 March 20<strong>17</strong><br />
http://www.cordioea.net/<strong>bleaching</strong><strong>alert</strong>/<br />
Contact: <strong>bleaching</strong>@cordioea.net<br />
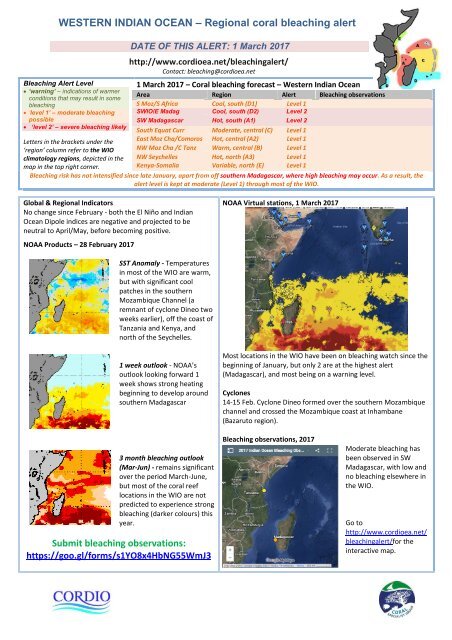
1 March 20<strong>17</strong> – Coral <strong>bleaching</strong> forecast – Western Indian Ocean<br />
Area Region Alert Bleaching observations<br />
S Moz/S Africa Cool, south (D1) Level 1<br />
S<strong>WIO</strong>/E Madag Cool, south (D2) Level 2<br />
SW Madagascar Hot, south (A1) Level 2<br />
South Equat Curr Moderate, central (C) Level 1<br />
East Moz Cha/Comoros Hot, central (A2) Level 1<br />
NW Moz Cha /C Tanz Warm, central (B) Level 1<br />
NW Seychelles Hot, north (A3) Level 1<br />
Kenya-Somalia Variable, north (E) Level 1<br />
Bleaching risk has not intensified since late January, apart from off southern Madagascar, where high <strong>bleaching</strong> may occur. As a result, the<br />
<strong>alert</strong> level is kept at moderate (Level 1) through most of the <strong>WIO</strong>.<br />
Global & Regional Indicators<br />
No change since February - both the El Niño and Indian<br />
Ocean Dipole indices are negative and projected to be<br />
neutral to April/May, before becoming positive.<br />
NOAA Products – 28 February 20<strong>17</strong><br />
NOAA Virtual stations, 1 March 20<strong>17</strong><br />
SST Anomaly - Temperatures<br />
in most of the <strong>WIO</strong> are warm,<br />
but with significant cool<br />
patches in the southern<br />
Mozambique Channel (a<br />
remnant of cyclone Dineo two<br />
weeks earlier), off the coast of<br />
Tanzania and Kenya, and<br />
north of the Seychelles.<br />
1 week outlook - NOAA’s<br />
outlook looking forward 1<br />
week shows strong heating<br />
beginning to develop around<br />
southern Madagascar<br />
Most locations in the <strong>WIO</strong> have been on <strong>bleaching</strong> watch since the<br />
beginning of January, but only 2 are at the highest <strong>alert</strong><br />
(Madagascar), and most being on a warning level.<br />
Cyclones<br />
14-15 Feb. Cyclone Dineo formed over the southern Mozambique<br />
channel and crossed the Mozambique coast at Inhambane<br />
(Bazaruto region).<br />
3 month <strong>bleaching</strong> outlook<br />
(Mar-Jun) - remains significant<br />
over the period March-June,<br />
but most of the coral reef<br />
locations in the <strong>WIO</strong> are not<br />
predicted to experience strong<br />
<strong>bleaching</strong> (darker colours) this<br />
year.<br />
Submit <strong>bleaching</strong> observations:<br />
https://goo.gl/forms/s1YO8x4HbNG55WmJ3<br />
Bleaching observations, 20<strong>17</strong><br />
Moderate <strong>bleaching</strong> has<br />
been observed in SW<br />
Madagascar, with low and<br />
no <strong>bleaching</strong> elsewhere in<br />
the <strong>WIO</strong>.<br />
Go to<br />
http://www.cordioea.net/<br />
<strong>bleaching</strong><strong>alert</strong>/for the<br />
interactive map.
WESTERN INDIAN OCEAN – Regional coral <strong>bleaching</strong> <strong>alert</strong><br />
Explanations<br />
<strong>WIO</strong> climatology regions<br />
DATE OF THIS ALERT: 1 March 20<strong>17</strong><br />
Since 2<strong>01</strong>4, <strong>bleaching</strong><br />
reporting regions are used<br />
as defined by SST analysis<br />
from the last decade (20<strong>03</strong>-<br />
2009 as ‘background’ years,<br />
and 2<strong>01</strong>0 as a year of high<br />
<strong>bleaching</strong>), rather than a<br />
longer historical record that<br />
includes pre-1998 SSTs.<br />
Five SST zones were<br />
identified:<br />
A – the hottest region; the East Madagascar Channel<br />
and Comoros (reported as SW Madagascar and<br />
the NE Madagascar Channel) and the NW<br />
Seychelles islands. Split into 3 subregions.<br />
B – the second hottest region; East African mainland<br />
coast from 7-18 o S (Zanzibar/Dar es Salaam to<br />
Primeiras/Segundas islands), and including the<br />
NW Madagascar Channel<br />
C – a moderate/intermediate region; the South<br />
Equatorial Current region, comprising the<br />
Mascarene Banks, southern Seychelles islands<br />
and NE Madagascar<br />
D – the southern cooler regions; SW Indian Ocean<br />
islands, E and S Madagascar and S Mozambique<br />
and South Africa. Split into 2 subregions.<br />
E – the cooler northern but highly variable region; the<br />
Kenya-Somali coast, including Pemba island and<br />
N Tanzania coast (Tanga).<br />
Because of latitudinal variation (e.g. in A) and splitting<br />
geographically (e.g. A and D), we report in 8 subregions.<br />
Alert levels<br />
Statistical analysis of <strong>alert</strong>s from 2007-13 indicated<br />
that low confidence is attached to an <strong>alert</strong> of ‘low’<br />
<strong>bleaching</strong> risk (ie. not zero risk, but not severe). By<br />
contrast, predictions of ‘mid’ and ‘high’ risk of<br />
<strong>bleaching</strong> were more reliable. Accordingly, the <strong>alert</strong> is<br />
being presented as:<br />
‘warning’ – indications of warmer conditions that<br />
may result in some <strong>bleaching</strong><br />
‘level 1’ – moderate <strong>bleaching</strong> possible<br />
<br />
‘level 2’ – severe <strong>bleaching</strong> likely<br />
These findings match the categories used by NOAA,<br />
with ‘watch’, ‘<strong>bleaching</strong> level 1’ and bleachaing level<br />
2’ categories.<br />
Sea Surface Temperatures (SST)<br />
The surface of the sea heats up by direct insolation,<br />
causing stress to corals and other shallow water<br />
organisms. Satellites directly measure the skintemperature<br />
of the sea, providing these maps and<br />
coral <strong>bleaching</strong> products for early warning.<br />
Predicted Bleaching<br />
The Bleaching Thermal Stress Outlook is based on<br />
sea surface temperature (SST) forecasts generated<br />
by the Linear Inverse Model from the NOAA Earth<br />
System Research Laboratory. In a normal year, the<br />
Outlook forecasts no potential for <strong>bleaching</strong>. The<br />
baseline years for calculations (ie. the climatology)<br />
are 1985-93, excluding 1991<br />
and 1992 due to high atmosphere<br />
volcanic dust from Mt. Pinatubo.<br />
Wind-driven mixing<br />
Wind is an important physical factor influencing<br />
conditions conducive to coral <strong>bleaching</strong>. Wind-driven<br />
mixing reduces temperature stress and wind<br />
generated waves can scatter harmful levels of<br />
incoming solar radiation.<br />
<br />
<br />
Cyclones - cause strong mixing, reducing SST.<br />
Doldrums - periods of sustained low wind<br />
promote stratification, and heating of the upper<br />
layers of water. They therefore promote<br />
environmental conditions adverse to corals<br />
experiencing thermal and/or light stress.<br />
El Niño/Southern Oscillation (ENSO)<br />
The El Niño/Southern Oscillation (ENSO) is the most<br />
important coupled ocean-atmosphere phenomenon to<br />
cause global climate variability on interannual time<br />
scales.<br />
Multivariate ENSO Index (MEI) - Negative values of<br />
the MEI represent the cold ENSO phase (La<br />
Niña), while positive MEI values represent the<br />
warm ENSO phase (El Niño).<br />
The Southern Oscillation Index (SOI) is calculated<br />
from the monthly or seasonal fluctuations in the<br />
air pressure difference between Tahiti and Darwin<br />
(Note, negative SOI is equivalent to positive MEI).<br />
The Nino 3.4 index is similar to the SOI, but focused<br />
on the central Pacific Niño region, straddling the<br />
equator and from <strong>17</strong>0-120 o W. It has been found<br />
to be most strongly associated with climatic<br />
consequences in the African region, so is used<br />
here.<br />
Indian Ocean Dipole<br />
The Indian Ocean Dipole is analogous to the ENSO,<br />
but for the Indian Ocean. It is calculated using the<br />
Dipole Mode Index (DMI), which calculates the<br />
gradient between the western equatorial Indian<br />
Ocean (50E-70E and 10S-10N) and the southeastern<br />
equatorial Indian Ocean (90E-110E and 10S-0N).<br />
Global indicators<br />
Local temperatures are affected by global and<br />
regional trends. With global warming, temperatures<br />
are expected to rise over longer periods (decades),<br />
but significant variation can occur between years, and<br />
under the influence of regional factors such as oceanatmosphere<br />
interactions across the Pacific and Indian<br />
Ocean.<br />
Data sources<br />
http://www.metoffice.gov.uk/news/releases/archive/2<strong>01</strong>4/2<strong>01</strong>5-<br />
global-temp-forecast<br />
http://coralreefwatch.noaa.gov/<br />
http://australiasevereweather.com/cyclones/index.html<br />
http://www.mtotec.com/<br />
http://www.cpc.ncep.noaa.gov/<br />
http://www.ioc-goosoopc.org/state_of_the_ocean/sur/ind/dmi.php


