Saudi Petrochemicals sector
2lWYG0v
2lWYG0v

You also want an ePaper? Increase the reach of your titles
YUMPU automatically turns print PDFs into web optimized ePapers that Google loves.
<strong>Saudi</strong> <strong>Petrochemicals</strong><br />
Sector<br />
<strong>Petrochemicals</strong> –Industrial<br />
02 March 2017<br />
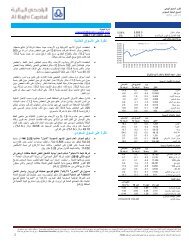
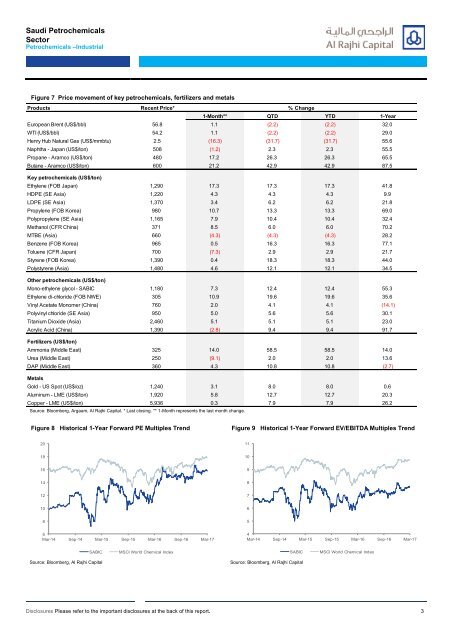
Figure 7 Price movement of key petrochemicals, fertilizers and metals<br />
Products Recent Price*<br />
% Change<br />
1-Month** QTD YTD 1-Year<br />
European Brent (US$/bbl) 56.8 1.1 (2.2) (2.2) 32.0<br />
WTI (US$/bbl) 54.2 1.1 (2.2) (2.2) 29.0<br />
Henry Hub Natural Gas (US$/mmbtu) 2.5 (16.3) (31.7) (31.7) 55.6<br />
Naphtha - Japan (US$/ton) 508 (1.2) 2.3 2.3 55.5<br />
Propane - Aramco (US$/ton) 480 17.2 26.3 26.3 65.5<br />
Butane - Aramco (US$/ton) 600 21.2 42.9 42.9 87.5<br />
Key petrochemicals (US$/ton)<br />
Ethylene (FOB Japan) 1,290 17.3 17.3 17.3 41.8<br />
HDPE (SE Asia) 1,220 4.3 4.3 4.3 9.9<br />
LDPE (SE Asia) 1,370 3.4 6.2 6.2 21.8<br />
Propylene (FOB Korea) 980 10.7 13.3 13.3 69.0<br />
Polypropylene (SE Asia) 1,165 7.9 10.4 10.4 32.4<br />
Methanol (CFR China) 371 8.5 6.0 6.0 70.2<br />
MTBE (Asia) 660 (4.3) (4.3) (4.3) 28.2<br />
Benzene (FOB Korea) 965 0.5 16.3 16.3 77.1<br />
Toluene (CFR Japan) 700 (7.3) 2.9 2.9 21.7<br />
Styrene (FOB Korea) 1,390 0.4 18.3 18.3 44.0<br />
Polystyrene (Asia) 1,480 4.6 12.1 12.1 34.5<br />
Other petrochemicals (US$/ton)<br />
Mono-ethylene glycol - SABIC 1,180 7.3 12.4 12.4 55.3<br />
Ethylene di-chloride (FOB NWE) 305 10.9 19.6 19.6 35.6<br />
Vinyl Acetate Monomer (China) 760 2.0 4.1 4.1 (14.1)<br />
Polyvinyl chloride (SE Asia) 950 5.0 5.6 5.6 30.1<br />
Titanium Dioxide (Asia) 2,460 5.1 5.1 5.1 23.0<br />
Acrylic Acid (China) 1,390 (2.8) 9.4 9.4 91.7<br />
Fertilizers (US$/ton)<br />
Ammonia (Middle East) 325 14.0 58.5 58.5 14.0<br />
Urea (Middle East) 250 (9.1) 2.0 2.0 13.6<br />
DAP (Middle East) 360 4.3 10.8 10.8 (2.7)<br />
Metals<br />
Gold - US Spot (US$/oz) 1,240 3.1 8.0 8.0 0.6<br />
Aluminum - LME (US$/ton) 1,920 5.8 12.7 12.7 20.3<br />
Copper - LME (US$/ton) 5,936 0.3 7.9 7.9 26.2<br />
Source: Bloomberg, Argaam, Al Rajhi Capital. * Last closing. ** 1-Month represents the last month change.<br />
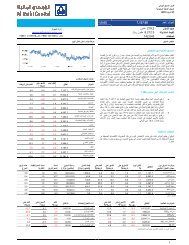
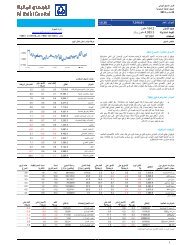
Figure 8 Historical 1-Year Forward PE Multiples Trend<br />
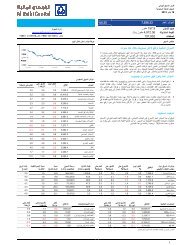
Figure 9 Historical 1-Year Forward EV/EBITDA Multiples Trend<br />
20<br />
11<br />
18<br />
10<br />
16<br />
9<br />
14<br />
8<br />
12<br />
7<br />
10<br />
6<br />
8<br />
5<br />
6<br />
Mar-14 Sep-14 Mar-15 Sep-15 Mar-16 Sep-16 Mar-17<br />
4<br />
Mar-14 Sep-14 Mar-15 Sep-15 Mar-16 Sep-16 Mar-17<br />
SABIC<br />
MSCI World Chemical Index<br />
SABIC<br />
MSCI World Chemical Index<br />
Source: Bloomberg, Al Rajhi Capital<br />
Source: Bloomberg, Al Rajhi Capital<br />
Disclosures Please refer to the important disclosures at the back of this report. 3