

Brown & Brown Insurance 2016 Annual Report
2016 Annual Report
2016 Annual Report

You also want an ePaper? Increase the reach of your titles
YUMPU automatically turns print PDFs into web optimized ePapers that Google loves.
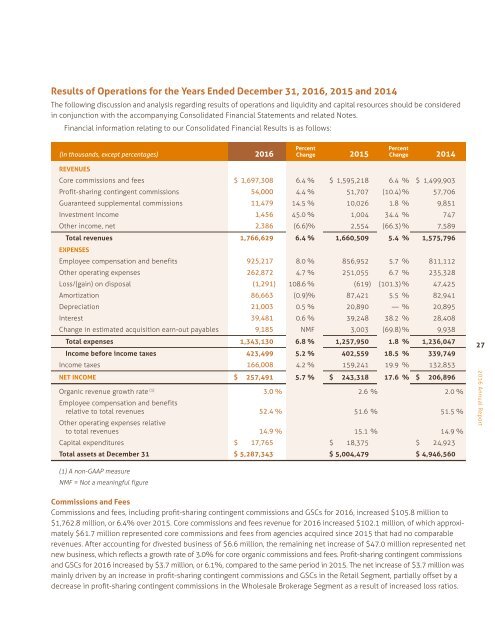
Results of Operations for the Years Ended December 31, <strong>2016</strong>, 2015 and 2014<br />
The following discussion and analysis regarding results of operations and liquidity and capital resources should be considered<br />
in conjunction with the accompanying Consolidated Financial Statements and related Notes.<br />
Financial information relating to our Consolidated Financial Results is as follows:<br />
Percent<br />
Percent<br />
(in thousands, except percentages) <strong>2016</strong> Change 2015 Change 2014<br />
REVENUES<br />
Core commissions and fees $ 1,697,308 6.4 % $ 1,595,218 6.4 % $ 1,499,903<br />
Profit-sharing contingent commissions 54,000 4.4 % 51,707 (10.4) % 57,706<br />
Guaranteed supplemental commissions 11,479 14.5 % 10,026 1.8 % 9,851<br />
Investment income 1,456 45.0 % 1,004 34.4 % 747<br />
Other income, net 2,386 (6.6)% 2,554 (66.3) % 7,589<br />
Total revenues 1,766,629 6.4 % 1,660,509 5.4 % 1,575,796<br />
EXPENSES<br />
Employee compensation and benefits 925,217 8.0 % 856,952 5.7 % 811,112<br />
Other operating expenses 262,872 4.7 % 251,055 6.7 % 235,328<br />
Loss/(gain) on disposal (1,291) 108.6 % (619) (101.3) % 47,425<br />
Amortization 86,663 (0.9) % 87,421 5.5 % 82,941<br />
Depreciation 21,003 0.5 % 20,890 — % 20,895<br />
Interest 39,481 0.6 % 39,248 38.2 % 28,408<br />
Change in estimated acquisition earn-out payables 9,185 NMF 3,003 (69.8) % 9,938<br />
Total expenses 1,343,130 6.8 % 1,257,950 1.8 % 1,236,047<br />
Income before income taxes 423,499 5.2 % 402,559 18.5 % 339,749<br />
Income taxes 166,008 4.2 % 159,241 19.9 % 132,853<br />
NET INCOME $ 257,491 5.7 % $ 243,318 17.6 % $ 206,896<br />
Organic revenue growth rate (1) 3.0 % 2.6 % 2.0 %<br />
Employee compensation and benefits<br />
relative to total revenues 52.4 % 51.6 % 51.5 %<br />
Other operating expenses relative<br />
to total revenues 14.9 % 15.1 % 14.9 %<br />
Capital expenditures $ 17,765 $ 18,375 $ 24,923<br />
Total assets at December 31 $ 5,287,343 $ 5,004,479 $ 4,946,560<br />
27<br />
<strong>2016</strong> <strong>Annual</strong> <strong>Report</strong><br />
(1) A non-GAAP measure<br />
NMF = Not a meaningful figure<br />
Commissions and Fees<br />
Commissions and fees, including profit-sharing contingent commissions and GSCs for <strong>2016</strong>, increased $105.8 million to<br />
$1,762.8 million, or 6.4% over 2015. Core commissions and fees revenue for <strong>2016</strong> increased $102.1 million, of which approximately<br />
$61.7 million represented core commissions and fees from agencies acquired since 2015 that had no comparable<br />
revenues. After accounting for divested business of $6.6 million, the remaining net increase of $47.0 million represented net<br />
new business, which reflects a growth rate of 3.0% for core organic commissions and fees. Profit-sharing contingent commissions<br />
and GSCs for <strong>2016</strong> increased by $3.7 million, or 6.1%, compared to the same period in 2015. The net increase of $3.7 million was<br />
mainly driven by an increase in profit-sharing contingent commissions and GSCs in the Retail Segment, partially offset by a<br />
decrease in profit-sharing contingent commissions in the Wholesale Brokerage Segment as a result of increased loss ratios.