Creative Data Mining : Documentation of the teaching results from the Spring Semester 2017
Creative Data Mining : Documentation of the teaching results from the Spring Semester 2017
Creative Data Mining : Documentation of the teaching results from the Spring Semester 2017

You also want an ePaper? Increase the reach of your titles
YUMPU automatically turns print PDFs into web optimized ePapers that Google loves.
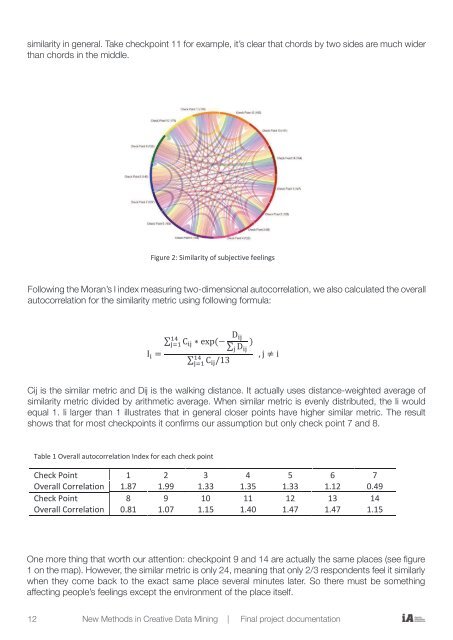
similarity in general. Take checkpoint 11 for example, it’s clear that chords by two sides are much wider<br />
than starting chords and in ending <strong>the</strong> middle. points which is <strong>the</strong> fur<strong>the</strong>st pair although <strong>the</strong>y were placed close to each<br />
o<strong>the</strong>r. Similarly, 1 and 13, 2 and 14 are also very far away. Then it shows a tendency that<br />
checkpoints closer to each o<strong>the</strong>r give out a higher similarity in general. Take checkpoint 11 for<br />
starting and ending points which is <strong>the</strong> fur<strong>the</strong>st pair although <strong>the</strong>y were placed close to each<br />
example, it’s clear that chords by two sides are much wider than chords in <strong>the</strong> middle.<br />
starting o<strong>the</strong>r. Similarly, and ending 1 and points 13, which 2 and is 14 <strong>the</strong> are fur<strong>the</strong>st also very pair far although away. Then <strong>the</strong>y were it shows placed a tendency close to each that<br />
o<strong>the</strong>r. checkpoints Similarly, closer 1 to and each 13, o<strong>the</strong>r 2 and give 14 out are a also higher very similarity far away. in Then general. it shows Take checkpoint a tendency 11 that for<br />
checkpoints example, it’s closer clear that to each chords o<strong>the</strong>r by two give sides out a are higher much similarity wider than in general. chords in Take <strong>the</strong> middle. checkpoint 11 for<br />
example, it’s clear that chords by two sides are much wider than chords in <strong>the</strong> middle.<br />
Figure 2: Similarity <strong>of</strong> subjective feelings<br />
Following <strong>the</strong> Moran’s I index measuring two-dimensional autocorrelation, we also calculated<br />
Following <strong>the</strong> overall <strong>the</strong> autocorrelation Moran’s I index for measuring <strong>the</strong> Figure similarity 2: Similarity two-dimensional metric <strong>of</strong> subjective using following autocorrelation, feelings formula: we also calculated <strong>the</strong> overall<br />
autocorrelation for <strong>the</strong> similarity Figure metric 2: using Similarity following <strong>of</strong> subjective feelings<br />
Following <strong>the</strong> Moran’s I index measuring 14 two-dimensional D formula:<br />
∑<br />
ij autocorrelation, we also calculated<br />
j=1 C ij ∗ exp(− )<br />
Following <strong>the</strong> overall <strong>the</strong> autocorrelation Moran’s I index for <strong>the</strong> measuring similarity two-dimensional metric using ∑ j D ij following autocorrelation, formula: we also calculated<br />
I<br />
<strong>the</strong> overall autocorrelation for <strong>the</strong> i =<br />
similarity ∑14<br />
, j ≠ i<br />
j=1<br />
metric C ij /13using following formula:<br />
14<br />
D<br />
∑<br />
ij<br />
j=1 C ij ∗ exp(−<br />
14<br />
D<br />
)<br />
∑ D<br />
Cij is <strong>the</strong> similar metric and Dij is <strong>the</strong> ∑walking ij<br />
j=1 C ij ∗<br />
distance.<br />
exp(− j It actually ij<br />
)<br />
uses distance-weighted average<br />
I i =<br />
∑14<br />
∑ j D<br />
, j ≠ i<br />
<strong>of</strong> similarity metric divided by ij<br />
I<br />
arithmetic<br />
i =<br />
average. j=1 C ij /13 When similar<br />
∑14<br />
, j ≠<br />
metric<br />
i<br />
is evenly distributed, <strong>the</strong><br />
Ii would equal 1. Ii larger than 1 illustrates j=1that C ij /13 in general closer points have higher similar<br />
Cij is <strong>the</strong> similar metric and Dij is <strong>the</strong> walking distance. It actually uses distance-weighted average<br />
metric. The result shows that for most checkpoints it confirms our assumption but only check<br />
Cij Cij <strong>of</strong> is is similarity <strong>the</strong> similar metric metric divided and by Dij is arithmetic is <strong>the</strong> <strong>the</strong> walking average. distance. When It actually similar It actually uses metric uses evenly distance-weighted distributed, average <strong>the</strong> average <strong>of</strong><br />
point 7 and 8.<br />
similarity <strong>of</strong> Ii would similarity metric equal metric divided 1. Ii divided larger by arithmetic than by arithmetic 1 illustrates average. that When When in general similar closer metric points is is evenly have distributed, higher similar<br />
<strong>the</strong> Ii would<br />
equal<br />
Ii metric. Table would 1. 1 Overall Ii The equal larger result autocorrelation 1. than<br />
Ii shows larger 1 illustrates that Index than for 1 each most that illustrates in checkpoints general that closer it general confirms points closer our have assumption points higher have similar but higher only metric. similar check The result<br />
shows metric. point<br />
that<br />
7 and The for<br />
8. result most shows checkpoints that for it most confirms checkpoints our assumption it confirms but our only assumption check point but 7 only and check 8.<br />
Check Point 1 2 3 4 5 6 7<br />
point 7 and 8.<br />
Table Overall 1 Overall Correlation autocorrelation 1.87 Index for 1.99 each check point 1.33 1.35 1.33 1.12 0.49<br />
Table Check 1 Overall Point autocorrelation 8 Index for each 9 check point 10 11 12 13 14<br />
Check Overall Point Correlation 0.81 1 1.07 2 1.15 3 1.40 4 1.47 5 1.47 6 1.15 7<br />
Check Overall Point Correlation 1.87 1 1.99 2 1.333 1.35 4 1.33 5 1.12 6 0.49 7<br />
Overall Check Point Correlation 1.878 1.999 1.33 10 1.35 11 1.33 12 1.12 13 0.49 14<br />
Check Overall One more Point Correlation thing that worth 0.818 our attention: 1.07 9 checkpoint 1.15 10 9 1.40 and 11 14 are 1.47 actually 12 <strong>the</strong> 1.47 13 same places 1.15 14 (see<br />
Overall figure 1 Correlation on <strong>the</strong> map). However, 0.81 <strong>the</strong> 1.07 similar metric 1.15 is only 1.40 24, meaning 1.47 that only 1.47 2/3 respondents 1.15<br />
feel it similarly when <strong>the</strong>y come back to <strong>the</strong> exact same place several minutes later. So <strong>the</strong>re<br />
One more thing that worth our attention: checkpoint 9 and 14 are actually <strong>the</strong> same places (see<br />
must be something affecting people’s feelings except <strong>the</strong> environment <strong>of</strong> <strong>the</strong> place itself.<br />
One figure more 1 on thing <strong>the</strong> map). that worth However, our attention: <strong>the</strong> similar checkpoint metric is only 9 and 24, 14 meaning are actually that only <strong>the</strong> same 2/3 respondents places (see<br />
figure feel it 1 similarly on <strong>the</strong> map). when However, <strong>the</strong>y come <strong>the</strong> back similar to <strong>the</strong> metric exact is only same 24, place meaning several that minutes only 2/3 later. respondents So <strong>the</strong>re<br />
One<br />
feel<br />
more<br />
must <strong>Creative</strong> it be similarly<br />
thing that<br />
<strong>Data</strong> something <strong>Mining</strong> when<br />
worth<br />
affecting | <strong>Spring</strong> <strong>the</strong>y<br />
our<br />
come<br />
attention:<br />
<strong>2017</strong> people’s | back Final feelings Projects to<br />
checkpoint<br />
<strong>the</strong> exact except same<br />
9 and<br />
<strong>the</strong> environment place<br />
14 are<br />
several<br />
actually<br />
<strong>of</strong> minutes<br />
<strong>the</strong> same<br />
<strong>the</strong> place later.<br />
places<br />
itself. So <strong>the</strong>re<br />
(see figure<br />
1 on <strong>the</strong> map). However, <strong>the</strong> similar metric is only 24, meaning that only 2/3 respondents feel it similarly<br />
must be something affecting people’s feelings except <strong>the</strong> environment <strong>of</strong> <strong>the</strong> place itself.<br />
when <strong>the</strong>y come back to <strong>the</strong> exact same place several minutes later. So <strong>the</strong>re must be something<br />
affecting <strong>Creative</strong> people’s <strong>Data</strong> <strong>Mining</strong> feelings | <strong>Spring</strong> except <strong>2017</strong> | <strong>the</strong> Final environment Projects <strong>of</strong> <strong>the</strong> place itself.<br />
<strong>Creative</strong> <strong>Data</strong> <strong>Mining</strong> | <strong>Spring</strong> <strong>2017</strong> | Final Projects<br />
12<br />
New Methods in <strong>Creative</strong> <strong>Data</strong> <strong>Mining</strong> | Final project documentation