Trading report August 2017
Report on trading at BSP Southpool Energy Exchange for August 2017
Report on trading at BSP Southpool Energy Exchange for August 2017
- No tags were found...

You also want an ePaper? Increase the reach of your titles
YUMPU automatically turns print PDFs into web optimized ePapers that Google loves.
Monthly Report - <strong>August</strong> <strong>2017</strong><br />
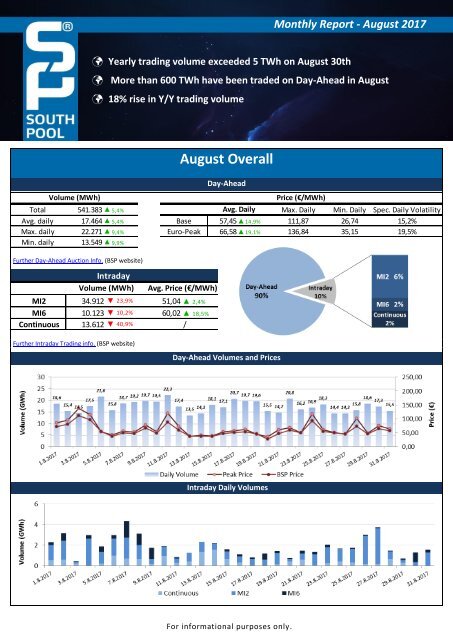
Yearly trading volume exceeded 5 TWh on <strong>August</strong> 30th<br />
More than 600 TWh have been traded on Day-Ahead in <strong>August</strong><br />
18% rise in Y/Y trading volume<br />
Volume (MWh)<br />
Further Day-Ahead Auction Info. (BSP website)<br />
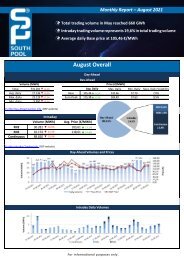
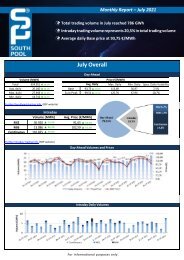
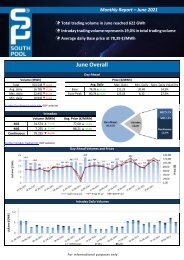
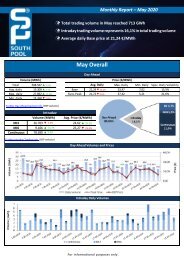
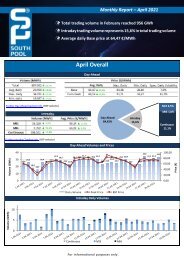
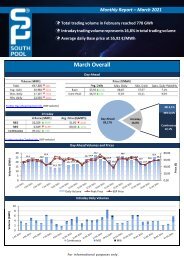
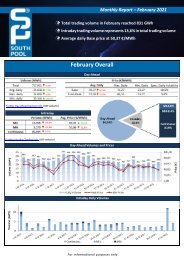
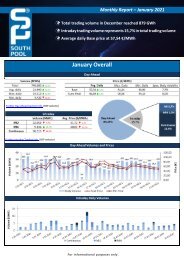
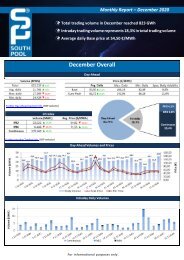
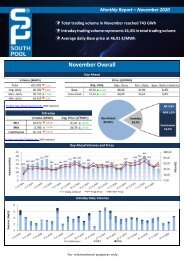
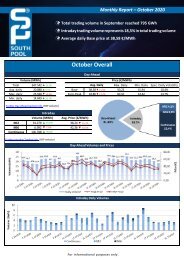
<strong>August</strong> Overall<br />
Day-Ahead<br />
Total 541.383 ▲ 5,4% Avg. Daily Max. Daily Min. Daily Spec. Daily Volatility<br />
Avg. daily 17.464 ▲ 5,4% Base 57,45▲14,9% 111,87 26,74 15,2%<br />
Max. daily 22.271 ▲ 9,4% Euro-Peak 66,58▲19,1% 136,84 35,15 19,5%<br />
Min. daily 13.549 ▲ 9,9%<br />
Intraday<br />
Volume (MWh)<br />
Avg. Price (€/MWh)<br />
MI2 34.912 ▼ 23,9% 51,04 ▲ 2,4%<br />
MI6 10.123 ▼ 10,2% 60,02 ▲ 18,5%<br />
Continuous 13.612 ▼ 40,9% /<br />
Price (€/MWh)<br />
Further Intraday <strong>Trading</strong> info. (BSP website)<br />
Day-Ahead Volumes and Prices<br />
Intraday Daily Volumes<br />
For informational purposes only.
Day-Ahead further Auction info.<br />
Average Hourly Prices<br />
Hour (AM) 1 2 3 4 5 6 7 8 9 10 11 12<br />
Volume (MWh) 748 725 712 716 701 664 637 696 706 722 741 746<br />
Base price (€/MWh) 44,28 39,53 36,07 34,56 36,03 37,18 43,50 55,56 61,80 63,77 62,78 66,23<br />
Hour (PM) 13 14 15 16 17 18 19 20 21 22 23 24<br />
Volume (MWh) 765 737 726 728 728 742 758 743 806 753 743 719<br />
Daily volatility of base price<br />
Base price (€/MWh) 66,75 66,02 69,38 68,76 66,97 66,97 68,42 71,16 78,78 67,92 56,24 50,19<br />
SI→IT<br />
IT→SI<br />
SI→AT<br />
Cross-Zonal Capacities<br />
AT→SI<br />
Total<br />
Offered (MWh) 341.791 469.480 978.133 143.877 1.933.281<br />
Allocated (MWh) 133.777 155.286 1.375 131.259 421.697<br />
% Allocated 39,14% 33,08% 0,14% 91,23% /<br />
Daily Volatility of Base Price<br />
Methodology used for calculation of volatility.<br />
MI2 & MI6 Implicit Auctions<br />
Allocated CZC Values on Slovenian-Italian Border<br />
Cross-Zonal-Capacities<br />
SI-IT IT-SI Total<br />
Offered (MWh) 356.026 265.386 621.412<br />
Allocated (MWh) 7.556 21.980 29.536<br />
% Allocated 2,12% 8,28% /<br />
Read more about European Pilot Project<br />
Implicit Intraday Auctions (MI2 & MI6)<br />
Intraday Continuous <strong>Trading</strong><br />
Volumes by Products<br />
For informational purposes only.
Past 12 Months Trade Information<br />
Day-Ahead Auction<br />
Avg. Monthly Volume (MWh) 585.328<br />
Avg. Daily Volume (MWh) 19.244<br />
Avg. Base Price (€/MWh) 45,57<br />
Avg. Euro-Peak Price (€/MWh) 51,07<br />
Avg. SI-IT offered (MWh)/Avg. % Allocated 397.482 / 61,7%<br />
Avg. IT-SI offered (MWh)/Avg.% Allocated 474.373 / 13,0%<br />
Avg. SI-AT offered (MWh)/Avg. % Allocated 973.278 / 2,6%<br />
Avg. AT-SI offered (MWh)/Avg. % Allocated 209.176 / 67,0%<br />
Intraday Continuous <strong>Trading</strong><br />
Avg. Monthly volume (MWh) 21.366<br />
Avg. Nbr. Of Transactions 419<br />
MI2 & MI6 Implicit Auctions<br />
Avg. Monthly volume MI2 (MWh) 30.529<br />
Avg. Monthly volume MI6 (MWh) 8.938<br />
Avg. SI-IT offered (MWh)/Avg. % Allocated 212.720 / 6,9%<br />
Avg. IT-SI offered (MWh)/Avg.% Allocated 347.305 / 3,0%<br />
*Day-ahead coupling on SI-AT border was launched on 22 nd July 2016. Therefore for average calculation, data from <strong>August</strong> is being used.<br />
**Intraday coupling on SI-IT border was launched on 21 st June 2016. Therefore for average calculation, data from July is being used.<br />
Day-Ahead Market Volumes and Prices<br />
Intraday Volumes (MWh)<br />
Total Volume in past 12 months Continuous ■ MI2 ■ MI6 ■<br />
Avg 31.659 29.657 8.309<br />
366.353<br />
Sep 9.212 27.861 10.493<br />
Okt 17.377 34.984 9.566<br />
256.260<br />
Nov 16.342 8.964 1.444<br />
Dec 12.541 23.301 9.464<br />
Jan 40.356 37.490 13.914<br />
107.261 Feb 19.024 34.970 11.829<br />
Mar 26.133 17.516 5.505<br />
Apr 27.822 29.853 9.325<br />
Maj 19.354 41.953 5.891<br />
Jun 13.404 33.927 10.241<br />
Jul 23.037 45.876 11.279<br />
*MI Auctions were launched on 22 nd June 2016.<br />
Absolute Difference Between MI and Day-Ahead Prices & MI Offered Cross-Zonal Capacities<br />
*Cross-Zonal Capacities not allocated on Day-Ahead Auction are later offered for MI2 and MI6 Auctions.<br />
For informational purposes only.
BSP Energy Exchange LL C<br />
Dunajska 156<br />
SI-1000 Ljubljana<br />
Slovenija<br />
+386 1 620 76 76<br />
+386 1 620 76 77<br />
www.bsp-southpool.com<br />
info@bsp-southpool.com<br />
For informational purposes only.