Clarksville- Main File

You also want an ePaper? Increase the reach of your titles
YUMPU automatically turns print PDFs into web optimized ePapers that Google loves.
COMPREHENSIVE<br />
LABOR ANALYSIS<br />
<strong>Clarksville</strong>-Montgomery County<br />
Economic Development Council<br />
NOVEMBER 2017
CONTENTS<br />
4 ACKNOWLEDGMENTS<br />
5 INTRODUCTION<br />
7 DEMOGRAPHIC PROFILE<br />
8 Population Trends<br />
10 Generation Dynamics<br />
11 Diversity<br />
13 Income<br />
15 Poverty<br />
16 Educational Attainment<br />
17 Stakeholder Themes<br />
18 LABOR FORCE<br />
22 Underemployment<br />
23 Commuting Patterns<br />
28 Stakeholder Themes<br />
30 THE ECONOMY AND JOB PERFORMANCE<br />
30 Industry<br />
34 Regional Business Dynamics<br />
36 Workers<br />
39 Real-Time Data<br />
41 Compensation<br />
43 Stakeholder Themes<br />
44 MILITARY<br />
45 Military Skills in the Civilian Labor Force<br />
52 Stakeholder Themes<br />
54 EDUCATION & TRAINING DEMAND<br />
57 Meeting the Needs of Industry<br />
60 Stakeholder Themes<br />
2<br />
COMPREHENSIVE LABOR ANALYSIS: CLARKSVILLE-MONTGOMERY COUNTY
61 INDUSTRY CLUSTER AND SUPPLY CHAIN ANALYSIS<br />
61 The Region<br />
63 Industry Clusters<br />
65 Supply Chain Analysis<br />
68 Stakeholder Themes<br />
69 PEER REGION ANALYSIS<br />
70 Duo Peer Regions<br />
72 Individual Peer Regions<br />
74 Corporate Investment<br />
75 RECOMMENDATIONS<br />
75 Increase communication and collaboration<br />
76 Attract or grow more creative and technology-based jobs and investment<br />
77 Develop targeted and highly visible strategies to retain exiting military<br />
personnel<br />
78 Create an implementation plan<br />
80 CONCLUSION<br />
82 APPENDIX I: CORPORATE SUPPORT<br />
83 APPENDIX II: INVESTMENT IN CLARKSVILLE-MONTGOMERY<br />
COUNTY<br />
84 APPENDIX III: CLARKSVILLE-MONTGOMERY COUNTY EDC<br />
BUSINESS SURVEY<br />
92 APPENDIX IV: MOC TO SOC CROSSWALK<br />
112 APPENDIX V: DATA SOURCES AND CALCULATIONS<br />
CONTENTS<br />
3
ACKNOWLEDGMENTS<br />
Emsi would like to thank the <strong>Clarksville</strong>-Montgomery County Economic<br />
Development Council, Aspire <strong>Clarksville</strong> Foundation, and the Industrial<br />
Development Board for the opportunity to prepare this report.<br />
The authors would like to thank the many people – representing the organizations listed below,<br />
who provided meeting facilities and hosted focus groups, assisted with scheduling, and offered<br />
valuable data, inputs, and feedback. These organizations’ representatives took the time to meet<br />
with Emsi researchers and provide insight into the <strong>Clarksville</strong>-Montgomery County economy and<br />
region. In addition to these organizations, many <strong>Clarksville</strong> companies participated in surveys,<br />
focus groups, and interviews. A list of these companies can be found in Appendix I.<br />
• Austin Peay State University<br />
• City of <strong>Clarksville</strong><br />
• <strong>Clarksville</strong> Area Chamber of Commerce<br />
• <strong>Clarksville</strong>-Montgomery County School<br />
System<br />
• Fort Campbell Employment Readiness<br />
Program Army Community Service<br />
• Fort Campbell Soldier For Life-Transition<br />
Assistance Program<br />
• Hopkinsville Community College<br />
• Hopkinsville County Government<br />
• Kentucky Regional Workforce<br />
• Montgomery County Government<br />
• Nashville State Community College<br />
• Pennyrile Area Development District<br />
• Robertson County Chamber of<br />
Commerce<br />
• Southwest Kentucky Economic<br />
Development Council<br />
• Tennessee College of Applied<br />
Technology<br />
• Workforce Essentials, Inc.<br />
This study is the result of a group effort. The authors would like to thank our colleagues at Emsi for their assistance<br />
with this study—in particular, Daniel Botkin, Brandon Crouch, and Bethany Hoyt.<br />
Jennifer Hackman, Account Executive<br />
Debbie Maranger Menk, Director of Consulting<br />
Alivia Metts, Senior Economist<br />
James Howard, Research Analyst<br />
4<br />
COMPREHENSIVE LABOR ANALYSIS: CLARKSVILLE-MONTGOMERY COUNTY
INTRODUCTION<br />
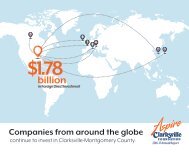
Over the past five years, major manufacturing companies have invested<br />
$2 billion in <strong>Clarksville</strong>, creating 3,500 jobs. For a city the size of <strong>Clarksville</strong>,<br />
this is an astounding level of investment that has changed the trajectory<br />
of <strong>Clarksville</strong>’s growth and development. The purpose of this study is to<br />
provide information for the <strong>Clarksville</strong>-Montgomery County Economic<br />
Development Council to use in guiding the direction of this growth and<br />
development.<br />
During the course of this study,<br />
many <strong>Clarksville</strong> leaders from<br />
Fort Campbell, education, and<br />
industry participated in surveys,<br />
focus groups, and interviews. The<br />
results are included at the end of<br />
each section to better understand<br />
the strengths, weaknesses, and<br />
opportunities open to the region.<br />
Through the Chamber of Commerce,<br />
the Industrial Development Board,<br />
the <strong>Clarksville</strong>-Montgomery County<br />
Economic Development Council, and<br />
Workforce Essentials, <strong>Clarksville</strong> has<br />
dynamic and interactive participants<br />
representing all facets of the economy. This group of leaders and level of participation are among<br />
<strong>Clarksville</strong>’s greatest assets.<br />
<strong>Clarksville</strong> has many options for continued development. It has a strong manufacturing base,<br />
substantial downtown and riverfront areas, and a highly regarded educational system, from grade<br />
school through to universities and technical training.<br />
An informal survey of <strong>Clarksville</strong> leaders was telling in the consistency of responses when asked<br />
about the desired direction for <strong>Clarksville</strong>’s future:<br />
“I see <strong>Clarksville</strong>-Montgomery County becoming a town that owns its<br />
manufacturing roots and beginnings of advanced manufacturing but<br />
to also focus on an effort around attracting professional opportunities<br />
Introduction 5
to town. Research has shown that people tend to move to cities with<br />
plentiful amenities. Research also tells us that college graduates<br />
prefer built urban amenities, while the elderly favor natural amenities<br />
and people engaging in technology patents like both. I believe that<br />
we have the infrastructure to do both. With a growing industrial<br />
presence and manufacturing reputation that will only grow, I see us<br />
at a tipping point, in reference to who we are. Should our riverside<br />
development ever take off, alongside the manufacturing growth,<br />
‘Sky’s the limit!’”<br />
Now is an opportune time for <strong>Clarksville</strong> to build on its manufacturing and educational foundations<br />
to increase the number of office jobs, research and development work, entrepreneurial activity,<br />
and options for graduates to remain in the area. Uniformly, these leaders believe that a target<br />
population for Montgomery County should range from 250,000 to 350,000 so that <strong>Clarksville</strong><br />
can retain its hometown feel while supporting a vibrant, diverse economy.<br />
‘We should create enough infrastructure and business so that people<br />
who don’t want to go to Nashville for shopping/entertainment don’t<br />
have to, but we do not need to replicate Nashville. We can highlight<br />
the uniqueness of <strong>Clarksville</strong> with its beautiful greenways, river,<br />
downtown areas. We can make <strong>Clarksville</strong> a destination for people<br />
in Nashville and other parts of Middle Tennessee who want to spend<br />
a weekend or an afternoon exploring. We do not need to recruit lowwage<br />
manufacturing jobs. As <strong>Clarksville</strong> grows, more people will be<br />
required to support that growth (restaurants, service industries, for<br />
instance). They’ll have opportunities to work in the bigger economy.’<br />
(paraphrased for clarity)<br />
<strong>Clarksville</strong> is rich in natural resources, corporate investment and activity, defense spending (Fort<br />
Campbell), and educational opportunities. It is strategically located—along the Cumberland River<br />
and both close enough to Nashville for residents to enjoy the rich entertainment offered there,<br />
yet distant enough to retain its identity. With so many choices for future direction, the goal of this<br />
study is to provide <strong>Clarksville</strong> leaders with information to enable highly focused action in building<br />
<strong>Clarksville</strong>’s identity, supporting infrastructure, and future development.<br />
6<br />
COMPREHENSIVE LABOR ANALYSIS: CLARKSVILLE-MONTGOMERY COUNTY
DEMOGRAPHIC PROFILE<br />
The City of <strong>Clarksville</strong> is situated within Montgomery County in middle<br />
Tennessee. Located only 50 miles north of Nashville and easily accessible<br />
from several major interstates, <strong>Clarksville</strong> is strategically located within a<br />
day’s drive of 76% of major U.S. cities. This scenic region is a prime area<br />
for business and commerce with an array of metropolitan amenities and<br />
year-round attractions with its rich history and culture.<br />
KEY HIGHLIGHTS<br />
• Strong population growth in <strong>Clarksville</strong> and Montgomery County<br />
• The share of millennials is above the national average for an area of its size<br />
• <strong>Clarksville</strong> and Montgomery County resemble the country with respect to racial<br />
diversity.<br />
• Average earnings are 23–32% below the national average, depending on regional<br />
geography<br />
• High levels of poverty in <strong>Clarksville</strong> and 10-county region but below the national<br />
average in Montgomery County<br />
• Share of residents holding a bachelor’s degree or higher is below the national<br />
average<br />
Demographic Profile 7
POPULATION TRENDS<br />
<strong>Clarksville</strong> is home to over 150,000 people and comprises nearly 77% of the Montgomery County’s<br />
total population. The city and the county have experienced solid population growth over the past<br />
decade—growing at annual average rates of 2.9% and 2.5%, respectively. The 10-county region<br />
boasts over 500,000 residents; however, it experienced sluggish population growth during the<br />
same period, just over 1% annually. Table 1 and Figure 1 summarize total population trends over<br />
the past decade.<br />
FIGURE 1: Annual Population Growth, 2006-2016<br />
<strong>Clarksville</strong> Montgomery County 10-county region<br />
8.0%<br />
7.0%<br />
6.0%<br />
Year-over-Year % Change<br />
5.0%<br />
4.0%<br />
3.0%<br />
2.0%<br />
1.0%<br />
0.0%<br />
–1.0%<br />
2006<br />
2007<br />
2008<br />
2009<br />
2010<br />
2011<br />
2012<br />
2013<br />
2014<br />
2015<br />
2016<br />
2017<br />
2018<br />
2019<br />
2020<br />
2021<br />
Sources: Emsi Dataset 2017.3 and U.S. Census American Community Survey, 1-Year Estimates<br />
TABLE 1: Total Population Trends, 2006-2016<br />
GEOGRAPHY<br />
POPULATION<br />
COMPOUND ANNUAL<br />
POPULATION GROWTH<br />
2006 2011 2016 2006-2011 2011-2016<br />
<strong>Clarksville</strong> 113,317 136,237 150,280 3.8% 2.0%<br />
Montgomery County 153,052 176,664 195,739 2.9% 2.1%<br />
10-county region 444,189 480,890 503,769 1.6% 0.9%<br />
Sources: Emsi Dataset 2017.3 and U.S. Census American Community Survey, 1-Year Estimates<br />
8<br />
COMPREHENSIVE LABOR ANALYSIS: CLARKSVILLE-MONTGOMERY COUNTY
The map below illustrates total migration flows in and out of Montgomery County in 2015.<br />
Negative numbers (in blue) indicate a net outbound of Montgomery County residents while<br />
positive numbers (in orange) indicate where current Montgomery County residents came from<br />
in 2015. The largest number of individuals have stayed in Tennessee, moving just southeast of<br />
Nashville and to the Memphis area. The second largest share of residents have moved to Texas,<br />
to Galveston and the Austin area.<br />
Most of the people moving into Montgomery County during 2015 were from right over the border<br />
in Christian County, Kentucky. Tulsa, Oklahoma was a far second, followed by people coming from<br />
El Paso, Texas. Similarities that appear to exist between Montgomery County and these cities are<br />
a manufacturing-rich sector around Tulsa (aerospace and tech) and a military base near El Paso.<br />
These trends look slightly different over the past five years but were consistently similar in 2014<br />
and 2015.<br />
Demographic Profile 9
GENERATION DYNAMICS<br />
One issue facing employers is retirement risk, which is the loss of employees, as well as possibly<br />
the loss of valuable experience and company knowledge. In general, companies that have a long,<br />
stable history are now facing retirement of up to a quarter of their employees in the next few<br />
years. One measure of the risk of retirement turnover is understanding the relative percentages<br />
of millennials and baby boomers in the labor force—the two largest generations living in the<br />
United States today.<br />
The number of millennials (ages 19-35 in 2016) flocking to the region, particularly into <strong>Clarksville</strong>,<br />
is astounding. For a city of its size, the number of millennials residing in <strong>Clarksville</strong> is significantly<br />
above the national average—29% of the total population. The median age in <strong>Clarksville</strong> is 29 and<br />
30 in Montgomery County, compared to 38 in Tennessee and the nation. The share of millennials<br />
in the 10-county region is also significant, at 23%. However, sans Montgomery County, that share<br />
drops to 20% of the total population.<br />
The share of baby boomers (ages 52-70) are much lower—15% in <strong>Clarksville</strong> and Montgomery<br />
County and 19% in the 10-county region. Both generations have been on the rise in this region<br />
over the past decade while prime-age wage earners (those 25-54 years) have been on the decline.<br />
The figures and table below show how each region compares to the national average of an area<br />
of its size and summarizes the breakdown of the generational trends around the region.<br />
FIGURE 2: Millennials: A Comparison to the National Average for an Area of its Size<br />
USA<br />
USA<br />
USA<br />
LO<br />
43,500<br />
<strong>Clarksville</strong><br />
HI<br />
LO<br />
55,100<br />
Montgomery<br />
County<br />
HI<br />
LO<br />
118,000<br />
10-county<br />
HI<br />
FIGURE 3: Generation Breakdown as a Share of Total Population, 2016<br />
Millennials Baby Boomers Prime-age wage earners<br />
87+86+82+83 44+43+42+43 29+28+23+21<br />
<strong>Clarksville</strong><br />
Montgomery County<br />
10-county<br />
U.S.<br />
0%<br />
Source: Emsi Dataset 2017.3<br />
10%<br />
29%<br />
28%<br />
23%<br />
21%<br />
20%<br />
30%<br />
15%<br />
15%<br />
19%<br />
22%<br />
40%<br />
50%<br />
60%<br />
70%<br />
43%<br />
43%<br />
40%<br />
40%<br />
80%<br />
90%<br />
100%<br />
10<br />
COMPREHENSIVE LABOR ANALYSIS: CLARKSVILLE-MONTGOMERY COUNTY
TABLE 2: Generation Breakdown, 10-county Region (2006-2016)<br />
10-COUNTY<br />
REGION<br />
POPULATION<br />
COMPOUND ANNUAL<br />
POPULATION GROWTH<br />
/ PERCENTAGE POINT<br />
DIFFERENCE<br />
2006 2011 2016 2006-2011 2011-2016<br />
Millennials 97,257 107,926 117,840 2.1% 1.8%<br />
Baby Boomers 69,806 86,326 96,251 4.3% 2.2%<br />
Prime-age wage earners 188,448 198,620 202,771 1.1% 0.4%<br />
Millennials 22% 22% 23% 0.5% 0.9%<br />
Baby Boomers 16% 18% 19% 2.2% 1.2%<br />
Prime-age wage earners 42% 41% 40% -1.1% -1.1%<br />
Source: Emsi Dataset 2017.3<br />
DIVERSITY<br />
Diversity in the workforce can be a driving factor in helping businesses appeal to larger markets<br />
and customer preferences. The variety of backgrounds and experiences that can be found in<br />
diverse employee groups often brings more creativity into the workplace. Many local economies<br />
have economic development efforts that seek to attract a diverse population base to increase<br />
local entrepreneurship and grow local creative endeavors, such as in the arts.<br />
FIGURE 4: Racial Diversity: A Comparison to the National Average for an Area of its Size<br />
USA<br />
USA<br />
USA<br />
LO<br />
66,982<br />
<strong>Clarksville</strong><br />
HI<br />
LO<br />
69,009<br />
Montgomery<br />
County<br />
HI<br />
LO<br />
119,630<br />
10-county<br />
HI<br />
Racial diversity is about average in <strong>Clarksville</strong> and Montgomery County, for areas of their size,<br />
but it is below average for the 10-county region. As shown in Table 3, on the next page, only<br />
approximately 24% of citizens in the 10-county region identify themselves as ethnic or racial<br />
minorities, compared to 37% in <strong>Clarksville</strong> and 36% in Montgomery County.<br />
Demographic Profile 11
TABLE 3: Total Population Diversity Trends, 10-county Region (2006-2016)<br />
10-COUNTY<br />
POPULATION<br />
PERCENTAGE POINT<br />
DIFFERENCE<br />
2006 2011 2016 2006-2011 2011-2016<br />
White 79% 78% 76% -1.4% -2.0%<br />
Black 13% 12% 13% -0.3% 0.3%<br />
American Indian or<br />
Alaskan Native<br />
0.4% 0.4% 0.4% 0.0% 0.0%<br />
Asian 1% 1% 1% 0.1% 0.2%<br />
Native Hawaiian or<br />
Pacific Islander<br />
0.2% 0.2% 0.2% 0.0% 0.0%<br />
Two or More Races 2% 2% 3% 0.4% 0.4%<br />
Hispanic, all races 5% 6% 7% 1.1% 1.1%<br />
Source: Emsi Dataset 2017.3<br />
Organizations and communities stand to gain several benefits from having a diverse workforce.<br />
Many firms experience growth in market share and are able to penetrate new markets or experience<br />
greater innovation with increasing diversity. Likewise, many communities have achieved greater<br />
success in attracting creative, skilled talent as their communities grow more diverse.<br />
FIGURE 5: Race/Ethnicity by Region, 2016<br />
White<br />
Black<br />
American Indian or Alaskan Native<br />
Asian<br />
Native Hawaiian or Pacific Islander Two or More Races Hispanic, all races<br />
0%<br />
10%<br />
20%<br />
30%<br />
40%<br />
50%<br />
60%<br />
70%<br />
80%<br />
90%<br />
100%<br />
<strong>Clarksville</strong><br />
Montgomery County<br />
10-county<br />
Source: Emsi Dataset 2017.3<br />
12<br />
COMPREHENSIVE LABOR ANALYSIS: CLARKSVILLE-MONTGOMERY COUNTY
INCOME<br />
Income is generally used as a measure of the economic well-being of individuals and communities.<br />
Montgomery County is on par with the nation for median household income, $53,185 compared<br />
to the nation at $53,889. Only two counties are above (Robertson and Cheatham counties) and<br />
the remainder counties in the region fall significantly below. The most recent recession took a toll<br />
on income levels across the country and effects were felt in this 10-county region.<br />
When adjusted for inflation, a decline in median household income is a result of a fairly flat trend<br />
in wages and salaries from 2010 to 2015 (see Table 4 and Figure 6). Significant drops in wage levels<br />
occurred in 2012, 2013 and 2014. Incomes improved slightly in 2015 but not enough to makeup<br />
for the overall decline.<br />
TABLE 4: Median Household Income by County (adjusted to 2015 dollars), 2010-2015<br />
GEOGRAPHY<br />
MEDIAN HOUSEHOLD INCOME<br />
(ADJUSTED IN $2015)<br />
COMPOUND ANNUAL<br />
GROWTH RATE<br />
2010 2015 2010-2015<br />
Robertson County, Tennessee $55,239 $53,151 -0.8%<br />
Cheatham County, Tennessee $57,158 $51,857 -1.9%<br />
Montgomery County, Tennessee $53,185 $50,344 -1.1%<br />
<strong>Clarksville</strong> city, Tennessee $50,806 $46,947 -1.6%<br />
Dickson County, Tennessee $48,428 $44,680 -1.6%<br />
Trigg County, Kentucky $45,462 $44,083 -0.6%<br />
Stewart County, Tennessee $43,711 $42,023 -0.8%<br />
Todd County, Kentucky $40,205 $40,497 0.1%<br />
Christian County, Kentucky $40,284 $39,521 -0.4%<br />
Houston County, Tennessee $36,672 $39,401 1.4%<br />
Logan County, Kentucky $37,660 $38,570 0.5%<br />
* sorted by highest median household income in 2015<br />
Source: U.S. Census Bureau, 2011-2015 and 2006-2010 American Community Survey 5-Year Estimates<br />
Demographic Profile 13
FIGURE 6: Average Earnings Trends (adjusted in 2015 dollars), 2010-2015<br />
<strong>Clarksville</strong> Montgomery County 10-county region<br />
$50,000<br />
$40,000<br />
$30,000<br />
$20,000<br />
$10,000<br />
$0<br />
2010 2011 2012 2013 2014 2015<br />
Source: Emsi Dataset 2017.3<br />
AVERAGE WEEKLY WAGE<br />
> $805–$871<br />
> $723–$805<br />
> $618–$721<br />
> $566–$618<br />
Christian<br />
Todd<br />
Logan<br />
Trigg<br />
Stewart<br />
Montgomery<br />
Robertson<br />
Cheatham<br />
Houston<br />
Tennessee: $912<br />
Dickison<br />
U.S.: $1,031<br />
14<br />
COMPREHENSIVE LABOR ANALYSIS: CLARKSVILLE-MONTGOMERY COUNTY
POVERTY<br />
Poverty rates are one measure used to gauge the health of regional economies because it is<br />
expected that as the economy grows, so will employment and income growth. Using federal<br />
poverty guidelines, Figure 7 illustrates that poverty rates in the past five years have generally<br />
edged downward throughout the region. Poverty in the 10-county region stands at 16.5% while<br />
the City of <strong>Clarksville</strong>’s overall poverty rate is 17.4%. Montgomery County has one of the lowest<br />
rates in the region at 13.4%. Christian County has the highest at 20.3% and Cheatham County has<br />
the lowest at 10.6%.<br />
Poverty is especially hurtful to children as they can be greatly impacted by hazardous or unhealthy<br />
living conditions, poor nutrition, and other risk factors associated with poverty. These risk factors<br />
may impact physical or emotional development, which may further reduce the acquisition of skills<br />
required for a career and a steady income.<br />
Roughly one in four persons under the age of 18 in the 10-county region is living in poverty. The<br />
region’s childhood poverty rate was approximately 24% in 2015. Montgomery County’s childhood<br />
poverty rate was 18% the same year—far less than the surrounding region. Houston County’s<br />
childhood poverty rate was the highest, at nearly 30% (see Figure 8).<br />
FIGURE 7: Poverty Rates by Geographic Area<br />
(2010-2015)<br />
FIGURE 8: Childhood Poverty Rates by<br />
Geographic Area (2010-2015)<br />
2010 2015 2010<br />
2015<br />
City of <strong>Clarksville</strong><br />
City of <strong>Clarksville</strong><br />
17.4 24.8<br />
10-county<br />
10-county<br />
16.5 23.9<br />
Montgomery County<br />
Christian County<br />
Logan County<br />
Todd County<br />
Trigg County<br />
Cheatham County<br />
Dickson County<br />
Houston County<br />
Robertson County<br />
Stewart County<br />
Montgomery County<br />
13.4 18.4<br />
Christian County<br />
20.3 28.9<br />
Logan County<br />
15.5 24.3<br />
Todd County<br />
19.3 28.1<br />
15.1 Trigg County<br />
26.5<br />
Cheatham County<br />
10.6 16.3<br />
16.4 Dickson County<br />
23.3<br />
Houston County<br />
19.5 29.9<br />
Robertson County<br />
12.3 18.4<br />
15.5 Stewart County<br />
25.2<br />
Source: U.S. Census Bureau, Small Area Income and Poverty Estimates<br />
Demographic Profile 15
EDUCATIONAL ATTAINMENT<br />
Long-term changes in educational attainment causes structural changes in the economy. Regional<br />
increases in educational attainment over the past decade can be considered a structural change<br />
with a permanent impact on the labor market.<br />
Montgomery County contains the largest share of residents who hold a bachelor’s degree or higher<br />
in the 10-county region. The region as a whole sits significantly below the national average, at<br />
30%, for percentage of residents who possess a bachelor’s degree or higher, but is similar to the<br />
national average for associate’s degrees earned. More than 17% of Montgomery County residents<br />
possess a bachelor’s degree (1.1% below the national average), and 8.8% hold an associate’s degree<br />
(1.0% above the national average). Figure 9 illustrates these trends.<br />
FIGURE 9: Educational Attainment (2016)<br />
Less than 9th grade<br />
9th grade to 12th grade High school diploma Some college<br />
Associate’s degree Bachelor’s degree Graduate degree and higher<br />
3+5+29+30+9+16+8+K4+6+30+27+9+17+7+K<br />
5+9+35+24+8+12+7+K<br />
9.4%<br />
16.3%<br />
7.9%<br />
<strong>Clarksville</strong><br />
29.5%<br />
2.8%<br />
5.0%<br />
7.9%<br />
12.3%<br />
23.9%<br />
29.0%<br />
6.7%<br />
4.8%<br />
10-county<br />
8.8%<br />
9.1%<br />
17.1%<br />
3.9%<br />
5.9%<br />
Montgomery<br />
County<br />
35.4%<br />
7.1%<br />
27.3%<br />
29.8%<br />
16<br />
COMPREHENSIVE LABOR ANALYSIS: CLARKSVILLE-MONTGOMERY COUNTY
STAKEHOLDER THEMES<br />
In August and September, Emsi conducted surveys, focus groups and individual interviews with<br />
small to large businesses, educators, military and workforce professionals. These touch points<br />
provided perspectives from people engaged in hiring, preparing and planning for the workforce<br />
relative to various aspects. During these interactions, the following was noted:<br />
• Stakeholders across many dimensions experience <strong>Clarksville</strong>, Montgomery as a young area.<br />
Read another way, more of the workforce here is comprised of younger workers than elsewhere.<br />
The number of retirement age workers is lower here than in other places. It will behoove the<br />
community to seek to better understand its youngest working age cohorts independently from<br />
the rest of the labor force; their skills and abilities, education trends, desired amenities, career<br />
needs and life plans. This should include the major segments of military veterans, Austin-Peay<br />
students and graduates, and those born and raised in the region.<br />
• There is strong agreement that the <strong>Clarksville</strong> school system is an asset. The 1300 student<br />
bump for the 2017-2018 school year exceeded expectations by 700 students. This indicates,<br />
along with a low housing inventory (1,100 in <strong>Clarksville</strong> compared to a 2,300-2,500 norm) that<br />
families are increasingly choosing <strong>Clarksville</strong>. <strong>Clarksville</strong> needs to ensure that the jobs in its<br />
foreseeable future enable families to remain in the region.<br />
• This is a military-friendly area. <strong>Clarksville</strong> is exceedingly proud of its military and seeks to keep<br />
more of those exiting the military. The diversity, youth, discipline and service of those who are<br />
coming out of Fort Campbell are highly valued. There is a recognition that gaps exist between<br />
the ways exiting military are prepared to engage with businesses versus how businesses are<br />
prepared to engage those separating from the military.<br />
In many respects, <strong>Clarksville</strong>-Montgomery leads the 10-county region for positive demographic<br />
trends. It has the most positive migration and generation dynamics, has the most diverse population,<br />
the highest levels of educational attainment and the lowest percentage of poverty. Areas of<br />
concern include income stagnation and ensuring that younger cohorts continue to attain levels<br />
of skill and education consistent with industries’ current and future needs, as well as to support<br />
and build the industry mix that meets the community’s vision for the future.<br />
As will be explored in the following sections, some of <strong>Clarksville</strong>’s distinct segments bear review<br />
for their potential impact on the short and long-term needs of the community.<br />
Demographic Profile 17
LABOR FORCE<br />
Measuring labor utilization is important in that labor is a productive input<br />
to vibrant economies which cannot be stored. As well, productive labor<br />
determines income and for many people, labor is the only income source.<br />
In this section, the region’s workforce will be explored for its composition<br />
and performance using both well known metrics such as participation rates<br />
as well as a newer measure of underemployment.<br />
KEY HIGHLIGHTS<br />
• Labor force participation rates are higher than the national average.<br />
• High levels of underemployment.<br />
• About half of Montgomery County residents leave the county for work—a large<br />
untapped segment of Montgomery County’s workforce include transportation<br />
and material moving jobs along with those working in manufacturing elsewhere.<br />
• Montgomery County is a great location for teachers, while healthcare and business<br />
professionals seek work elsewhere.<br />
The labor force is composed of those people age 16 and over in the civilian non-institutionalized<br />
population, including those classified as unemployed. Understanding labor force composition,<br />
particularly in terms of skills availability, provides some indications of an economy’s dynamism.<br />
For example, some economists project lower rates of economic growth in the coming years driven<br />
largely by the slowing growth of the labor force. Nationwide, slowing labor force growth may be<br />
due to several factors, including but not limited to the following:<br />
• Demographic shifts—increases or decreases in retirees or youth<br />
• Discouraged workers who have dropped out due to a lack of job prospects<br />
• People who stay in school longer or return to school<br />
• Disengaged young adults<br />
18<br />
COMPREHENSIVE LABOR ANALYSIS: CLARKSVILLE-MONTGOMERY COUNTY
Below are the labor force figures pertaining to Montgomery County.<br />
39+2+K 41+36+K 77+23+H<br />
FIGURE 10: 2016 Labor Force Breakdown: Montgomery County<br />
197,290<br />
Population<br />
POPULATION<br />
Total Working Age Population 151,720<br />
Labor Force 80,453<br />
Employed 76,276<br />
Unemployed 4,177<br />
Not in Labor Force (15+) 71,267<br />
Under 15 45,571<br />
The larger 10-county region boasts nearly 216,000 residents in the labor force. More than one-third<br />
of this labor force lives in Montgomery County and over one-quarter resides in <strong>Clarksville</strong> alone.<br />
<strong>Clarksville</strong> is the population center of Montgomery County, as 77% of its population resides there.<br />
It also supplies 74% of its labor force. It makes sense, therefore, that <strong>Clarksville</strong> and Montgomery<br />
County trends closely follow each other—both grew over 2.5% over the past five years, or at an<br />
annual rate of 0.5% (see Table 5).<br />
TABLE 5: Labor Force Trends, 2011-2016<br />
LABOR FORCE<br />
COMPOUND<br />
ANNUAL<br />
GROWTH RATE<br />
STRAIGHT<br />
GROWTH RATE<br />
2011 2016 (2011-2016)<br />
<strong>Clarksville</strong> 57,584 59,075 0.5% 2.6%<br />
Montgomery County 77,267 79,415 0.5% 2.8%<br />
10-county 216,422 215,998 0.0% -0.2%<br />
Source: Emsi Dataset 2017.3 using U.S. Bureau of Labor Statistics, LAUS program<br />
Six of the ten counties experienced declines. Labor force growth in the greater 10-county region<br />
was flat. Montgomery County showed the strongest labor force growth of the 10 counties, adding<br />
over 2,100 people to its available labor force over the past five years.<br />
A slowing growth in the labor force is a trend confronting employers across the country.<br />
Labor Force 19
To better understand this regional phenomenon, we analyzed the labor force participation rate.<br />
This broader measure is another indicator of labor market supply and demand and is defined as<br />
the share of population (age 16+) that is either working or actively seeking work.<br />
Across the country, the labor force participation rate (LFPR) has been steadily declining for the<br />
past 15 years. The trend continues with a net decline of over one percentage point between 2011<br />
(64.8%) and 2016 (63.5%) nationwide. While this may not seem significant, one way to put this in<br />
perspective is that if the LFPR were at historic levels, another 10 million people would be in the<br />
workforce. Economists have attributed the low LFPR to two main factors. First, an unusually slow<br />
recovery which has caused some workers to become discouraged, or disengaged, and permanently<br />
drop out of the labor force—particularly the younger working-age. And secondly, the demographic<br />
shift of an aging workforce and retiring Baby Boomers. Combined, these factors have resulted in<br />
a structural shift in labor force dynamics.<br />
If the workers who make up the decline in labor force participation refuse to enter the workforce<br />
even as job prospects strengthen, there will be no sizable influx of workers as a robust recovery<br />
takes hold—which we are now seeing. Consequently, the unemployment rate will fall much more<br />
quickly than in a typical recovery. Conversely, a cyclical change would occur if these discouraged<br />
and disengaged workers can be drawn back into the labor market by a robust recovery; they will<br />
boost the labor force participation rate (since they would be actively looking for work).<br />
Tennessee has an even lower labor force participation rate than the nation. <strong>Clarksville</strong>’s and<br />
Montgomery County’s rate are exceptionally higher, nearly three percentage points, but trending<br />
downward like the nation. The rate amongst the 16 to 19 age cohort has dropped nearly 8<br />
percentage points (most likely due to the recession) over the five year period, followed by the 25<br />
to 44 age cohort (3 percentage points). Conversely, population has continued to grow at a fast<br />
rate in these age cohorts.<br />
20<br />
COMPREHENSIVE LABOR ANALYSIS: CLARKSVILLE-MONTGOMERY COUNTY
FIGURE 11: Labor Force Participation Rates, 2011-2016<br />
2011<br />
2016<br />
96+95+88+91 93+92+86+89<br />
68.5%<br />
66.4%<br />
67.9% 66.0%<br />
62.7% 61.1%<br />
64.8% 63.5%<br />
<strong>Clarksville</strong><br />
Montgomery<br />
County<br />
Tennessee<br />
U.S.<br />
Source: Emsi Dataset 2017.3 using U.S. Bureau of Labor Statistics, LAUS program<br />
FIGURE 12: Labor Force Participation Rate by Age Group, Montgomery County (2011-2016)<br />
2011<br />
2016<br />
52+92+99+92+74+21+6 43+93+95+90+72+27+8<br />
35.6%<br />
77.3%<br />
79.2%<br />
75.3%<br />
60.1%<br />
22.3%<br />
16 to 19 20 to 24 25 to 44 45 to 54 55 to 64 65 to 74 75 and<br />
over<br />
6.3%<br />
Source: Emsi Dataset 2017.3 using U.S. Bureau of Labor Statistics, LAUS program<br />
Labor Force 21
UNDEREMPLOYMENT<br />
Underemployment describes portions of a population working in careers which do not fully utilize<br />
the education they have received. The underemployed workforce represents a talent pool of<br />
qualified workers available for jobs with more education than required by the jobs they currently<br />
hold. Emsi evaluates gaps between the educational attainment of a regional population and typical<br />
entry level job requirements. Emsi uses detailed regional analysis of deltas between this supply<br />
and demand of education in a market to reveal underemployment. The figure below represents<br />
employment of the population age 25 and older.<br />
Understanding underemployment in <strong>Clarksville</strong> requires further investigation. While the most<br />
obvious explanation, that jobs requiring higher skills are not available, may be true; there are other<br />
reasons that could factor into the gap. One being that exiting military do not have the typical<br />
educational requirements to apply for higher wage jobs but may have the experience to do these<br />
jobs well. Given the prevalence of military, highly educated spouses may be choosing lower level<br />
jobs for flexibility (however, this plays a small role, given recent survey results – only 33% of military<br />
spouses surveyed, work). Another argument could be made that the large number of businesses,<br />
particularly in manufacturing, have jobs available but not the population to support them. Another<br />
potential factor could be that wages are low, despite the education or the experience level required.<br />
The figure below depicts the percentage point difference between share of jobs and people to<br />
fill them by typical entry level education. Negative numbers indicate an oversupply of people<br />
while a positive number represents more jobs than people to fill them. Keeping in mind this is<br />
typical entry level of education, there are not enough middle skill jobs for the amount of people<br />
with these skill levels. There are plenty of people with skills or who want skills to get better jobs<br />
but the jobs are not available.<br />
UNDEREMPLOYMENT IN THE CLARKSVILLE MSA<br />
(difference* between share of jobs and population by typical entry level of educational attainment)<br />
–20% –15% –10% –5% 0% 5%<br />
10%<br />
15%<br />
Graduate Degree and Higher<br />
Bachelor’s Degree<br />
Associate’s Degree<br />
Some college, no degree<br />
High school diploma or equivalent<br />
No formal educational credential<br />
* negative numbers indicate a surplus<br />
Source: Emsi Dataset 2017.3<br />
MORE PEOPLE<br />
THAN JOBS<br />
MORE JOBS THAN<br />
PEOPLE<br />
22<br />
COMPREHENSIVE LABOR ANALYSIS: CLARKSVILLE-MONTGOMERY COUNTY
COMMUTING PATTERNS<br />
Commuting patterns show how far workers travel from their places of residence to their places<br />
of work. This data demonstrates whether there is an adequate supply of workers or jobs within<br />
a given area. For a more concise and directed assessment, commuting patterns were analyzed<br />
for Montgomery County using data from the Census LEHD’s On the Map program. Then, Emsi<br />
proprietary data was analyzed to better understand the skillsets of Montgomery County residents.<br />
FIGURE 13: Concentration of Jobs vs. Net Commuters, 10-County Region<br />
Source: Emsi Dataset 2017.3<br />
Labor Force 23
FIGURE 14: Commuting Patterns, Montgomery County (2015, all jobs)<br />
27+50+87+22+25+25+29+27 23+38+64+19+14+22+28+25 22+28+26+17+12+21+26+24 17+23+22+16+8+19+19+15<br />
W<br />
WHERE MONTGOMERY<br />
COUNTY RESIDENTS WORK<br />
Job Counts by Distance/Direction in 2015<br />
All Workers<br />
NW<br />
4,000<br />
N<br />
34+71+96+54+73+76+65+47 31+58+70+47+57+71+63+45 29+47+48+40+52+62+61+43 26+39+36+31+38+51+52+39<br />
Circles are<br />
at >10 miles,<br />
10-24 miles,<br />
25-50 miles,<br />
TABLE 6: Where Residents from Montgomery County Work within the 10-county Region, 2015<br />
(all jobs)<br />
WORK IN COUNTY<br />
OF RESIDENCE<br />
WORK OUTSIDE COUNTY<br />
OF RESIDENCE<br />
AVG TRAVEL TIME<br />
TO WORK<br />
Cheatham 15% 85% 31.6<br />
Dickson 34% 66% 31.3<br />
Houston 30% 70% 33.4<br />
Robertson 28% 72% 28.9<br />
Stewart 26% 74% 34.4<br />
Montgomery 53% 47% 24.2<br />
Trigg 34% 66% 26.5<br />
Christian 62% 38% 17<br />
Todd 28% 72% 24<br />
Logan 41% 59% 23<br />
Source: U.S. Census Bureau, Center for Economic Studies, On the Map program (2015, all jobs)<br />
Roughly 53% of Montgomery County residents work within the county—a high share compared<br />
to the greater region, while 47% leave the county every day for work. The data show a portion of<br />
Montgomery County residents working as far as Memphis, Chattanooga, and Knoxville, Tennessee.<br />
This can be triggered by the student population, residents working at larger firms (headquarters,<br />
etc), or higher education institutions in those areas.<br />
According to the Census, there are more Montgomery County residents earning at least $21 per<br />
hour than there are jobs paying that wage within the County. Meanwhile, there are more jobs in<br />
Montgomery County that pay less than $7.80 per hour than there are residents who earn that wage.<br />
It stands to reason that the gap is made up of people who work in Montgomery County but live<br />
outside of it. These wage data point to two potential trends worth investigating: whether more<br />
talented workers must leave the area daily, while those with fewer skills who make up a sizable<br />
chunk of the local workforce are unable to live in the area.<br />
FIGURE 15: Net Commuters of Resident Workers, Montgomery County (2016)<br />
JOBS<br />
58,500<br />
RESIDENT WORKERS<br />
(AVAILABLE WORKFORCE)<br />
64,000<br />
NET COMMUTERS<br />
(OF RESIDENT WORKERS)<br />
-5,500<br />
Source: Emsi dataset 2017.3<br />
Labor Force 25
0+2+0+0+0+0+1+3+0+0+3+2+10+7+1+3+2+2+1<br />
Cheatham and Robertson counties both have the largest share of residents working outside their<br />
counties. However, Montgomery County is an employment hub within this 10-county region (see<br />
Table 6).<br />
Emsi proprietary data allows us to look at the data in a different way. Emsi uses place of residence<br />
data derived from the Census LODES data (specifically from Origin and Destination data, Regional<br />
Area Characteristics, and Workforce Area Characteristics data) which Emsi applied to occupation<br />
and job numbers. This data is referred to here as “Resident Workers.” Note that Emsi jobs and<br />
commuting data do not match the Census’ On the Map data (Figure 14). Emsi uses county-level<br />
data while the Census uses drive-time radii.<br />
This data allow us to see the overall number of people commuting into or out of an area. This<br />
is referred to as Net Commuters. The data tells the story further by viewing what occupations<br />
residents hold.<br />
The term “resident workers” defines workers by where they live in comparison to where they work.<br />
“Net commuters” refers to the minimum number of workers who commute in or out of the region<br />
to satisfy the region’s jobs. A positive number (shown in BLUE in the figure on the previous page)<br />
describes net commuters entering a region, while a negative number (shown in RED) describes<br />
net commuters leaving a region. A broader view of the region is illustrated in Figure 13.<br />
Retail and food service type jobs typically comprise the largest share of an area’s workforce.<br />
However, Montgomery County is unique in its concentration of production and management<br />
occupations. This is no surprise considering that manufacturing is the largest private industry<br />
FIGURE 16: Available Workforce, Montgomery County (2016)<br />
Jobs Resident Net Commuters<br />
–2,000<br />
0<br />
2,000<br />
4,000<br />
6,000<br />
8,000<br />
10,000<br />
12,000<br />
Source: Emsi Dataset 2017.3<br />
Retail Sales<br />
Food and Beverage Serving<br />
Cooks and Food Preparation<br />
Information and Record Clerks<br />
Other Management Occupations<br />
Secretaries and Administrative Assistants<br />
Other Office and Administrative support<br />
Business Operations Specialists<br />
Financial Clerks<br />
Supervisors of Sales<br />
Motor Vehicle Operators<br />
Material, Scheduling, Dispatching, and Distributing<br />
Material Moving<br />
Assemblers and Fabricators<br />
Other Installation, <strong>Main</strong>tenance, and Repair<br />
Production Occupations<br />
Metal and Plastic<br />
Construction Trades<br />
Building Cleaning and Pest Control<br />
Health Diagnosing and Treating Practitioners<br />
Health Technologists and Technicians<br />
Teachers<br />
Other Teachers and Instructors<br />
Other Personal Care and Service<br />
Military Occupations<br />
100+0+41 94+73+40 50+36+2061+37+0+0+0+0+22 58+36+30+25+23+23+21 30+18+15+12+10+11+11 0+0+0+0+0+0+0+0+0 31+34+23+27+28+23+20+34+31 14+16+7+10+14+10+9+16+15<br />
31+30 14+150+34 33+29 16+1727+0 27+23 13+6<br />
26<br />
COMPREHENSIVE LABOR ANALYSIS: CLARKSVILLE-MONTGOMERY COUNTY
sector. Figure 16 above shows residents who commute out of Montgomery County for work by<br />
occupation. At least 2,800 residents leave the county for transportation, material moving, and<br />
production occupations, whose median wage is $15 per hour. This is a large untapped segment<br />
of the labor pool in Montgomery County.<br />
Approximately 360 residents seek work elsewhere for business and financial jobs and an additional<br />
360 for healthcare jobs, of which half are registered nurses. On the flip side, there are more teaching<br />
jobs in Montgomery County than there are teachers living in the county by roughly 570.<br />
Labor Force 27
STAKEHOLDER THEMES<br />
When asked generally about their labor force, labor force strengths in this area and future needs,<br />
survey and focus group responses varied.<br />
• 74% of businesses surveyed mentioned they experience difficulty in being able to hire enough<br />
workers. While overall retention rates are strong, with turnover rates as low as 5-8% after<br />
6 months of employment, some manufacturers mentioned difficulty hiring and retaining<br />
production workers with the necessary soft skills. Others discussed the lack of an adequately<br />
skilled workforce. Suggestions for the lack in workforce ranged from people preferring to receive<br />
government assistance, opioid addiction, and segments of the population who simply do not<br />
want to participate in the labor force. As is shown in this report, labor force participation among<br />
young workers is average for those age groups. Two further items to consider as potential<br />
inhibitors to labor force participation are the use of temporary agencies and even without<br />
them, the offer of part-time or contract work as opposed to full-time employment. Survey<br />
respondents indicated that contract or part-time employees made up 18% of the workforce.<br />
This, as well as use of temporary agencies, signals a lack of investment in employees, which<br />
can make attracting highly competent and skilled workers difficult in an already tough labor<br />
market. On the military base, transition program managers suggested that veterans will often<br />
avoid applying for work through staffing agencies, while interview and focus group results<br />
showed that among many manufacturers, using staffing agencies is the first route these<br />
employers take to find production workers.<br />
• A few employers acknowledged that the manufacture of their products is carried out under<br />
difficult physical working conditions (particularly unconditioned environments), and that they<br />
have unpopular policies such as mandatory overtime and weekend work. These conditions<br />
require a unique workforce and specific programs to attract workers. For these, transitions from<br />
retail, service sectors, and military are more difficult as the work environment and demands<br />
do not match expectations.<br />
• For other manufacturers, manufacturing environments and the nature of the work has changed<br />
dramatically, with more mechanized processes and more comfortable working environments.<br />
Unfortunately, the feeling was that the community remains largely unaware about the present<br />
state of these improvements in manufacturing. Employers want the community to encourage<br />
more young workers to consider that their industries provide good working environments<br />
and career paths.<br />
• Small entrepreneurial businesses indicated that they experience positive hiring processes. These<br />
business owners relied on informal social connections to connect with military spouses, Austin<br />
Peay students, and other segments. They also noted that employees, especially the youngest,<br />
needed additional hard and soft skill training once hired. This need was met through informal<br />
mentoring with each new employee. Importantly, mentees of these entrepreneurs can remain<br />
in <strong>Clarksville</strong> and become a part of a more connected and skilled talent base.<br />
• Employers mentioned difficulty connecting rural workers to jobs in <strong>Clarksville</strong>, as well as finding<br />
management skill for companies located in rural parts of the area. This kind of disconnect is<br />
felt in many communities. Strategies to address it range from public transportation, private/<br />
28<br />
COMPREHENSIVE LABOR ANALYSIS: CLARKSVILLE-MONTGOMERY COUNTY
public transportation, broadband availability, and housing options.<br />
• Bus transportation from <strong>Clarksville</strong> to Nashville was highlighted. The system handles 8,000 riders per<br />
month.<br />
• Amongst millennials ages 25-34, a significant group in <strong>Clarksville</strong>, 27% percent hold bachelor’s degrees.<br />
This is six percentage points lower than the national average. Meanwhile, the area’s occupational mix<br />
indicates a demand for people with bachelor degrees while an oversaturation of those with associate<br />
degrees exists. There is, therefore, an opportunity to transition those with some college or an associate’s<br />
degree to occupations requiring a bachelor’s degree.<br />
Labor Force 29
THE ECONOMY AND<br />
JOB PERFORMANCE<br />
INDUSTRY<br />
KEY HIGHLIGHTS<br />
• $5 billion economy<br />
• 13% Job Growth<br />
Top employing industries:<br />
• Government<br />
• Retail trade<br />
• Accommodation and food services<br />
• Health care<br />
• Manufacturing<br />
Important industries that may require attention:<br />
• Textile product mills<br />
• Nonmetallic mineral product manufacturing<br />
• Nursing and residential care facilities<br />
• Machinery manufacturing<br />
Montgomery County has grown into a $4.92 billion economy following exceptional job growth<br />
over the past five years. The largest contributors (with the exception of government) include retail,<br />
followed by manufacturing and health care. <strong>Clarksville</strong> accounted for nearly all job growth and<br />
contributes 86% to the county’s overall gross regional product (GRP).<br />
GROSS REGIONAL PRODUCT (GRP)<br />
$19.3 billion<br />
10-county<br />
$11.53<br />
billion<br />
<strong>Clarksville</strong> MSA<br />
$4.92 billion<br />
Montgomery County<br />
$4.23 billion<br />
<strong>Clarksville</strong><br />
30<br />
COMPREHENSIVE LABOR ANALYSIS: CLARKSVILLE-MONTGOMERY COUNTY
TABLE 7: Job Performance<br />
2011 2016<br />
NUMERIC<br />
CHANGE<br />
COMPOUND<br />
ANNUAL GROWTH<br />
RATE<br />
<strong>Clarksville</strong> 50,863 57,608 6,745 2.5%<br />
Montgomery County 51,647 58,483 6,836 2.5%<br />
10-county 186,351 197,222 10,871 1.1%<br />
Source: Emsi Dataset 2017.3<br />
Manufacturing is the largest private industry sector in the 10-county region, although it is not<br />
Montgomery County’s largest sector. Government, retail trade, accommodation and food services,<br />
and health care are all larger employers than manufacturing in Montgomery County. To understand<br />
Montgomery County’s most critical industries, we measure jobs by their concentration, or location<br />
quotient. Location quotients, or LQ, measures a region’s industry concentration compared to the<br />
nation. We also analyze the region’s gross regional product (GRP), and job growth. The staffing<br />
patterns of these critical industries can be used to identify driver occupations.<br />
FIGURE 17: Share of Total Jobs by Region, 2016<br />
<strong>Clarksville</strong> Montgomery County 10-county<br />
0%<br />
5%<br />
10%<br />
15%<br />
20%<br />
25%<br />
30%<br />
35%<br />
Government<br />
Retail Trade<br />
Accommodation and Food Services<br />
Health Care and Social Assistance<br />
Manufacturing<br />
Admin., Support, Waste Mgt., Remediation Services<br />
Construction<br />
Other Services (except Public Administration)<br />
Professional, Scientific, and Technical Services<br />
Finance and Insurance<br />
Wholesale Trade<br />
Real Estate and Rental and Leasing<br />
Information<br />
Transportation and Warehousing<br />
Educational Services<br />
Arts, Entertainment, and Recreation<br />
Management of Companies and Enterprises<br />
Mining, Quarrying, and Oil and Gas Extraction<br />
Crop and Animal Production<br />
Utilities<br />
* sorted by Montgomery County<br />
Source: Emsi Dataset 2017.3<br />
The Economy and Job Performance 31
FIGURE 18: Industry Concentration, Montgomery County (2016), 5-digit NAICS<br />
Industry Jobs<br />
National Average<br />
0<br />
1,000<br />
2,000<br />
3,000<br />
4,000<br />
5,000<br />
6,000<br />
7,000<br />
Restaurants and Other Eating Places<br />
Education and Hospitals (Local Government)<br />
Local Government, Excluding Education and Hospitals<br />
Other General Merchandise Stores<br />
Education and Hospitals (State Government)<br />
Source: Emsi Dataset 2017.3<br />
To better gauge how industries are performing in Montgomery County and help determine where<br />
to concentrate economic development efforts, an analysis was performed on all industries with<br />
over 400 jobs. The indicators were job growth and job concentration (or LQ). All industries that<br />
showed a decline in job growth from 2011 to 2016 and had an LQ below 1.0 (percent below the<br />
national average) signified little promise to the local economy and were disregarded.<br />
Emerging industries are those industries which have job growth but which also have an LQ below<br />
1.0. In other words, industries whose concentrations are currently lower than the national average<br />
but jobs are increasing. Specialty trade contractors, for example, may be an industry to watch.<br />
The more concentrated an industry, the more likely it is the industry is exporting products and<br />
services, thereby bringing wealth to the region.<br />
Industries important to the area have experienced healthy job growth and an LQ above 1.2. These<br />
industries are considered Montgomery County’s areas of specialty and can provide opportunities<br />
for industry and supply chain expansion.<br />
Critically, there are industries that are important to the region’s economy but may be struggling<br />
and need some attention. These industries reveal a loss in jobs over time but higher LQs. Textile<br />
product mills and nonmetallic mineral product manufacturing are highly unique to the region but<br />
have lost approximately 100 jobs over the five year period. See Figure 19, on the next page, for a<br />
summary of findings.<br />
32<br />
COMPREHENSIVE LABOR ANALYSIS: CLARKSVILLE-MONTGOMERY COUNTY
FIGURE 19: Montgomery County Industry Health Check<br />
POTENTIAL<br />
EMERGING<br />
IMPORTANT THAT<br />
MAY REQUIRE ATTENTION<br />
IMPORTANT GROWTH<br />
INDUSTRIES<br />
Speciality Trade Contractors Textile Product Mills Food Services and Drinking Places<br />
Professional, Scientific,<br />
and Technical Services<br />
Nonmetallic Mineral<br />
Product Manufacturing<br />
Administrative and Support Services<br />
Food and Beverage Stores Nursing and Residential Care Facilities Ambulatory Health Care Services<br />
Merchant wholesalers,<br />
Nondurable Goods<br />
Machinery Manufacturing<br />
Publishing Industries (except Internet)<br />
Accommodation<br />
General Merchandise Stores<br />
Merchant Wholesalers,<br />
Durable Goods<br />
Transportation Equipment<br />
Manufacturing<br />
Truck Transportation<br />
Real Estate<br />
Sporting Goods, Hobby, Musical<br />
Instrument, and Book Stores<br />
Credit Intermediation and<br />
Related Activities<br />
Repair and <strong>Main</strong>tenance<br />
Miscellaneous Store Retailers<br />
Motor Vehicle and Parts Dealers<br />
Social Assistance<br />
Clothing and Clothing<br />
Accessories Stores<br />
The Economy and Job Performance 33
REGIONAL BUSINESS DYNAMICS<br />
KEY HIGHLIGHTS<br />
• 3,000 payrolled businesses<br />
• 17% firm growth<br />
• Many medium to large sized businesses<br />
• Self-employment rate: 7.5%<br />
Analyzing an area’s business mix provides a useful snapshot of the firm dynamics of a regional<br />
economy. The number, sizes, and types of firms say much about the character, dependencies,<br />
and growth opportunities within a region.<br />
The context of Montgomery County’s firm composition reveals several striking dimensions to<br />
the area’s economy. In 2016, there were nearly 3,000 firms with paid employees in Montgomery<br />
County. According to the U.S. Census’ County Business Patterns program, over 85% of those firms<br />
had 19 or fewer employees, which is relatively low for an area of this size. This means there are<br />
more medium to large sized businesses in the region than average—10% of businesses employ<br />
20-49 people, and 5% employ over 50 people.<br />
The employment created by local entrepreneurs and second and third tier suppliers puts a<br />
positive pressure on the region’s development. In addition to the payrolled firms described<br />
above, Montgomery County has 4,400 self-employed individuals, a 7.5% self-employment rate.<br />
Montgomery County stands out above the national self-employment rate of 6.5% with most of<br />
these people working as construction and landscaping workers, hairdressers, and childcare workers.<br />
34<br />
COMPREHENSIVE LABOR ANALYSIS: CLARKSVILLE-MONTGOMERY COUNTY
TABLE 8: Number of Payrolled Businesses by Industry<br />
INDUSTRY<br />
2016 PAYROLLED<br />
BUSINESS LOCATIONS<br />
All Industries 2,947<br />
Retail Trade 530<br />
Accommodation and Food Services 342<br />
Health Care and Social Assistance 315<br />
Construction 278<br />
Other Services (except Public Administration) 269<br />
Professional, Scientific, and Technical Services 249<br />
Finance and Insurance 194<br />
Administrative and Support and Waste Management and Remediation Services 149<br />
Real Estate and Rental and Leasing 143<br />
Wholesale Trade 119<br />
Manufacturing 84<br />
Transportation and Warehousing 63<br />
Government 62<br />
Educational Services 46<br />
Arts, Entertainment, and Recreation 35<br />
Information 34<br />
Management of Companies and Enterprises 15<br />
Crop and Animal Production 8<br />
Mining, Quarrying, and Oil and Gas Extraction 4<br />
Utilities 4<br />
Source: Emsi<br />
FIRM GROWTH<br />
2011–2016<br />
17%<br />
Montgomery County<br />
TOP SELF-EMPLOYED IN<br />
MONTGOMERY COUNTY<br />
SELF-EMPLOYMENT RATES<br />
1. Construction trades<br />
2. Landscaping workers<br />
15+15+13<br />
Montgomery County<br />
10-county Region<br />
U.S.<br />
7.5%<br />
7.5%<br />
6.5%<br />
3. Hairdressers<br />
4. Childcare workers<br />
The Economy and Job Performance 35
WORKERS<br />
KEY HIGHLIGHTS<br />
Hot Jobs:<br />
• Registered nurses<br />
• Teachers (all levels)<br />
• General and operations managers<br />
Most abundant occupations:<br />
• Office and administrative support<br />
• Sales<br />
• Food services<br />
• Education<br />
• Production<br />
Industry data is necessary to gain a sense of regional economic trends, but to better understand<br />
the quality of the jobs contained within a region, some knowledge of occupations is needed. This<br />
is because earning and educational levels of workers are associated more directly to occupations<br />
than with the industry in which they work. For example, the manufacturing industry, while employing<br />
a number of assemblers and machine operators—also employs people in management occupations<br />
and in professional occupations such as engineering. All of these occupations have different pay<br />
scales and require varying levels of education and training.<br />
FIGURE 20: Top Occupation Groups, Montgomery County (2016)<br />
2016 Jobs 2021 Jobs<br />
0<br />
2,000<br />
4,000<br />
6,000<br />
8,000<br />
10,000<br />
12,000<br />
Office and Administrative Support<br />
Sales and Related<br />
Food Preparation and Serving<br />
Education, Training, and Library<br />
Production<br />
Management<br />
Healthcare Practitioners and<br />
Transportation and Material<br />
Installation, <strong>Main</strong>tenance, and<br />
Construction and Extraction<br />
Personal Care and Service<br />
Building Grounds <strong>Main</strong>tenance<br />
Healthcare Support<br />
Business and Financial Operations<br />
Protective Services<br />
Source: Emsi Dataset 2017.3<br />
36<br />
COMPREHENSIVE LABOR ANALYSIS: CLARKSVILLE-MONTGOMERY COUNTY
TABLE 9: Occupation Groups with Most Growth Potential and Median Wage of $15/hr and<br />
Higher, Montgomery County (2016-2021)<br />
SOC<br />
DESCRIPTION<br />
2016<br />
JOBS<br />
2021<br />
JOBS<br />
CHANGE<br />
%<br />
CHANGE<br />
2016<br />
LOCATION<br />
QUOTIENT<br />
MEDIAN<br />
HOURLY<br />
EARNINGS<br />
ANNUAL<br />
OPENINGS<br />
SOC<br />
Description<br />
2016<br />
Jobs<br />
2021<br />
Jobs<br />
Change<br />
%<br />
Change<br />
2016<br />
Location<br />
Quotient<br />
Median<br />
Hourly<br />
Earnings<br />
Annual<br />
Openings<br />
29-0000<br />
25-0000<br />
Healthcare<br />
Practitioners and<br />
Technical<br />
Education, Training,<br />
and Library<br />
2,962 3,372 410 14% 0.95 $25.50 152<br />
4,450 4,827 377 8% 1.35 $24.84 189<br />
11-0000 Management 3,536 3,822 286 8% 1.13 $27.52 150<br />
13-0000<br />
49-0000<br />
Business and Financial<br />
Operations<br />
Installation,<br />
<strong>Main</strong>tenance, and<br />
Repair<br />
1,472 1,708 236 16% 0.51 $25.78 80<br />
2,420 2,616 196 8% 1.10 $19.07 100<br />
33-0000 Protective Service 944 1,085 141 15% 0.73 $19.02 56<br />
15-0000<br />
21-0000<br />
27-0000<br />
Computer and<br />
Mathematical<br />
Occupations<br />
Community and<br />
Social Service<br />
Occupations<br />
Arts, Design,<br />
Entertainment,<br />
Sports, and Media<br />
Occupations<br />
576 685 109 19% 0.36 $30.26 31<br />
855 963 108 13% 0.91 $19.17 42<br />
775 851 76 10% 0.75 $16.62 37<br />
55-0000 Military occupations 638 694 56 9% 0.88 $16.79 27<br />
47-0000<br />
17-0000<br />
19-0000<br />
Construction and<br />
Extraction<br />
Architecture<br />
and Engineering<br />
Occupations<br />
Life, Physical, and<br />
Social Science<br />
Occupations<br />
2,234 2,283 49 2% 0.87 $15.07 61<br />
560 596 36 6% 0.59 $30.29 24<br />
209 244 35 17% 0.45 $27.65 14<br />
23-0000 Legal Occupations 162 176 14 9% 0.34 $36.24 6<br />
51-0000 Production 3,994 3,664 (330) (8%) 1.17 $16.06 106<br />
Source: Emsi Dataset 2017.3<br />
The Economy and Job Performance 37
Office and administrative support is the largest occupation group in Montgomery County. Call<br />
centers employ the largest share of these workers, followed by local government. The majority of<br />
sales positions are in warehouse clubs—either Wal-Mart, Sam’s Club or Costco (Figure 20). Only<br />
eight of the 23 occupation groups have a median wage under $15 per hour, which approaches the<br />
regional median. None of these rank amongst the highest paid, however (Table 9).<br />
Occupations that appear to be highest on the regional pay scale, and which also employ a sizeable<br />
number of workers, are registered nurses and elementary school teachers at approximately $28<br />
per hour. Several high skills, high wage occupations are expected to experience growth in the<br />
next five years, such as elementary and secondary school teachers, registered nurses, general and<br />
operations managers, and postsecondary teachers.<br />
Figure 21 provides a look at job growth and the average annual job openings for workers with<br />
some college or above by occupation group. Job openings refer to new jobs due to growth<br />
plus replacement jobs due to worker turnover. Between 2016 and 2021, the occupations with<br />
the projected highest number of job growth and average annual job openings for workers with<br />
some college or above occurs in education occupations (teachers), healthcare practitioners, and<br />
management.<br />
FIGURE 21: Job Growth and Average Annual Openings by Occupation Group with Some<br />
College and Above Experience, Montgomery County (2016-2021)<br />
Job Growth<br />
Annual Openings<br />
0 50 100 150 200 250 300 350<br />
400<br />
Education, Training, and Library<br />
Healthcare Practitioners and Technical<br />
Management<br />
Business and Financial Operations<br />
Healthcare Support<br />
Computer and Mathematical<br />
Community and Social Service<br />
Personal Care and Service<br />
Arts, Design, Entertainment, Sports, and Media<br />
Transportation and Material Moving<br />
Installation, <strong>Main</strong>tenance, and Repair<br />
Architecture and Engineering<br />
Protective Service<br />
Office and Administrative Support<br />
Life, Physical, and Social Science<br />
Sales and Related<br />
Legal<br />
Source: Emsi Dataset 2017.3<br />
38<br />
COMPREHENSIVE LABOR ANALYSIS: CLARKSVILLE-MONTGOMERY COUNTY
REAL-TIME DATA<br />
KEY HIGHLIGHTS<br />
Supply: 37,000 profiles of Montgomery County residents<br />
• customer service reps<br />
• retail<br />
• sales and general managers<br />
• administrative assistants<br />
Demand: 45,000 annual job postings<br />
• truck drivers<br />
• registered nurses<br />
• real estate agents and salespersons<br />
• supervisors of retail and food workers<br />
Emsi’s proprietary database, Workforce Insight, includes the professional profiles of nearly 37,000<br />
people in Montgomery County who are currently employed, recently employed, or seeking<br />
employment. These Montgomery County residents work in a range of jobs from customer service<br />
representatives, retail and sales, to managers, maintenance mechanics, and registered nurses (see<br />
Figure 22, on the next page).<br />
Workforce Insight observations rely heavily on resumes and profiles found within online social<br />
and professional networking sites as well as job hunting sites. These sites tend to reflect a<br />
higher number of people who work in professional or office environments over those who work<br />
in the skilled trades, as well as people who may use such sites professionally, including sales,<br />
account or project managers, and sales or customer services representatives.<br />
According to Emsi’s Job Posting Analytics, there were over 45,000 unique job postings over the<br />
past year. One in four unique job postings were in Montgomery County with most of them in<br />
<strong>Clarksville</strong>, followed closely by Hopkinsville in Christian County. The top posted occupations<br />
were truck drivers, by far. This is a national trend as some of the top trucking companies post<br />
nationwide on a continual basis. The next two posted occupations were registered nurses and,<br />
surprisingly, physicians. Figure 22 provides a trendline of the real-time labor market supply and<br />
demand trends in Montgomery County. The data enable important findings, such as, the most<br />
listed employers, top listed occupations, and compensation data.<br />
The Economy and Job Performance 39
FIGURE 22: Supply and Demand, Montgomery County<br />
WORKFORCE INSIGHT: REAL TIME ONLINE PROFILE DATA<br />
0<br />
200 400 600 800 1,000 1,200<br />
Customer Service Representative<br />
Retail Sales Associate<br />
Sales Manager<br />
Administrative Assistant<br />
Farm Owner<br />
General Manager<br />
<strong>Main</strong>tenance Mechanic<br />
President<br />
Cashier<br />
Registered Nurse<br />
Sales Representative<br />
Office Manager<br />
TOP JOB POSTINGS<br />
37,000 Unique Profiles in<br />
Montgomery County, TN<br />
0<br />
200 400 600 800 1,000 1,200<br />
United States Department of the Army<br />
Austin Peay State University<br />
Montgomery County School System<br />
Convergys Corporation<br />
United States Army<br />
Wal-Mart Stores, Inc.<br />
Murray State University<br />
Gateway Medical Group LLC<br />
Dyncorp<br />
City of <strong>Clarksville</strong><br />
The Trane Company<br />
State of Tennessee<br />
TOP COMPANIES<br />
POSTING JOBS<br />
45,000 Unique Annual Postings<br />
in Montgomery County, TN<br />
JOB POSTING ANALYTICS: REAL TIME DEMAND DATA<br />
0<br />
200 400 600 800 1,000 1,200<br />
Heavy and Tractor-Trailer Truck Drivers<br />
Registered Nurses<br />
Real Estate Sales Agents<br />
First-Line Spvr.s of Retail Sales Workers<br />
Retail Salespersons<br />
First-Line Spvs. of Food Prep. & Serving Workers<br />
Stock Clerks and Order Fillers<br />
Taxi Drivers and Chauffeurs<br />
Customer Service Representatives<br />
Cashiers<br />
Combined Food Preparation Workers<br />
Postsecondary Teachers<br />
TOP JOB POSTINGS<br />
37,000 Unique Profiles in<br />
Montgomery County, TN<br />
0<br />
200 400 600 800 1,000 1,200<br />
Lyft, Inc.<br />
Community Health Systems<br />
Austin Peay State University<br />
Comphealth Associates, Inc<br />
Cmcss<br />
Crye-Leike, Inc<br />
United States Air Force<br />
Lowe’s<br />
Celadon<br />
CRST Int.<br />
Averitt Exp.<br />
Panera<br />
TOP COMPANIES<br />
POSTING JOBS<br />
45,000 Unique Annual Postings<br />
in Montgomery County, TN<br />
40<br />
COMPREHENSIVE LABOR ANALYSIS: CLARKSVILLE-MONTGOMERY COUNTY
COMPENSATION<br />
KEY HIGHLIGHTS<br />
• Average earnings are 23-32% below the national average, depending on regional<br />
geography<br />
• 39,000 workers are available at the average wage of $20.50 per hour<br />
• Typical compensation for production workers in Montgomery County is $16.87<br />
per hour (includes supervisors, management, and workers with experience)<br />
TABLE 10: Wage Comparisons across Geographies<br />
All Industries<br />
Production Occupations<br />
61+62+69+76+78+90 53+53+51+53+49+53<br />
$29.86<br />
$25.22<br />
$26.10<br />
$22.96<br />
$20.45 $20.50<br />
$17.80 $17.82<br />
$16.91<br />
$17.65<br />
$17.81<br />
$16.40<br />
City of<br />
<strong>Clarksville</strong><br />
Montgomery<br />
County<br />
10-county Kentucky Tennessee United<br />
States<br />
The average wage for Montgomery County is $20.50 per hour, 31% below the national average.<br />
At this wage, there are over 39,000 workers available, or 72% of the entire workforce. Like most<br />
occupations, as wages increase, fewer workers are added to each wage increment. Younger, less<br />
experienced workers start at lower wages but see raises more often while more seasoned workers<br />
hit wage ceilings.<br />
FIGURE 23: Workforce Availability by Wage Increment<br />
Workers Added at Each Wage Increment<br />
14,000<br />
12,000<br />
10,000<br />
8,000<br />
6,000<br />
4,000<br />
2,000<br />
0<br />
Source: Emsi, Workforce Insight dataset<br />
$8 $10 $12 $14 $16 $18 $20 $22 $24 $26 $28 $30 $32 $34<br />
Hourly Wage<br />
$21/hr<br />
Access to 39,086 Workers<br />
72% of Total<br />
The Economy and Job Performance 41
According to Emsi profile data, the typical compensation for all occupations ranges from $14.57<br />
per hour to $19.71 per hour. The median compensation was $17.14 per hour and correlates closely<br />
to the median compensation for workers with 9 years of experience (see Figure 24). The typical<br />
compensation for production workers in Montgomery County ranges from $16.87 per hour to<br />
$22.82 per hour. The median compensation is $19.85 per hour, and also correlates most closely<br />
to the median compensation for workers with 9 years of experience (Figure 25).<br />
FIGURE 24: Compensation by Years of Experience, Montgomery County (All Occupations)<br />
Hourly Compensation by Years of Experience<br />
3 Years<br />
$12.68<br />
4 Years<br />
$13.71<br />
5 Years<br />
$14.26<br />
6 Years<br />
$15.24<br />
7 Years<br />
$15.84<br />
8 Years<br />
$16.64<br />
9 Years<br />
$17.14<br />
10 Years<br />
$17.76<br />
11 Years<br />
$18.76<br />
13 Years<br />
$19.80<br />
14 Years<br />
$20.94<br />
15 Years<br />
$21.70<br />
$17.14/hr<br />
$14.57/hr<br />
–15%<br />
Median<br />
Typical Compensation<br />
$19.71/hr<br />
+15%<br />
Source: Emsi, Workforce Insight dataset<br />
FIGURE 25: Compensation by Years of Experience, Montgomery County (Production<br />
Occupations)<br />
Hourly Compensation by Years of Experience<br />
2 Years<br />
$14.88<br />
3 Years<br />
$15.47<br />
4 Years<br />
$16.51<br />
5 Years<br />
$17.02<br />
6 Years<br />
$17.80<br />
7 Years<br />
$18.58<br />
8 Years<br />
$19.34<br />
9 Years<br />
$19.85<br />
11 Years<br />
$20.64<br />
12 Years<br />
$21.32<br />
13 Years<br />
$22.32<br />
15 Years<br />
$22.70<br />
16 Years<br />
$23.73<br />
19 Years<br />
$24.77<br />
$19.85/hr<br />
$16.87/hr<br />
$22.82/hr<br />
–15%<br />
Median<br />
Typical Compensation<br />
+15%<br />
42<br />
COMPREHENSIVE LABOR ANALYSIS: CLARKSVILLE-MONTGOMERY COUNTY
STAKEHOLDER THEMES<br />
• 50% of respondents to the survey indicated intention to add to the workforce over the next 2<br />
years. This feedback supports the data projections for continued strong industry growth and<br />
positive pressure on the labor market.<br />
• <strong>Clarksville</strong>, and the surrounding Tennessee/Kentucky area, had a July 2017 unemployment rate<br />
of 5.45%, decreasing from 8.10% five years before. Currently, the average wage in Montgomery<br />
County is significantly below the national average. While a strong labor market should<br />
push wages higher as companies compete for talent, much of this average is made up by<br />
a disproportionate number of low skilled food, retail, and distribution workers. Focus group<br />
manufacturing representatives indicated that wages range from $11/hour to $15/hour to start.<br />
However, particularly in larger companies, wages scale up rapidly the first few years. In one<br />
example, new employees start at slightly more than $13/hour, but see their wages grow to<br />
nearly $18/hour after two years.<br />
• When asked to rank economic development priorities, the top 5 ranking items, in order, were:<br />
infrastructure investment, size of the workforce, quality of the roads, funding for workforce<br />
development and training, and workforce training and availability.<br />
• Certain stakeholders sense differences between how the City and County want to move forward<br />
with respect to <strong>Clarksville</strong>’s development. One benefit of studying the labor force and the<br />
economy is that the data can provide a platform from which to make decisions. However, the<br />
effort should be made to align and prioritize values so that all stakeholders can move forward<br />
in lock step. Rapid growth is occurring in <strong>Clarksville</strong>; the quality and nature of this growth will<br />
depend on the community’s ability to quickly make and implement strategic decisions.<br />
• Some survey respondents and focus group participants identified the need for quality of life<br />
amenities to attract and keep a professional workforce in the area. Currently a low supply of<br />
middle skill and professional jobs exists. This indicates the need for diversification. If <strong>Clarksville</strong><br />
can attract or grow businesses that require higher skilled talent, that talent can create a selfsustaining<br />
cycle of spending for amenities and education for long-term economic sustainability.<br />
The Economy and Job Performance 43
MILITARY<br />
Fort Campbell straddles both Montgomery County, TN and Christian County,<br />
KY. The base is a vital part of the region. The impact military personnel and<br />
their families have on the 10-county region is substantial—both during and<br />
after their transition out of the military, for those who choose to stay in the<br />
area.<br />
KEY HIGHLIGHTS<br />
• 400 military exits each month<br />
• 63,200 veterans living in 10-county region<br />
• 14% of total expenditures spent on behalf of veterans are for education, vocational<br />
rehabilitation, and employment programs<br />
Top Civilian Occupations:<br />
• Managers, truck drivers, technicians, and mechanics<br />
On average, approximately 400 personnel<br />
separate from service from Fort Campbell<br />
each month (Fort Campbell Strong Economic<br />
Growth Plan 2016). According to the same study,<br />
2,442 personnel were scheduled to separate<br />
from service in 2016. This is a large labor pool<br />
the region has been struggling to capitalize on.<br />
The 10-county region is home to over 63,000<br />
veterans in 2017, and Montgomery County<br />
retains nearly 36,000 of that total (U.S. Department<br />
of Veterans Affairs) while Christian County<br />
has nearly 9,300 veterans. Almost 60% of the<br />
military employment in Kentucky is located at<br />
Fort Campbell. The U.S. Department of Veterans<br />
Affairs projects the growth in veteran<br />
population to slow over the next decade, from<br />
approximately 3% annually to 1.5%.<br />
TABLE 11: Veteran Population by County, 2017<br />
Montgomery, TN 34,900<br />
Christian, KY 9,300<br />
Robertson, TN 5,200<br />
Dickson, TN 4,000<br />
Cheatham, TN 3,100<br />
Logan, KY 1,800<br />
Stewart, TN 1,800<br />
Trigg, KY 1,500<br />
Todd, KY 900<br />
Houston, TN 700<br />
10-county Region 63,200<br />
44<br />
COMPREHENSIVE LABOR ANALYSIS: CLARKSVILLE-MONTGOMERY COUNTY
The May 2017 Soldier For Life Survey, (administered and compiled by) Fort Campbell Soldier For<br />
Life-Transition Assistance Program, extracted the following characteristics of exiting military:<br />
• 20% plan on staying in the area<br />
• 47% would stay in the area if there were desirable employment in the area<br />
• 41% have high school/GED as highest level of education<br />
• 90% male<br />
• 65% in the lowest pay grades—making about $21/hour including benefits<br />
• 65% are ages 18–28<br />
• 70% leave voluntarily; 15% who retire; 15% separate for a variety of other reasons<br />
• 90% have been planning their exit for 4-20 months<br />
• 40% have been in the military for 4 years; 30% have been in the military for 5-8 years<br />
• 55% are married<br />
• One-third have children living at home<br />
• One-fourth have completed career skills training<br />
• 35% stay in the area. Of those 35%, half stay because of job opportunities<br />
MILITARY SKILLS IN THE CIVILIAN LABOR FORCE<br />
Figure 26 shows the distribution of skills among those separating from service. Roughly 90%<br />
of all exiting military from Fort Campbell are enlisted, compared to 8% Commissioned, and 3%<br />
Warrant. The analysis provided in this section reflects only those enlisted occupations most likely<br />
to match with civilian occupations.<br />
FIGURE 26: Distribution of Skills of Exiting Military<br />
Infantry<br />
Supply & Services<br />
Aviation<br />
<strong>Main</strong>tenance<br />
Logistics<br />
Medical<br />
Field Artillery<br />
Signal/<br />
Communication<br />
Corps of Engineers<br />
Military Police<br />
Administrative<br />
Electronics/Missile<br />
maintenance<br />
Chemical<br />
Armor<br />
Intelligence<br />
Air Defense Artillery<br />
Other<br />
0% 10% 20% 30% 40% 50% 60% 70% 80% 90% 100%<br />
Source: 2016 Post-Military Service Intent survey<br />
The following analysis was conducted to understand what occupations are most comparable<br />
for exiting military using the 16 main military categories according to the 2016 Post-Military<br />
Service Intent survey. No federal or military guidance exists to assist with the military to civilian<br />
occupation crosswalk process. First, there are no Military Occupation Classification (MOC).<br />
Codes that correspond to military occupation specialties. O*NET OnLine provides a collection of<br />
military occupation codes to the nearest Standard Occupational Classification (SOC) code from<br />
each military branch; however, definitions and descriptions are unavailable. Therefore, Emsi has<br />
Military 45
created a more comprehensive MOC to SOC crosswalk by adding supplemental mappings from<br />
Veterans Opportunity to Work (VOW) and Credentialing Opportunities On-Line (COOL). These<br />
sources are made to help veterans transition into civilian jobs and, therefore, include more realistic<br />
skill level requirements. The Emsi data focuses on correlating the work experience provided by<br />
military occupations with skills that civilian jobs require. The data analyzed are only for Army<br />
Enlisted occupations, which captures most of the survey respondents and their accompanying<br />
military occupations.<br />
Table 12 provides a snapshot of the civilian occupations most comparable to exiting military<br />
experience within each of the 16 major military occupation categories. Shown are only those<br />
occupations that are abundant in the regional labor market and the typical entry level of education<br />
requirements are below an associate’s degree. See Appendix IV for a more comprehensive list of<br />
comparable occupations for each military category.<br />
Overwhelmingly, employers discuss the disconnect between expectations of exiting military and<br />
business. Part of the problem is wage expectations while the other is expectations exiting military<br />
personnel have for peers in the workplace, as further discussed later in this section.<br />
Results from the 2016 Post-Military Service Intent survey indicate that many of the respondents<br />
have little to no higher education so those occupations that cross over into civilian jobs may require<br />
exiting military to pursue additional training or education—particularly for management positions.<br />
Provided that 36% of survey respondents said that higher education offerings would most likely<br />
affect their decision to remain in the region, this is critical in understanding the opportunities for<br />
exiting military and higher education offerings around the region.<br />
The Fort Campbell Strong Defense Alliance could help alleviate these challenges as the nonprofit’s<br />
mission is to support the overall health of the region’s military and defense sector through<br />
economic and development activities. The Pennyrile Area Development District received nearly<br />
$1.7 million for economic development efforts around Fort Campbell. The funds have paid for<br />
advanced manufacturing training equipment and programs at higher education institutions.<br />
Key Takeaways<br />
The most frequent populated civilian occupations that match military experience, require<br />
some college or above (for education and training purposes), and pay above $15 per hour. The<br />
occupations shown here are also included in Table 12 below.<br />
• General and Operations Managers<br />
• Managers, All Other<br />
• Heavy and Tractor-Trailer Truck Drivers<br />
• Automotive Service Technicians and Mechanics<br />
• Business Operations Specialists<br />
• Construction Managers<br />
• Telecommunications Equipment Installers & Repairers<br />
• Management Analysts<br />
• Training and Development Specialists<br />
• Registered Nurses<br />
• Licensed Practical and Licensed Vocational Nurses<br />
• Medical Assistants<br />
• Dental Assistants<br />
• Emergency Medical Technicians and Paramedics<br />
46<br />
COMPREHENSIVE LABOR ANALYSIS: CLARKSVILLE-MONTGOMERY COUNTY
TABLE 12: MOC to SOC Crosswalk for Exiting Fort Campbell Veterans<br />
MOC<br />
SOC<br />
CODE SOC TITLE JOBS<br />
ANNUAL<br />
OPENINGS<br />
MEDIAN<br />
HOURLY<br />
EARNINGS<br />
TYPICAL ENTRY<br />
LEVEL EDUCATION<br />
INFANTRY<br />
49-9071<br />
<strong>Main</strong>tenance and Repair Workers,<br />
General<br />
1,824 197 $17.60<br />
High school diploma<br />
or equivalent<br />
43-1011<br />
First-Line Supervisors of Office and<br />
Administrative Support Workers<br />
1,615 187 $21.50<br />
High school diploma<br />
or equivalent<br />
47-2061 Construction Laborers 1,557 185 $12.68<br />
No formal<br />
educational<br />
credential<br />
51-1011<br />
First-Line Supervisors of Production<br />
and Operating Workers<br />
1,434 155 $24.88<br />
High school diploma<br />
or equivalent<br />
49-3023<br />
Automotive Service Technicians and<br />
Mechanics<br />
989 101 $15.52 Postsecondary<br />
nondegree award<br />
33-3051 Police and Sheriff’s Patrol Officers 767 68 $19.45<br />
High school diploma<br />
or equivalent<br />
AVIATION<br />
49-1011<br />
First-Line Supervisors of Mechanics,<br />
Installers, and Repairers<br />
540 54 $25.65<br />
High school diploma<br />
or equivalent<br />
53-1031<br />
First-Line Supervisors of<br />
Transportation and Material-Moving<br />
Machine and Vehicle Operators<br />
221 27 $24.34<br />
High school diploma<br />
or equivalent<br />
43-5032<br />
Dispatchers, Except Police, Fire, and<br />
Ambulance<br />
189 20 $13.15<br />
High school diploma<br />
or equivalent<br />
11-3071 Logistics Managers 183 17 $32.89<br />
High school diploma<br />
or equivalent<br />
49-3011<br />
MAINTENANCE<br />
Aircraft Mechanics and Service<br />
Technicians<br />
103 8 $36.36 Postsecondary<br />
nondegree award<br />
49-9071<br />
<strong>Main</strong>tenance and Repair Workers,<br />
General<br />
1,824 197 $17.60<br />
High school diploma<br />
or equivalent<br />
51-1011<br />
First-Line Supervisors of Production<br />
and Operating Workers<br />
1,434 155 $24.88<br />
High school diploma<br />
or equivalent<br />
49-3023<br />
Automotive Service Technicians and<br />
Mechanics<br />
989 101 $15.52 Postsecondary<br />
nondegree award<br />
49-9041 Industrial Machinery Mechanics 716 81 $22.73<br />
High school diploma<br />
or equivalent<br />
47-1011<br />
First-Line Supervisors of Construction<br />
Trades and Extraction Workers<br />
647 69 $20.54<br />
High school diploma<br />
or equivalent<br />
47-2141<br />
Painters, Construction and<br />
<strong>Main</strong>tenance<br />
543 47 $12.89<br />
No formal<br />
educational<br />
credential<br />
49-1011<br />
First-Line Supervisors of Mechanics,<br />
Installers, and Repairers<br />
540 54 $25.65<br />
High school diploma<br />
or equivalent<br />
LOGISTICS<br />
53-7062<br />
Laborers and Freight, Stock, and<br />
Material Movers, Hand<br />
3,860 642 $11.76<br />
No formal<br />
educational<br />
credential<br />
Military 47
MOC<br />
SOC<br />
CODE SOC TITLE JOBS<br />
ANNUAL<br />
OPENINGS<br />
MEDIAN<br />
HOURLY<br />
EARNINGS<br />
TYPICAL ENTRY<br />
LEVEL EDUCATION<br />
43-5081<br />
Stock Clerks / Marking Clerks<br />
(Warehouse, Storage Yard, Sales Floor)<br />
2,797 424 $10.92<br />
No formal<br />
educational<br />
credential<br />
43-1011<br />
First-Line Supervisors of Office and<br />
Administrative Support Workers<br />
1,615 187 $21.50<br />
High school diploma<br />
or equivalent<br />
53-7064 Packers and Packagers, Hand 1,085 196 $10.33<br />
43-5071 Shipping, Receiving, and Traffic Clerks 749 95 $13.97<br />
No formal<br />
educational<br />
credential<br />
High school diploma<br />
or equivalent<br />
43-5061<br />
Production, Planning, and Expediting<br />
Clerks<br />
408 46 $21.31<br />
High school diploma<br />
or equivalent<br />
53-1021<br />
First-Line Supervisors of Helpers,<br />
Laborers, and Material Movers, Hand<br />
321 43 $20.56<br />
High school diploma<br />
or equivalent<br />
FIELD ARTILLERY<br />
49-9071<br />
<strong>Main</strong>tenance and Repair Workers,<br />
General<br />
1,824 197 $17.60<br />
High school diploma<br />
or equivalent<br />
49-1011<br />
First-Line Supervisors of Mechanics,<br />
Installers, and Repairers<br />
540 54 $25.65<br />
High school diploma<br />
or equivalent<br />
47-2073<br />
Operating Engineers and Other<br />
Construction Equipment Operators<br />
423 51 $16.20<br />
High school diploma<br />
or equivalent<br />
49-9099<br />
Installation, <strong>Main</strong>tenance, and Repair<br />
Workers, All Other<br />
335 36 $14.29<br />
High school diploma<br />
or equivalent<br />
49-2022<br />
Telecommunications Equipment<br />
Installers and Repairers, Except Line<br />
Installers<br />
307 31 $22.02 Postsecondary<br />
nondegree award<br />
49-3031<br />
Bus and Truck Mechanics and Diesel<br />
Engine Specialists<br />
243 28 $18.75<br />
High school diploma<br />
or equivalent<br />
MEDICAL<br />
29-2061<br />
Licensed Practical and Licensed<br />
Vocational Nurses<br />
1,314 101 $18.03 Postsecondary<br />
nondegree award<br />
29-2052 Pharmacy Technicians 692 58 $13.26<br />
35-2012 Cooks, Institution and Cafeteria 589 88 $10.24<br />
High school diploma<br />
or equivalent<br />
No formal<br />
educational<br />
credential<br />
31-9092 Medical Assistants 562 83 $13.36 Postsecondary<br />
nondegree award<br />
31-9091 Dental Assistants 444 59 $16.78 Postsecondary<br />
nondegree award<br />
43-6013 Medical Secretaries 317 46 $13.07<br />
High school diploma<br />
or equivalent<br />
29-2041<br />
29-2071<br />
Emergency Medical Technicians and<br />
Paramedics<br />
Medical Records and Health<br />
Information Technicians<br />
272 17 $13.75 Postsecondary<br />
nondegree award<br />
266 18 $15.01 Postsecondary<br />
nondegree award<br />
ADMINISTRATIVE<br />
43-6014<br />
Secretaries and Administrative<br />
Assistants, Except Legal, Medical, and<br />
Executive<br />
2,874 320 $13.75<br />
High school diploma<br />
or equivalent<br />
48<br />
COMPREHENSIVE LABOR ANALYSIS: CLARKSVILLE-MONTGOMERY COUNTY
MOC<br />
SOC<br />
CODE SOC TITLE JOBS<br />
ANNUAL<br />
OPENINGS<br />
MEDIAN<br />
HOURLY<br />
EARNINGS<br />
TYPICAL ENTRY<br />
LEVEL EDUCATION<br />
43-9061 Office Clerks, General 2,307 301 $13.79<br />
High school diploma<br />
or equivalent<br />
43-1011<br />
First-Line Supervisors of Office and<br />
Administrative Support Workers<br />
1,615 187 $21.50<br />
High school diploma<br />
or equivalent<br />
43-6011<br />
Executive Secretaries and Executive<br />
Administrative Assistants<br />
357 42 $19.90<br />
High school diploma<br />
or equivalent<br />
43-3051 Payroll and Timekeeping Clerks 184 19 $18.00<br />
High school diploma<br />
or equivalent<br />
SUPPLY AND SERVICES<br />
53-7062<br />
Laborers and Freight, Stock, and<br />
Material Movers, Hand<br />
3,860 642 $11.76<br />
No formal<br />
educational<br />
credential<br />
43-5081<br />
Stock Clerks- Stockroom, Warehouse,<br />
Storage Yard, Sales Floor<br />
2,797 424 $10.92<br />
No formal<br />
educational<br />
credential<br />
53-3032 Heavy and Tractor-Trailer Truck Drivers 2,271 273 $17.38 Postsecondary<br />
nondegree award<br />
43-3031<br />
Bookkeeping, Accounting, and<br />
Auditing Clerks<br />
1,576 178 $16.48<br />
Some college, no<br />
degree<br />
51-1011<br />
First-Line Supervisors of Production<br />
and Operating Workers<br />
1,434 155 $24.88<br />
High school diploma<br />
or equivalent<br />
53-7064 Packers and Packagers, Hand 1,085 196 $10.33<br />
43-5071 Shipping, Receiving, and Traffic Clerks 749 95 $13.97<br />
No formal<br />
educational<br />
credential<br />
High school diploma<br />
or equivalent<br />
SIGNAL/COMMUNICATION<br />
43-1011<br />
First-Line Supervisors of Office and<br />
Administrative Support Workers<br />
1,615 187 $21.50<br />
High school diploma<br />
or equivalent<br />
49-1011<br />
First-Line Supervisors of Mechanics,<br />
Installers, and Repairers<br />
540 54 $25.65<br />
High school diploma<br />
or equivalent<br />
49-2022<br />
Telecommunications Equipment<br />
Installers and Repairers, Except Line<br />
Installers<br />
307 31 $22.02 Postsecondary<br />
nondegree award<br />
33-1012<br />
First-Line Supervisors of Police and<br />
Detectives<br />
224 18 $21.98<br />
High school diploma<br />
or equivalent<br />
49-9098<br />
Helpers--Installation, <strong>Main</strong>tenance,<br />
and Repair Workers<br />
157 21 $13.50<br />
High school diploma<br />
or equivalent<br />
17-3023 Electronics Engineering Technicians 154 12 $25.04 Associate’s degree<br />
CORPS OF ENGINEERS<br />
53-3032 Heavy and Tractor-Trailer Truck Drivers 2,271 273 $17.38 Postsecondary<br />
nondegree award<br />
47-2061 Construction Laborers 1,557 185 $12.68<br />
53-7051 Industrial Truck and Tractor Operators 1,088 154 $14.73<br />
No formal<br />
educational<br />
credential<br />
No formal<br />
educational<br />
credential<br />
47-1011<br />
First-Line Supervisors of Construction<br />
Trades and Extraction Workers<br />
647 69 $20.54<br />
High school diploma<br />
or equivalent<br />
Military 49
MOC<br />
SOC<br />
CODE SOC TITLE JOBS<br />
ANNUAL<br />
OPENINGS<br />
MEDIAN<br />
HOURLY<br />
EARNINGS<br />
TYPICAL ENTRY<br />
LEVEL EDUCATION<br />
47-2073<br />
Operating Engineers and Other<br />
Construction Equipment Operators<br />
423 51 $16.20<br />
High school diploma<br />
or equivalent<br />
53-1031<br />
First-Line Supervisors of<br />
Transportation and Material-Moving<br />
Machine and Vehicle Operators<br />
221 27 $24.34<br />
High school diploma<br />
or equivalent<br />
47-4011 Construction and Building Inspectors 134 14 $22.49<br />
47-4051 Highway <strong>Main</strong>tenance Workers 81 11 $13.76<br />
High school diploma<br />
or equivalent<br />
High school diploma<br />
or equivalent<br />
MILITARY POLICE<br />
33-3051<br />
Police and Sheriffs Patrol Officers and<br />
Deputy Sheriffs<br />
767 68 $19.45<br />
High school diploma<br />
or equivalent<br />
33-3012 Correctional Officers and Jailers 410 45 $13.42<br />
33-9032 Security Guards 309 46 $14.23<br />
High school diploma<br />
or equivalent<br />
High school diploma<br />
or equivalent<br />
33-1012<br />
First-Line Supervisors of Police and<br />
Detectives<br />
224 18 $21.98<br />
High school diploma<br />
or equivalent<br />
43-4111<br />
Interviewers, Except Eligibility and<br />
Loan<br />
200 23 $14.00<br />
High school diploma<br />
or equivalent<br />
33-9099<br />
Protective Service Workers, All Others;<br />
Retail Loss Prevention Specialists<br />
183 45 $13.32<br />
High school diploma<br />
or equivalent<br />
ELECTRONICS/MISSILE MAINTENANCE<br />
51-9061<br />
Inspectors, Testers, Sorters, Samplers,<br />
and Weighers<br />
968 131 $15.94<br />
High school diploma<br />
or equivalent<br />
47-2111 Electricians 795 91 $18.23<br />
High school diploma<br />
or equivalent<br />
49-1011<br />
First-Line Supervisors of Mechanics,<br />
Installers, and Repairers<br />
540 54 $25.65<br />
High school diploma<br />
or equivalent<br />
49-2022<br />
Telecommunications Equipment<br />
Installers and Repairers, Except Line<br />
Installers<br />
307 31 $22.02 Postsecondary<br />
nondegree award<br />
51-2022<br />
Electrical and Electronic Equipment<br />
Assemblers<br />
199 23 $14.43<br />
High school diploma<br />
or equivalent<br />
49-9098<br />
Helpers--Installation, <strong>Main</strong>tenance,<br />
and Repair Workers<br />
157 21 $13.50<br />
High school diploma<br />
or equivalent<br />
17-3023<br />
CHEMICAL<br />
Electrical and Electronics Engineering<br />
Technicians<br />
154 12 $25.04 Associate’s degree<br />
49-9071<br />
<strong>Main</strong>tenance and Repair Workers,<br />
General<br />
1,824 197 $17.60<br />
High school diploma<br />
or equivalent<br />
49-9041 Industrial Machinery Mechanics 716 81 $22.73<br />
High school diploma<br />
or equivalent<br />
49-1011<br />
First-Line Supervisors of Mechanics,<br />
Installers, and Repairers<br />
540 54 $25.65<br />
High school diploma<br />
or equivalent<br />
49-9021<br />
Heating and Air Conditioning<br />
Mechanics and Installers<br />
505 52 $17.48 Postsecondary<br />
nondegree award<br />
33-2011 Municipal Firefighters 332 29 $17.70 Postsecondary<br />
nondegree award<br />
50<br />
COMPREHENSIVE LABOR ANALYSIS: CLARKSVILLE-MONTGOMERY COUNTY
MOC<br />
SOC<br />
CODE SOC TITLE JOBS<br />
ANNUAL<br />
OPENINGS<br />
MEDIAN<br />
HOURLY<br />
EARNINGS<br />
TYPICAL ENTRY<br />
LEVEL EDUCATION<br />
51-8031<br />
Water and Wastewater Treatment<br />
Plant and System Operators<br />
230 23 $17.99<br />
High school diploma<br />
or equivalent<br />
ARMOR<br />
47-2061 Construction Laborers 1,557 185 $12.68<br />
33-3012 Correctional Officers and Jailers 410 45 $13.42<br />
33-9032 Security Guards 309 46 $14.23<br />
49-9043 <strong>Main</strong>tenance Workers, Machinery 251 32 $26.15<br />
No formal<br />
educational<br />
credential<br />
High school diploma<br />
or equivalent<br />
High school diploma<br />
or equivalent<br />
High school diploma<br />
or equivalent<br />
33-1012<br />
First-Line Supervisors of Police and<br />
Detectives<br />
224 18 $21.98<br />
High school diploma<br />
or equivalent<br />
11-3071<br />
Transportation, Storage and<br />
Distribution Managers<br />
183 17 $32.89<br />
High school diploma<br />
or equivalent<br />
INTELLIGENCE<br />
49-1011<br />
First-Line Supervisors of Mechanics,<br />
Installers, and Repairers<br />
540 54 $25.65<br />
High school diploma<br />
or equivalent<br />
43-6011<br />
Executive Secretaries and Executive<br />
Administrative Assistants<br />
357 42 $19.90<br />
High school diploma<br />
or equivalent<br />
49-2022<br />
Telecommunications Equipment<br />
Installers and Repairers, Except Line<br />
Installers<br />
307 31 $22.02 Postsecondary<br />
nondegree award<br />
33-1012<br />
First-Line Supervisors of Police and<br />
Detectives<br />
224 18 $21.98<br />
High school diploma<br />
or equivalent<br />
43-4111<br />
Interviewers, Except Eligibility and<br />
Loan<br />
200 23 $14.00<br />
High school diploma<br />
or equivalent<br />
43-4061<br />
Eligibility Interviewers, Government<br />
Programs<br />
137 15 $18.11<br />
High school diploma<br />
or equivalent<br />
AIR DEFENSE ARTILLERY<br />
47-2061 Construction Laborers 1,557 185 $12.68<br />
33-3012 Correctional Officers and Jailers 410 45 $13.42<br />
33-9032 Security Guards 309 46 $14.23<br />
49-9043 <strong>Main</strong>tenance Workers, Machinery 251 32 $26.15<br />
No formal<br />
educational<br />
credential<br />
High school diploma<br />
or equivalent<br />
High school diploma<br />
or equivalent<br />
High school diploma<br />
or equivalent<br />
33-1012<br />
First-Line Supervisors of Police and<br />
Detectives<br />
224 18 $21.98<br />
High school diploma<br />
or equivalent<br />
11-3071<br />
Transportation, Storage and<br />
Distribution Managers<br />
183 17 $32.89<br />
High school diploma<br />
or equivalent<br />
* the crosswalk refers to only those classified as Army “Enlisted” and non-officers<br />
Source: Emsi<br />
Military 51
STAKEHOLDER THEMES<br />
• The potential influx into the labor force from this segment remains strong with 400 exits per<br />
month. Currently, <strong>Clarksville</strong>-Montgomery County captures 20-30% of those exits, although<br />
about half of exiting military say they would stay in the area if they could find suitable employment.<br />
• Data show a skills mismatch that could be overcome through programmed training. Most<br />
employers within the focus groups mentioned how much they desire to hire those with military<br />
backgrounds due to their discipline and work ethic. However, a wage mismatch exists between<br />
what these employers tend to offer ($11-12/hour) for separated military personnel who do not<br />
have a bachelor’s degree versus desired rates of those exiting the military ($15-$17/hour). At<br />
$12 per hour, the available workforce for the top 10 occupations employed by manufacturing<br />
industries is 457 people. If more military could receive bachelor degree equivalents while<br />
transitioning, their options would increase. The jobs that are available for $17/hour with<br />
experience include the following:<br />
SOC<br />
DESCRIPTION<br />
2017<br />
JOBS<br />
WORK<br />
EXPERIENCE<br />
REQUIRED<br />
TYPICAL<br />
ENTRY LEVEL<br />
EDUCATION<br />
PCT. 10<br />
HOURLY<br />
EARNINGS<br />
PCT. 25<br />
HOURLY<br />
EARNINGS<br />
ANNUAL<br />
OPENINGS<br />
11-9039 Education<br />
Administrators, All Other<br />
392<br />
Less than 5<br />
years<br />
Bachelor's<br />
degree<br />
$ 21.38 $ 28.04 30<br />
29-1141 Registered Nurses 747 None<br />
Bachelor's<br />
degree<br />
$ 20.42 $ 23.27 38<br />
25-2021<br />
Elementary School<br />
Teachers, Except<br />
Special Education<br />
886 None<br />
Bachelor's<br />
degree<br />
$ 20.36 $ 24.98 63<br />
51-1011<br />
First-Line Supervisors<br />
of Production and<br />
Operating Workers<br />
458<br />
Less than 5<br />
years<br />
High school<br />
diploma or<br />
equivalent<br />
$ 16.86 $ 20.45 49<br />
25-1099 Postsecondary Teachers 580 None<br />
Doctoral or<br />
professional<br />
degree<br />
$ 16.23 $ 22.00 46<br />
51-4122<br />
Welding, Soldering,<br />
and Brazing Machine<br />
Setters, Operators, and<br />
Tenders<br />
373 None<br />
High school<br />
diploma or<br />
equivalent<br />
$ 15.72 $ 17.90 40<br />
29-2061<br />
Licensed Practical and<br />
Licensed Vocational<br />
Nurses<br />
504 None<br />
Postsecondary<br />
nondegree<br />
award<br />
$ 15.63 $ 17.38 36<br />
11-1021<br />
General and Operations<br />
Managers<br />
614<br />
5 years or<br />
more<br />
Bachelor's<br />
degree<br />
$ 14.28 $ 22.61 54<br />
• Accessing exiting military talent is especially difficult for employers who use temporary<br />
agencies.<br />
52<br />
COMPREHENSIVE LABOR ANALYSIS: CLARKSVILLE-MONTGOMERY COUNTY
• Military spouses most likely make up a sizeable chunk of the non-participating labor force. In<br />
the most recent spouse survey conducted by the Fort Campbell base, 33% of military spouses<br />
claimed to be working, but 59% of those were unhappy with their jobs. Of those working, 42%<br />
stated that their skillset did not match their job while 58% said it did.<br />
• Entrepreneurs who have successfully engaged military spouses maintain that this segment does<br />
not necessarily need to work, but seeks meaningful work that enables them to participate in<br />
the community. It was also noted that because of schools, cost of living, and weather, families<br />
tend to stay in <strong>Clarksville</strong> even if their military spouses are relocated. While this information is<br />
anecdotal, it is worthy of being explored and applied to raise the awareness of this symbiotic<br />
relationship between military spouses and the employers/City of <strong>Clarksville</strong>.<br />
Military 53
EDUCATION & TRAINING<br />
DEMAND<br />
KEY HIGHLIGHTS<br />
4,700 people completed regional higher education programs in 2016<br />
Collaborative partnerships:<br />
• HCC/APSU expand KY FAME program to incorporate articulation to APSU<br />
• APSU/TCAT/CMCSS expand Siemens-certified Mechatronics program (AAS<br />
and BS)<br />
• Fort Campbell Strong Defense Alliance<br />
Potential Education and Training Opportunities<br />
• Shortage of regional education completions:<br />
··<br />
Teachers<br />
··<br />
Truck drivers<br />
··<br />
Automotive technicians and mechanics<br />
• Oversaturated programs for:<br />
··<br />
Coaches<br />
··<br />
Medical Assistants<br />
··<br />
Skin care specialists<br />
54<br />
COMPREHENSIVE LABOR ANALYSIS: CLARKSVILLE-MONTGOMERY COUNTY
FIGURE 27: Higher Education Institutions, 10-county Region<br />
There are nine higher education institutions in the 10-county region. Austin Peay State University<br />
(APSU) comprises nearly half the region’s completions. Of the 2,200 degrees awarded in 2016 at<br />
APSU, roughly 70% were bachelor’s degrees and 14% in associate’s and master’s degrees each.<br />
Over 1,300 students completed programs at Hopkinsville Community College (HCC) during the<br />
same year (see Table 13).<br />
TABLE 13: Completions by Institution, 10-county Region<br />
INSTITUTION 2012 2016<br />
Austin Peay State University 1,892 2,201<br />
Hopkinsville Community College 1,305 1,272<br />
Tennessee College of Applied Technology 344 305<br />
Miller-Motte Technical College 231 303<br />
Daymar College 232 224<br />
North Central Institute 328 215<br />
Brown Mackie College (Ross College) 129 76<br />
Queen City College 104 72<br />
Buchanan Beauty College — 11<br />
4,565 4,679<br />
The graph on the next page illustrates the gap in regional education completions and annual<br />
average openings for the top growing occupations that have a median hourly pay of above $15<br />
per hour and typical entry level of education requiring some college or above. Green numbers<br />
illustrate more annual job openings than there are people completing educational programs for<br />
that type of job (a gap in workers). Red numbers indicate that there are more people completing<br />
programs than there are job openings (a surplus of workers).<br />
Education & Training Demand 55
FIGURE 28: Education Gap by Top Occupations Requiring Some College and Above (>$15/hr),<br />
10-county Region (gaps and surpluses are the difference between openings and completions)<br />
Surplus/Avg. Annual Openings (2011–2016)<br />
Regional Completions (2016)/Gap<br />
General and Operations Managers<br />
–131<br />
184<br />
315<br />
Managers, All Other<br />
–230<br />
115<br />
345<br />
Business Operations Specialists, All Other<br />
87<br />
87<br />
Accountants and Auditors<br />
71<br />
66<br />
5<br />
Education Administrators, All Other<br />
47<br />
37<br />
10<br />
Elementary School Teachers, Except Special Education<br />
220<br />
111<br />
109<br />
Middle School Teachers, Except Special & Career/Tech. Ed.<br />
66<br />
4<br />
62<br />
Secondary School Teachers, Except Special & Career/Tech. Ed.<br />
–34<br />
89<br />
123<br />
Teachers and Instructors, All Other<br />
222<br />
204<br />
18<br />
Registered Nurses<br />
–54<br />
183<br />
237<br />
Licenses Practical and Licensed Vocational Nurses<br />
–191<br />
115<br />
306<br />
Dental Assistants<br />
63<br />
16<br />
47<br />
Automotive Service Technicians and Mechanics<br />
126<br />
97<br />
29<br />
Heavy and Tractor-Trailer Truck Drivers<br />
312<br />
185<br />
127<br />
Source: Emsi Dataset 2017.3<br />
Similar to the graph above, the graph below illustrates the gap in regional education completions<br />
and annual average openings for those occupations that have a median pay between $11 and<br />
$15 per hour and typical entry level of education that requires some college or above. Positive<br />
numbers in green represent the gaps while negative numbers indicate surplus of graduates over<br />
number of annual average job openings available within the 10-county region.<br />
FIGURE 29: Education Gap by Top Occupations (between $11-$15/hr), 10-county Region (gaps<br />
and surpluses are the difference between openings and completions)<br />
Surplus/Avg. Annual Openings (2011–2016)<br />
Regional Completions (2016)/Gap<br />
Education Administr., Preschool & Childcare Center/Program<br />
Library Technicians<br />
Teacher Assistants<br />
Coaches and Scouts<br />
–5 5 10<br />
16 16<br />
173 173<br />
–181<br />
41<br />
222<br />
Emergency Medical Technicians & Paramedics<br />
Dietetic Technicians<br />
Nursing Assistants<br />
Medical Assistants<br />
Medical Transcriptionists<br />
Phlebotomists<br />
Veterinary Technologists and Technicians<br />
Barbers<br />
Hairdressers, Hairstylists, and Cosmetologists<br />
Skincare Specialists<br />
Source: Emsi Dataset 2017.3<br />
–153<br />
276<br />
17 7 10<br />
–4 3<br />
83<br />
–17 16<br />
9<br />
7<br />
31 245<br />
7 2<br />
11 11<br />
11 7 4<br />
33<br />
236<br />
134 115 19<br />
–140 8 148<br />
56<br />
COMPREHENSIVE LABOR ANALYSIS: CLARKSVILLE-MONTGOMERY COUNTY
MEETING THE NEEDS OF INDUSTRY<br />
Some occupations show the oversaturation in the regional market—meaning institutions should<br />
not focus so heavily on these occupations.<br />
The previous section analyzed which military occupations translated into civilian employment.<br />
The resulting civilian occupations that are also mentioned above are included in Table 14, on the<br />
next page. While some have a surplus of completions each year, on average, exiting military with<br />
experience and reasonable expectations have a good chance at these more competitive jobs.<br />
There have been great strides with involvement from education institutions and trying to meet<br />
the needs of industry. APSU’s Engineering Technology Department has a history of graduating<br />
individuals to help meet the manufacturing needs for the region. HCC and APSU have partnered<br />
to expand the Kentucky Federation for Advanced Manufacturing Education (FAME) program. This<br />
apprenticeship-style program addresses a need for more technically skilled workers in advanced<br />
manufacturing, while also providing an avenue to high-wage/high-demand careers for military<br />
veterans and other residents. This provides students a work-and-learn format and offers articulation<br />
to APSU higher degree programs.<br />
Tennessee College of Applied Technology (TCAT) has an established mechatronics program<br />
and has recently partnered with APSU and the <strong>Clarksville</strong>-Montgomery County School System<br />
(CMCSS) to include on-campus learning experiences to provide mechatronics certificates to<br />
entry level freshmen continuing on to earn an associate’s or bachelor’s degree.<br />
The dialogue must continue to flow between industry and education and more frequently. APSU,<br />
HCC, TCAT, and other regional higher education institutions must continue to work with high<br />
schools and employers to ensure alignment between employer needs and educational program<br />
development. Although <strong>Clarksville</strong>-Montgomery County School System have improved in all<br />
state metrics over the past several years, employers are still saying that entry level applicants are<br />
lacking in math skills.<br />
With the growth of manufacturing in <strong>Clarksville</strong> and Montgomery County, the need for bachelor’s<br />
degree holders by manufacturers is lower than in an environment where there are more advanced<br />
manufacturing opportunities. While APSU does offer associate’s degrees in manufacturing-related<br />
fields (mechatronics, for example), 70% of degrees at APSU are bachelor’s level or above and are<br />
relevant to areas other than manufacturing, such as business, education, healthcare, information<br />
technology, etc. However, there is substantial opportunity to work with APSU, HCC, TCAT, and area<br />
high schools to ensure the program development and workforce preparedness are more aligned<br />
with the economic and job development priorities of the community. A council or team assigned<br />
to assess and explore these opportunities and the development of programs may be advisable.<br />
Education & Training Demand 57
TABLE 14: In-demand Civilian Jobs comparable to Exiting Military Experience<br />
SOC<br />
CODE<br />
SOC DESCRIPTION<br />
2016<br />
JOBS<br />
ANNUAL<br />
OPENINGS<br />
MEDIAN<br />
HOURLY<br />
EARNINGS<br />
TYPICAL ENTRY<br />
LEVEL EDUCATION<br />
11-1021 General and Operations Managers 1,889 185 $34.78 Bachelor's degree<br />
IN-DEMAND<br />
MOST<br />
FREQUENT<br />
LESS FREQUENT<br />
11-9199 Managers, All Other 953 81 $18.93 Bachelor's degree<br />
53-3032<br />
49-3023<br />
Heavy and Tractor-Trailer Truck<br />
Drivers<br />
Automotive Service Technicians<br />
and Mechanics<br />
2,271 273 $17.38 Postsecondary<br />
nondegree award<br />
989 101 $15.52 Postsecondary<br />
nondegree award<br />
29-1141 Registered Nurses 2,245 150 $26.64 Bachelor's degree<br />
29-2061<br />
Licensed Practical and Licensed<br />
Vocational Nurses<br />
1,314 101 $18.03 Postsecondary<br />
nondegree award<br />
31-9092 Medical Assistants 562 83 $13.36 Postsecondary<br />
nondegree award<br />
31-9091 Dental Assistants 444 59 $16.78 Postsecondary<br />
nondegree award<br />
29-2041<br />
Emergency Medical Technicians<br />
and Paramedics<br />
272 17 $13.75 Postsecondary<br />
nondegree award<br />
13-1151<br />
Training and Development<br />
Specialists<br />
239 27 $23.17 Bachelor's degree<br />
11-3121 Human Resources Managers 145 15 $36.66 Bachelor's degree<br />
MOST FREQUENT OCCUPATIONS FROM CROSSWALK<br />
49-2022<br />
Telecommunications Equipment<br />
Installers and Repairers, Except<br />
Line Installers<br />
307 31 $22.02 Postsecondary<br />
nondegree award<br />
15-1199 Computer Occupations, All Other 280 22 $31.41 Bachelor's degree<br />
15-1142<br />
11-3021<br />
49-2094<br />
Network and Computer Systems<br />
Administrators<br />
Computer and Information<br />
Systems Managers<br />
Electrical and Electronics<br />
Repairers, Commercial and<br />
Industrial Equipment<br />
163 14 $29.81 Bachelor's degree<br />
160 16 $42.86 Bachelor's degree<br />
55 6 $26.03 Postsecondary<br />
nondegree award<br />
15-2031 Operations Research Analysts 48 6 $30.30 Bachelor's degree<br />
15-1141 Database Administrators 38 4 $32.15 Bachelor's degree<br />
11-9021 Construction Managers 465 33 $17.12 Bachelor's degree<br />
13-1199<br />
Business Operations Specialists,<br />
All Other<br />
761 80 $28.39 Bachelor's degree<br />
13-1111 Management Analysts 333 41 $31.14 Bachelor's degree<br />
11-3011 Administrative Services Managers 273 26 $30.96 Bachelor's degree<br />
15-1121 Computer Systems Analysts 230 23 $30.01 Bachelor's degree<br />
17-3023<br />
11-9041<br />
Electrical and Electronics<br />
Engineering Technicians<br />
Architectural and Engineering<br />
Managers<br />
154 12 $25.04 Associate's degree<br />
128 11 $48.38 Bachelor's degree<br />
21-1092<br />
Probation Officers and<br />
Correctional Treatment<br />
Specialists<br />
103 11 $17.99 Bachelor's degree<br />
58<br />
COMPREHENSIVE LABOR ANALYSIS: CLARKSVILLE-MONTGOMERY COUNTY
SOC<br />
CODE<br />
SOC DESCRIPTION<br />
2016<br />
JOBS<br />
ANNUAL<br />
OPENINGS<br />
MEDIAN<br />
HOURLY<br />
EARNINGS<br />
TYPICAL ENTRY<br />
LEVEL EDUCATION<br />
43-3031<br />
Bookkeeping, Accounting, and<br />
Auditing Clerks<br />
1,576 178 $16.48<br />
Some college, no<br />
degree<br />
LESS FREQUENT OCCUPATIONS FROM CROSSWALK<br />
49-9021<br />
11-9039<br />
Heating, Air Conditioning, and<br />
Refrigeration Mechanics and<br />
Installers<br />
Education Administrators, All<br />
Other<br />
505 52 $17.48 Postsecondary<br />
nondegree award<br />
471 32 $34.27 Bachelor's degree<br />
13-1071 Human Resources Specialists 443 50 $24.63 Bachelor's degree<br />
11-9111<br />
Medical and Health Services<br />
Managers<br />
415 37 $38.03 Bachelor's degree<br />
29-1051 Pharmacists 368 21 $54.61<br />
Doctoral or<br />
professional degree<br />
33-2011 Firefighters 332 29 $17.70 Postsecondary<br />
nondegree award<br />
13-1023<br />
29-2071<br />
Purchasing Agents, Except<br />
Wholesale, Retail, & Farm Products<br />
Medical Records and Health<br />
Information Technicians<br />
268 27 $24.40 Bachelor's degree<br />
266 18 $15.01 Postsecondary<br />
nondegree award<br />
29-2021 Dental Hygienists 240 19 $30.82 Associate's degree<br />
29-1069<br />
29-2012<br />
Physicians and Surgeons, All<br />
Other<br />
Medical and Clinical Laboratory<br />
Technicians<br />
203 12 $107.82<br />
Doctoral or<br />
professional degree<br />
187 11 $19.41 Associate's degree<br />
13-1041 Compliance Officers 171 20 $22.98 Bachelor's degree<br />
11-9151<br />
Social and Community Service<br />
Managers<br />
170 19 $25.55 Bachelor's degree<br />
29-2034 Radiologic Technologists 160 9 $23.42 Associate's degree<br />
13-1051 Cost Estimators 157 18 $26.71 Bachelor's degree<br />
13-1081 Logisticians 154 15 $30.32 Bachelor's degree<br />
31-2021 Physical Therapist Assistants 150 24 $25.08 Associate's degree<br />
Education & Training Demand 59
STAKEHOLDER THEMES<br />
• Both employers and the community recognize the strengths of the consolidated K-12 school<br />
system through to post-secondary education institutions in <strong>Clarksville</strong>. These strengths work<br />
to both attract and retain talent. 58% of employers surveyed partner with a community or<br />
technical college and more importantly, several employers seem open to and excited about the<br />
opportunities for continued partnering, both with secondary and higher education institutions.<br />
Meanwhile, certain soft skills such as communication, and hard skills like computer and math<br />
skills remain as areas for continued improvement. These are skills that employers value in high<br />
school graduates and for entry level positions, as well as basic job preparedness.<br />
• Austin Peay State University, Tennessee College of Applied Technology, Hopkinsville<br />
Community College and <strong>Clarksville</strong>-Montgomery County School System (CMCSS) educators<br />
are willing to collaborate and innovate to deliver workforce development in line with business<br />
and economic development goals. Employers during focus groups mentioned opportunities for<br />
graduates of programs for industrial arts, general maintenance, programmable logic controller<br />
(PLC), and micro/macro electrical systems. Many businesses represented in the focus groups<br />
noted a desire to work more closely with educators. It seems likely that success in employerled<br />
collaborative training programs will encourage other employers to participate.<br />
• Manufacturers want to increase the number of high school educators who are well informed<br />
about what today’s advanced manufacturing sites and occupations offer to the future workforce,<br />
who might then nudge more high school students to consider the field. They are also interested<br />
in gaining attention with even younger classes, including junior high school students. And<br />
CMCSS has strong career placement efforts that could mesh well with local employers.<br />
• Stakeholders noted a desire to retain more professional and technically trained alumni in the<br />
area. 36% of openings in businesses surveyed require an associate’s degree or higher. (21% of<br />
openings require a bachelor’s degree or higher).<br />
• 36% of employers surveyed expect to utilize internships more and create apprenticeships.<br />
• A range exists with respect to anticipated automation: some companies have already added<br />
significant automation. Generally, businesses expect automation levels to continue increase over<br />
the coming years, but perhaps not as rapidly or with as many drastic changes to employment<br />
levels as may have been previously thought. Many expect automation to create a demand for<br />
higher orders of skills but not to change the overall numbers of workers.<br />
Educational attainment in the area lags that of peer regions. If the lowering of the Labor Force<br />
Participation Rate (LFPR) is due in part to an increase in younger cohorts seeking a higher<br />
education, especially due to programs such as the Tennessee Promise, then this is a positive<br />
development. Currently, however, there seems to be an undersupply of jobs requiring some<br />
college or an associate degree. Meanwhile jobs requiring a bachelor’s degree, while still lacking<br />
enough qualified candidates, are nonetheless slightly less available for the area while low skill<br />
jobs are plentiful. Some forces seem to signify future growth in the middle skilled occupations.<br />
This could be supplemented with a targeted attraction approach.<br />
60<br />
COMPREHENSIVE LABOR ANALYSIS: CLARKSVILLE-MONTGOMERY COUNTY
INDUSTRY CLUSTER AND<br />
SUPPLY CHAIN ANALYSIS<br />
KEY HIGHLIGHTS<br />
$12.7 billion economy in <strong>Clarksville</strong> MSA<br />
Five clusters identified for opportunities for growth and diversification:<br />
• Chemical Products<br />
• Automotive, Aerospace, and Production Technology<br />
• Metal Products and Mining<br />
• Business Services<br />
• Distribution and Electronic Commerce<br />
• Exponential job growth<br />
• Pay 19% more than other jobs<br />
• Business Services contribute the<br />
most to the region’s GRP but are not<br />
considered a heavy export industry<br />
THE REGION<br />
<strong>Clarksville</strong> is situated in northwestern<br />
Tennessee, within Montgomery County.<br />
The region surrounding the city includes<br />
Montgomery, Cheatham, Dickson, Houston,<br />
Robertson, and Stewart Counties in Tennessee<br />
and Christian, Logan, Todd, and Trigg Counties<br />
in Kentucky. Together these ten counties<br />
comprise the area from which businesses<br />
located in <strong>Clarksville</strong> source local goods and<br />
services, and from which they can reasonably<br />
expect to draw their workforces. For this<br />
reason, the analysis that follows highlights<br />
opportunities within the <strong>Clarksville</strong> MSA,<br />
using the greater ten-county region to further<br />
Industry Cluster and Supply Chain Analysis 61
understand economic development potential. As can be seen in Table 15, the <strong>Clarksville</strong> MSA’s<br />
economy is about 66% of the greater ten-county region. The industries generating the largest<br />
market value of all final goods and services produced within the <strong>Clarksville</strong> MSA are highlighted<br />
in Figure 30.<br />
TABLE 15: Gross Regional Product Overview for Economic Region (2016)<br />
NAICS<br />
INDUSTRY<br />
CLARKSVILLE<br />
MSA<br />
MONTGOMERY<br />
COUNTY<br />
10 COUNTY<br />
11 Crop and Animal Production $84,839,649 $38,343,132 $304,344,083<br />
21<br />
Mining, Quarrying, and Oil and Gas<br />
Extraction<br />
$153,924,325 $142,592,022 $177,087,753<br />
22 Utilities $78,614,014 $51,939,864 $122,522,208<br />
23 Construction $291,231,353 $203,866,548 $673,376,749<br />
31 Manufacturing $1,408,033,810 $476,733,692 $3,281,744,961<br />
42 Wholesale Trade $296,698,504 $187,632,152 $600,179,618<br />
44 Retail Trade $646,678,871 $478,840,862 $1,068,672,619<br />
48 Transportation and Warehousing $183,058,081 $62,698,725 $407,680,439<br />
51 Information $199,091,484 $161,679,595 $286,221,312<br />
52 Finance and Insurance $309,582,133 $207,061,236 $497,324,887<br />
53 Real Estate and Rental and Leasing $284,871,931 $212,299,086 $472,459,266<br />
54<br />
Professional, Scientific, and Technical<br />
Services<br />
$220,777,575 $122,010,768 $345,615,687<br />
55 Management of Companies and Enterprises $29,307,348 $25,546,951 $98,653,465<br />
56<br />
Administrative and Support and Waste<br />
Management and Remediation Services<br />
$264,666,108 $153,140,326 $454,305,108<br />
61 Educational Services $53,129,505 $21,332,868 $65,588,160<br />
62 Health Care and Social Assistance $617,067,466 $372,282,374 $923,540,912<br />
71 Arts, Entertainment, and Recreation $28,816,017 $22,684,817 $71,723,295<br />
72 Accommodation and Food Services $284,448,482 $211,781,268 $427,174,952<br />
81<br />
Other Services (except Public<br />
Administration)<br />
$154,070,571 $102,423,767 $286,317,737<br />
90 Government $5,942,429,888 $844,573,197 $6,654,740,885<br />
- Other Vectors $1,188,463,234 $886,610,539 $2,097,870,201<br />
- Total All Industries $12,719,800,350 $4,986,073,787 $19,317,144,298<br />
This section of the report provides descriptions and analyses for industry clusters that drive the<br />
region’s economy. From these analyses, we can determine the businesses and industry sectors<br />
that offer the most potential for growth in <strong>Clarksville</strong>.<br />
62<br />
COMPREHENSIVE LABOR ANALYSIS: CLARKSVILLE-MONTGOMERY COUNTY
INDUSTRY CLUSTERS<br />
Industry clusters are a geographic concentration of industries that share common markets,<br />
suppliers, technologies, and workforce needs. Businesses within a cluster benefit from their<br />
proximity to shared resources including a skilled workforce, specialized suppliers, infrastructure,<br />
and a localized base of sophisticated industry knowledge about their industry. Each cluster has a<br />
high level of economic integration and interdependency. Industry cluster analysis highlights the<br />
strengths and weaknesses of different industries within a region and shows where focus needs<br />
to be placed to encourage growth. To determine industry clusters, we assess job growth, regional<br />
specialization, contribution to GRP, and location quotient (discussed below), among other factors.<br />
When analyzing industry clusters, one measure of cluster viability is its ‘location quotient’ (or LQ).<br />
The LQ for a particular industry measures its share of an area’s employment compared to its share<br />
of employment at the national level. For example, a LQ of 2.0 indicates that an industry accounts<br />
for twice the share of employment in the area than it does nationally, and a LQ of 0.5 indicates<br />
that an industry’s share of employment is only half the national average. Industries with a high<br />
relative concentration—or high LQ—are said to be specialized in a region.<br />
In <strong>Clarksville</strong>, the metal products and mining cluster has a very high concentration—38 LQ. This<br />
means that in <strong>Clarksville</strong>, metal products and mining is 38 times more concentrated than would<br />
be expected in another economy of similar size (see Figure 30).<br />
For the supply chain analysis that follows, we consider the following five clusters:<br />
• Chemical Products<br />
• Automotive, Aerospace, and Production Technology<br />
• Metal Products and Mining<br />
• Business Services<br />
• Distribution and Electronic Commerce<br />
Each cluster represents opportunities for growth and diversification for the <strong>Clarksville</strong> economy as<br />
well as opportunities for regional businesses to diversify their market base. Table 16 summarizes<br />
projected employment growth for each cluster and its corresponding location quotient. Many of<br />
the clusters selected are growing faster than the <strong>Clarksville</strong> economy as a whole, with projected<br />
job growth rates as high as 22% per year for the next 5 years (versus overall county average job<br />
growth of 4% per year). The jobs in these clusters pay, on average, 19% more than other jobs.<br />
Industry Cluster and Supply Chain Analysis 63
FIGURE 30: Industry Cluster Performance, <strong>Clarksville</strong> MSA<br />
Bubble size represents Jobs in 2016<br />
45<br />
40<br />
Important industries that may require attention<br />
Important growth industries<br />
35<br />
Location Quotient<br />
30<br />
25<br />
20<br />
15<br />
10<br />
5<br />
Metal Products<br />
& Mining<br />
Automotive, Aerospace, and<br />
Production Technology<br />
Distribution<br />
and Electronic<br />
Commerce<br />
Business Service<br />
Chemical Products<br />
0<br />
Emerging industries<br />
–5<br />
–10% –5% 0% 5% 10% 15% 20% 25% 30%<br />
Job Growth (2016-2021)<br />
TABLE 16: Industry Clusters Performance Trends, <strong>Clarksville</strong> MSA (2016-2021)<br />
INDUSTRY<br />
CLUSTER<br />
EMPLOYMENT<br />
% PROJECTED<br />
CHANGE (ANNUAL<br />
AVERAGE RATE OF<br />
GROWTH)<br />
CONCENTRATION<br />
(LQ)<br />
AVERAGE<br />
EARNINGS<br />
TOTAL SALES<br />
GROSS<br />
REGIONAL<br />
PRODUCT (GRP)<br />
ESTAB-<br />
LISHMENTS<br />
2016 2021 2016-2021 2016 2016 2016 2016 2016<br />
Chemical<br />
Products<br />
Automotive,<br />
Aerospace,<br />
and Production<br />
Technology<br />
Metal Products<br />
and Mining<br />
94 115 22% 4.8 $78,952 $68,436,756 $17,646,466 2<br />
5,330 5,384 1% 20.7 $62,214 $2,074,101,660 $549,721,049 21<br />
1,889 1,788 (5%) 38 $68,869 $729,181,378 $326,957,963 30<br />
Business Services 6,437 7,225 12% 5.5 $52,869 $956,588,471 $599,419,218 552<br />
Distribution<br />
and Electronic<br />
Commerce<br />
Total of Target<br />
Clusters<br />
Total <strong>Clarksville</strong><br />
MSA<br />
Total Clusters as<br />
% of <strong>Clarksville</strong><br />
MSA<br />
3,491 3,690 6% 1.4 $57,674 $636,877,556 $380,680,012 243<br />
17,241 18,202 6% $58,626 $4,465,185,821 $1,874,424,708 848<br />
124,880 129,555 4% - $49,431 $31,286,440,392 $11,531,337,116 4,950<br />
14% 14% - - 119% 14% 16% 17%<br />
64<br />
COMPREHENSIVE LABOR ANALYSIS: CLARKSVILLE-MONTGOMERY COUNTY
SUPPLY CHAIN ANALYSIS<br />
Supply chain analysis is a process by which the inputs and outputs of an area’s industry clusters are<br />
evaluated—which goods and services are being bought and sold, in what quantities, and where they<br />
are being bought from or sold to. The analysis can help identify the different types of businesses<br />
that comprise an industry cluster and, most importantly for economic development, can identify<br />
segments of the supply chain that may be absent from a particular region. These supply chain<br />
gaps, as they’re known, can represent opportunities for new development that can strengthen<br />
existing industry clusters and may support other non-related industries in the region as well.<br />
Table 17 shows in-region sales and exported (out-of-region) sales for each industry cluster. This is<br />
useful for understanding how much revenue a cluster is bringing into the region through its sales<br />
of goods and services outside of the region. Industries that predominantly export their products<br />
bring new money into the economy, which in turn drives other regional businesses. Automotive,<br />
aerospace, and production, for example, sells 93% of its products outside of <strong>Clarksville</strong>, bringing<br />
an estimated $1.9 billion in sales into the region.<br />
Table 17, on the next page, also shows the total demand in <strong>Clarksville</strong> for the goods and services<br />
offered by each industry cluster. This is the demand by <strong>Clarksville</strong> residents and businesses<br />
for the products and/or services produced by that industry cluster — regardless of whether the<br />
products or services are actually produced by companies within the region. Furthermore, the table<br />
shows how much of local demand is met by companies within the region and how much of local<br />
demand is met by importing from other regions. This comparison helps determine opportunities<br />
to expand local businesses’ shares of local demand. For example, if only 10% of regional demand<br />
for a product is being met by regional companies, this table will quantify the value of the remaining<br />
90% of demand that could be met by regional companies.<br />
Table 18 shows the purchases of services and manufactured goods, respectively, made by<br />
businesses in the <strong>Clarksville</strong> MSA. This information helps quantify the supply chain needs<br />
of businesses within the county. By comparing the proportion of supply chain needs met by<br />
companies within the region to the proportion met by importing goods and services from outside<br />
the region we can identify potential opportunities for new development. In reviewing the above<br />
data, certain industry clusters may be better targets for economic development efforts than<br />
others. Certain clusters, such as primary metal manufacturing and fabricated metal products, are<br />
strong in the region but primarily export their products while at the same time, other companies<br />
are heavily importing products from these same industry clusters. For metal products, for example,<br />
only 7% of production is sold within the region, while simultaneously, all businesses within the<br />
region import about 61% of their needs (Table 17).<br />
Table 18 shows more detailed industry sectors that have potential to sell more of their goods and<br />
services within the region. Metal products (both primary and fabricated) are heavily imported by<br />
<strong>Clarksville</strong> businesses, yet these sectors are also well-represented within the area. Many of the<br />
industry sectors shown in Table 18 are sectors that commonly sell to other businesses—such as<br />
management services, transportation, wholesale services, and manufacturing that supports other<br />
manufacturing businesses (such as machinery manufacturing).<br />
Industry Cluster and Supply Chain Analysis 65
TABLE 17: Industry Clusters Performance Trends—Sales and GRP, <strong>Clarksville</strong> MSA (2016)<br />
CLARKSVILLE MSA KEY INDUSTRIES (2016)<br />
Chemical Products<br />
Automotive, Aerospace, and<br />
Production Technology<br />
Metal Products and Mining<br />
2016 GRP $17,646,466<br />
2016 GRP $549,721,049<br />
2016 GRP $326,957,963<br />
2016 Total Sales<br />
$68,436,756<br />
2016 Total Demand<br />
$33,144,760<br />
2016 Total Sales<br />
$2,074,101,660<br />
2016 Total Demand<br />
$983,337,004<br />
2016 Total Sales<br />
$729,181,378<br />
2016 Total Demand<br />
$127,788,909<br />
5% In Region<br />
95% Exported<br />
95+5O89+11O<br />
2016<br />
Sales<br />
2016<br />
Demand<br />
11% In Region<br />
89% Imported<br />
91+9O80+20O<br />
2016<br />
Sales<br />
2016<br />
Demand<br />
9% In Region<br />
91% Exported<br />
20% In Region<br />
80% Imported<br />
93+7O61+39O<br />
2016<br />
Sales<br />
2016<br />
Demand<br />
7% In Region<br />
93% Exported<br />
39% In Region<br />
61% Imported<br />
Business Services<br />
Distribution and<br />
Electronic Commerce<br />
2016 GRP $599,419,218<br />
2016 GRP $380,680,012<br />
2016 Total Sales<br />
$956,588,471<br />
2016 Total Demand<br />
$2,079,908,456<br />
2016 Total Sales<br />
$636,877,556<br />
2016 Total Demand<br />
$959,266,570<br />
67+33O85+15O<br />
2016<br />
Sales<br />
2016<br />
Demand<br />
33% In Region<br />
15% In Region<br />
64+36O 76+24O<br />
2016<br />
Sales<br />
2016<br />
Demand<br />
36% In Region<br />
24% In Region<br />
67% Exported<br />
85% Imported<br />
64% Exported<br />
76% Imported<br />
TABLE 17: Key Industry Clusters<br />
INDUSTRY CLUSTER<br />
GROSS<br />
REGIONAL<br />
PRODUCT (GRP)<br />
TOTAL SALES<br />
%<br />
IN-REGION<br />
SALES<br />
%<br />
EXPORTED<br />
SALES<br />
TOTAL DEMAND<br />
% DEMAND<br />
MET<br />
IN-REGION<br />
% DEMAND<br />
MET BY<br />
IMPORTERS<br />
Chemical Products $17,646,466 $688,436,756 5% 95% $33,144,760 11% 89%<br />
Automotive, Aerospace, and<br />
Production Technology<br />
$549,721,049 $2,074,101,660 9% 91% $983,337,004 20% 80%<br />
Metal Products and Mining $326,957,963 $729,181,378 7% 93% $127,788,909 39% 61%<br />
Business Services $599,419,218 $956,588,471 33% 67% $2,079,908,456 15% 85%<br />
Distribution and Electronic<br />
Commerce<br />
$380,680,012 $636,877,556 36% 64% $959,266,570 24% 76%<br />
Total of Target Clusters $1,874,424,708 $4,465,185,821 18% 82% $4,183,445,699 22% 78%<br />
Total <strong>Clarksville</strong> MSA $11,531,337,116 $31,286,440,392 13% 87% $25,857,695,290 17% $83%<br />
Total as % of <strong>Clarksville</strong> 16% 14% - - 16% - -<br />
66<br />
COMPREHENSIVE LABOR ANALYSIS: CLARKSVILLE-MONTGOMERY COUNTY
TABLE 18: Purchases of Services by <strong>Clarksville</strong> MSA Businesses from Other Local Businesses or from Businesses<br />
Located Outside of the MSA (2016)<br />
2016 DEMAND FOR<br />
DEMAND MET<br />
IN-REGION<br />
% DEMAND MET<br />
IN-REGION<br />
DEMAND MET<br />
BY IMPORTS<br />
% DEMAND MET<br />
BY IMPORTS<br />
TOTAL DEMAND<br />
Management of Companies and<br />
Enterprises<br />
Fabricated Metal Product<br />
Manufacturing<br />
Transportation Equipment<br />
Manufacturing<br />
$2,459,489 1.3% $183,668,042 98.7% $186,127,532<br />
$9,504,039 5.4% $165,267,656 94.6% $174,771,695<br />
$47,974,814 30.5% $109,524,703 69.5% $157,499,517<br />
Primary Metal Manufacturing $10,274,004 6.9% $139,434,751 93.1% $149,708,754<br />
Machinery Manufacturing $25,392,747 20.6% $97,754,498 79.4% $123,147,246<br />
Professional, Scientific, and Technical<br />
Services<br />
Merchant Wholesalers, Durable<br />
Goods<br />
Plastics and Rubber Products<br />
Manufacturing<br />
$17,388,081 14.4% $103,257,203 85.6% $120,645,284<br />
$13,395,454 13.6% $85,284,935 86.4% $98,680,389<br />
$4,364,528 5.3% $78,618,237 94.7% $82,982,765<br />
Chemical Manufacturing $4,011,410 5.1% $74,704,434 94.9% $78,715,844<br />
Administrative and Support Services $20,717,444 27.1% $55,659,335 72.9% $76,376,779<br />
Credit Intermediation and Related<br />
Activities<br />
Merchant Wholesalers, Nondurable<br />
Goods<br />
$10,172,184 15.6% $54,908,035 84.4% $65,080,219<br />
$10,140,130 16.2% $52,398,933 83.8% $62,539,063<br />
Real Estate $7,338,101 12.0% $53,589,214 88.0% $60,927,315<br />
Mining (except Oil and Gas) $6,483,415 11.7% $48,809,998 88.3% $55,293,414<br />
Securities, Commodity Contracts,<br />
Other Fin. Investments and Related<br />
Activities<br />
Insurance Carriers and Related<br />
Activities<br />
$7,390,936 16.4% $37,700,668 83.6% $45,091,604<br />
$4,571,273 10.2% $40,386,883 89.8% $44,958,157<br />
Truck Transportation $14,969,798 36.8% $25,708,984 63.2% $40,678,782<br />
Wholesale Electronic Markets and<br />
Agents and Brokers<br />
Electrical Equipment, Appliance, and<br />
Component Manufacturing<br />
$7,566,374 18.7% $32,958,710 81.3% $40,525,085<br />
$92,414 0.4% $23,094,997 99.6% $23,187,411<br />
Telecommunications $1,588,986 8.4% $17,388,031 91.6% $18,977,017<br />
All Other $81,793,880 20.2% $368,866,101 79.8% $450,659,981<br />
Total of Target Services (Except All<br />
Other)<br />
$225,795,623 13.8% $1,480,118,249 86.2% $1,705,913,872<br />
Total <strong>Clarksville</strong> MSA $307,589,502 18.8% $1,848,984,351 81.2% $2,156,573,853<br />
Total Target Services (Except All<br />
Other) as % of <strong>Clarksville</strong><br />
73.4% 80.1% 79.1%<br />
Industry Cluster and Supply Chain Analysis 67
STAKEHOLDER THEMES<br />
<strong>Clarksville</strong> enjoys an economy with a strong manufacturing base and the presence of a large<br />
diversity of typical supply chain industries. Local businesses export a large share of their production,<br />
which brings outside money into the economy. Conversely, however, local businesses depend<br />
heavily on imported goods and services. This represents opportunities for local businesses to<br />
diversify their customer base by selling more to each other.<br />
• Cluster industries represent only about 15% of the total economy, which indicates a highly<br />
diverse economy.<br />
• <strong>Clarksville</strong> has well-developed and appealing industrial parks and commercial properties with<br />
high quality occupants and room for growth.<br />
• There is a shortage of office space, particularly Class A office space. Further developments<br />
of this type of property could help attract corporate investment that would provide for higher<br />
technology-based jobs.<br />
68<br />
COMPREHENSIVE LABOR ANALYSIS: CLARKSVILLE-MONTGOMERY COUNTY
PEER REGION ANALYSIS<br />
<strong>Clarksville</strong> is comparable to several geographies and cities using a variety<br />
of factors and specifications. Because of this, there are multiple ways to<br />
go about benchmarking to find the most compatible peer regions for<br />
<strong>Clarksville</strong>.<br />
KEY HIGHLIGHTS<br />
Most Similar Peer Regions (in terms of jobs, share of manufacturing, and GRP)<br />
• Duo Peer Regions: Topeka and Kansas City, Kansas<br />
• Individual Peer Regions: Rochester, Minnesota<br />
All of the peer regions have a higher share of population who hold a bachelor’s<br />
degree or higher.<br />
In this study, two different approaches were employed to determine <strong>Clarksville</strong> peer regions. The<br />
first was to determine peer regions based on geographical factors, specifically a smaller sized city,<br />
like <strong>Clarksville</strong>, and its proximity to a larger city. The focus for this first effort was to benchmark<br />
<strong>Clarksville</strong>’s geographical location in relation to Nashville, two other pairs of smaller sized cities<br />
and their larger counter parts were determined. From there, a duo region peer region analysis<br />
was conducted.<br />
The second method was to use the individual demographic and economic traits of <strong>Clarksville</strong> as a<br />
benchmark against other cities in the U.S. Using this method, unique emphasis was put specifically<br />
on population, GRP, and the manufacturing sector’s characteristics to find peer regions that have<br />
similar regional traits and growth trends as those in <strong>Clarksville</strong>.<br />
Peer Region Analysis 69
DUO PEER REGIONS<br />
The duo peer region analysis brought forth two duo peer regions. Those peer regions are Tuscaloosa<br />
and Birmingham, Alabama, and Topeka and Kansas City, Kansas. Each cities economy has been<br />
broken out in Table 19. Here we can view industry and demographic similarities based on economic<br />
traits and trends. One trend that stands out is the low cost of living across all duo peer regions. All<br />
but two are below the national average (100) and the two above it (Birmingham and Kansas City)<br />
are within a single decimal point of being the national average. Because of this, it can be assumed<br />
that each of these cities are relatively affordable places to live, which adds to the spending power<br />
for people living in any of these cities. A lower cost of living can make an area more attractive to<br />
business and talent alike.<br />
TABLE 19: Duo Peer Regions, MSAs, All Industries<br />
MSA DUOS<br />
POPULATION<br />
(2017)<br />
TOTAL<br />
INDUSTRY<br />
JOBS (2017)<br />
CURRENT<br />
AVERAGE<br />
EARNINGS<br />
COL<br />
INDEX<br />
BACHELOR’S<br />
DEGREE OR<br />
HIGHER %<br />
GRP<br />
<strong>Clarksville</strong> 285,375 126,375 $49,431 94.8 13.4% $12,719,800,350<br />
Nashville 1,895,156 1,033,229 $59,589 99.6 21.4% $113,579,180,412<br />
MSA Combination from<br />
Tennessee<br />
2,180,532 1,159,604 $58,482 99.1 20.4% $126,298,980,762<br />
Tuscaloosa 243,350 112,163 $49,620 95.8 15.7% $11,849,195,973<br />
Birmingham 1,151,214 545,238 $57,271 100.4 19.1% $58,679,143,952<br />
MSA Combination from<br />
Alabama<br />
1,394,565 657,402 $55,966 99.6 18.5% $70,528,339,926<br />
Topeka 232,990 121,824 $50,451 98.7 18.3% $10,537,398,969<br />
Kansas City 2,119,174 1,142,475 $59,788 100.9 23.1% $120,976,430,762<br />
MSA Combination from<br />
Kansas<br />
2,352,164 1,264,299 $58,888 100.7 22.6% $131,513,829,731<br />
Source: Emsi<br />
A benchmark variable used throughout this study was the percentage of GRP that is made up of<br />
manufacturing industries and the amount of manufacturing jobs each of these regions have. Using<br />
the same citiess as above, data for manufacturing for each city is shown in Table 20.<br />
The percentage of manufacturing that contributes to total GRP in <strong>Clarksville</strong> is 11.1%. The two cities<br />
comparable in size, Tuscaloosa and Topeka, have manufacturing industries that make up 38.0%<br />
and 9.3% of their GRP. This suggests that <strong>Clarksville</strong> has more in common from a manufacturing<br />
standpoint with Topeka, rather than Tuscaloosa. Likewise, Nashville is more comparable with Kansas<br />
City, 11.1% and 12.8%, than with Birmingham, 7.9%. That being said, there is much to be gained<br />
in studying the Tuscaloosa manufacturing sector. Job growth in the Tuscaloosa manufacturing<br />
industry was 3.1% from 2016 to 2017, verses manufacturing job growth in <strong>Clarksville</strong> and Topeka,<br />
of 0.2% and 0.1% respectively.<br />
70<br />
COMPREHENSIVE LABOR ANALYSIS: CLARKSVILLE-MONTGOMERY COUNTY
TABLE 20: Duo Peer Regions, MSAs, Manufacturing Industries<br />
MSA DUOS JOBS (2016) GRP, FROM MFG NAICS MFG AS % OF ECONOMY<br />
<strong>Clarksville</strong> 10,841 $1,408,033,810.40 11.07%<br />
Nashville 82,840 $12,604,757,896.00 11.10%<br />
MSA Combination from Tennessee 93,680 $14,012,791,706.40 11.09%<br />
Tuscaloosa 15,996 $4,506,959,280.33 38.04%<br />
Birmingham 38,154 $4,648,519,648.17 7.92%<br />
MSA Combination from Alabama 54,150 $9,155,478,928.50 12.98%<br />
Topeka 7,412 $974,241,236.15 9.25%<br />
Kansas City 78,303 $15,493,198,200.60 12.81%<br />
MSA Combination from Kansas 85,715 $16,467,439,436.75 12.52%<br />
Source: Emsi<br />
Peer Region Analysis 71
INDIVIDUAL PEER REGIONS<br />
The other portion of this report focused on population, GRP, and manufacturing industries for<br />
cities to be compared solely with <strong>Clarksville</strong>. <strong>Clarksville</strong> was benchmarked against all other<br />
cities in the U.S., using the previously mentioned parameters and the following algorithm. Let x<br />
= desired economic unit of comparison and y = the <strong>Clarksville</strong> equivalent of that economic unit<br />
of comparison and z = the solution. Where (x/y) – 1 = z, 1 – (ABS (z)) = i, where i = an index between<br />
0.00 and 1.00, where 1.00 is the best possible outcome and 0.00 is the worst. These formulas were<br />
tailored to place all the weight of comparison on <strong>Clarksville</strong>. The nearer the solution to 1.00, the<br />
more similar a region is to <strong>Clarksville</strong>.<br />
Per these requirements, and the individual industry specifications of <strong>Clarksville</strong>, 5 peer regions<br />
were found. Table 21 is set up much like Table 19, as it compares all industries within all the peer<br />
regions with those in <strong>Clarksville</strong>. Likewise, Table 22 is set up in the same fashion as Table 20, as it<br />
shows data for the manufacturing industries when comparing peer regions to each other.<br />
TABLE 21: Individual Peer Regions, Cities, All Industries<br />
CLARKSVILLE, TN-KY<br />
ELKHART-<br />
GOSHEN, IN<br />
PEORIA, IL<br />
KALAMAZOO-<br />
PORTAGE, MI HUNTSVILLE, AL ROCHESTER, MN<br />
REGIONAL OVERVIEW<br />
Population<br />
(2016)<br />
Population<br />
Change %<br />
Total Industry<br />
Jobs (2016)<br />
Total Industry<br />
Jobs Change<br />
%<br />
Bachelor’s<br />
Degree or<br />
Higher %<br />
Current Avg.<br />
Earnings<br />
282,353 203,784 376,250 336,865 449,721 215,887<br />
7% 3% (1%) 3% 6% 4%<br />
124,880 135,275 182,469 152,106 234,447 124,433<br />
2% 21% (4%) 7% 7% 7%<br />
13.4% 11.5% 18.2% 20.0% 24.4% 24.1%<br />
$49,431 $54,466 $60,722 $56,469 $65,392 $62,030<br />
COL Index 94.8 94.8 101.5 94.6 100.2 103.8<br />
COL Adjusted<br />
Current Avg.<br />
Earnings<br />
$52,033 $57,333 $59,532 $59,441 $65,392 $59,644<br />
GRP (billions) $12.72 $12.74 $19.59 $15.42 $24.44 $11.76<br />
Source: Emsi<br />
72<br />
COMPREHENSIVE LABOR ANALYSIS: CLARKSVILLE-MONTGOMERY COUNTY
TABLE 22: Individual Peer Regions, Cities, Manufacturing Industries<br />
CLARKSVILLE ALONE MANUFACTURING JOBS GRP MFG AS % OF ECONOMY<br />
<strong>Clarksville</strong> 10,841 $1,408,033,810.40 11.07%<br />
Elkhart-Goshen, IN 63,183 $6,272,356,016.12 49.22%<br />
Peoria, IL 22,717 $5,181,716,439.76 26.45%<br />
Kalamazoo-Portage, MI 21,307 $3,660,257,877.54 23.74%<br />
Huntsville, AL 24,321 $3,376,249,633.34 13.82%<br />
Rochester, MN 10,772 $1,400,394,289.85 11.91%<br />
Source: Emsi<br />
Elkhart-Goshen, IN<br />
This region has a substantially larger manufacturing industry than <strong>Clarksville</strong>, as manufacturing<br />
makes up almost 50% of the regions total GRP. However, Elkhart-Goshen has the smallest number<br />
of graduates with a bachelor’s degree or higher at 11.5%. <strong>Clarksville</strong> is ranked second to last in this<br />
category with only 13.4% of the population having attained a bachelor’s degree or higher. Elkhart,<br />
in fact, was chosen as a peer region to identify factors <strong>Clarksville</strong> may want to move away from.<br />
Despite Elkhart-Goshen having a strong manufacturing sector, the educational attainment that<br />
<strong>Clarksville</strong> should look to attain will be more in line with Huntsville at 24.4% and Rochester 24.1%.<br />
Peoria, IL<br />
As with Elkhart-Goshen, Peoria has a larger manufacturing sector than <strong>Clarksville</strong>, however, unlike<br />
Elkhart-Goshen (and <strong>Clarksville</strong>), the percent of the population with a bachelor’s degree is much<br />
higher at 18.2%. The average wage is another significant difference, being $60,722 in Peoria and<br />
only $49,431 in <strong>Clarksville</strong>. That being said, the COL index for Peoria is 101.5, which is much higher<br />
than <strong>Clarksville</strong> 94.8. The COL index is an element <strong>Clarksville</strong> can use to differentiate itself from<br />
its peer regions when attracting both business and talent. This also puts the wage difference on<br />
a more level field. Meaning, despite Peoria having higher wages, <strong>Clarksville</strong> wages have more<br />
purchasing power.<br />
Kalamazoo-Portage, MI<br />
Despite being much larger than <strong>Clarksville</strong> in populations, jobs, and GRP, Kalamazoo-Portage has a<br />
COL index of 94.6 which is almost identical to that of <strong>Clarksville</strong> at 94.8, and is the lowest of all the<br />
peer regions. Kalamazoo-Portage also has a higher average wage ($56,469) and the third highest<br />
percent of the population with a bachelor’s degree or higher (20%) of all the peer regions. Kalamazoo<br />
Promise started approximately a decade before Tennessee Promise. This program possibly<br />
provides <strong>Clarksville</strong> an opportunity to catch up with its peers. Kalamazoo-Portage manufacturing<br />
industries grew at 0.8% between 2016 and 2017. The region’s manufacturing industries account for<br />
23.74% of the total GRP and account for over 24,000 jobs, signaling a strong manufacturing sector.<br />
Peer Region Analysis 73
Huntsville, AL<br />
The Huntsville, AL, peer region is the largest of all the selected peer regions in terms of population<br />
and GRP. However, it is second in relation to <strong>Clarksville</strong> in regards of manufacturing as a percentage<br />
of GDP. The percent of the population with a bachelor’s degree is the highest of any of the peer<br />
regions at 24.4%, a full 11% higher than <strong>Clarksville</strong>. When compared to <strong>Clarksville</strong>, Huntsville has<br />
a COLI that is 5.4 points higher, at 100.2. However, it is only two percentage points away from<br />
the national average (100.0), meaning the current average earnings in Huntsville are an accurate<br />
representation of how much the wages are actually worth in the area.<br />
Rochester, MN<br />
Of all the peer regions, Rochester, MN, is the most similar to <strong>Clarksville</strong>. Rochester’s total industry<br />
jobs, GRP, and manufacturing as a percentage of GRP are all within a few percentage points of<br />
<strong>Clarksville</strong>. Rochester’s current average industry earnings are almost 13,000 dollars more than<br />
<strong>Clarksville</strong> current average earnings, however, the COLI in Rochester is almost a full ten points<br />
higher than in Rochester, 103.8, giving it the highest cost of living of all the peer regions. Rochester<br />
has one key advantage on <strong>Clarksville</strong>, this is the percent of the population with a bachelor degree<br />
or higher (24.1%). This is almost a full 11% higher than the percentage of the population with a<br />
bachelor’s degree in <strong>Clarksville</strong>. The Rochester peer region is one <strong>Clarksville</strong> can find similarities<br />
with and look for strategies to help increase the percentage of the population with a bachelor’s<br />
degree of higher.<br />
CORPORATE INVESTMENT<br />
YEAR COMPANY INVESTMENT (MILLIONS $) JOBS NEW OR EXISTING<br />
2012 Bridgestone Metalpha 75.0 52 Existing<br />
2012 Agero 8.2 500 New<br />
2012 Florim USA 60.0 33 Existing<br />
2013 Akebono Brake 82.0 94 Existing<br />
2014 Hankook Tire 820.0 1800 New<br />
2014 Shiloh Industries 20.0 150 New<br />
2015 Akebono Brake 48.0 65 Existing<br />
2015 Google 600.0 70 New<br />
2015 Esquire Wire 1.8 60 Existing<br />
2016 Nam Yang USA 3.0 10 New<br />
2016 Verstraete IML USA 20.0 59 New<br />
2017 LG Electronics 252.0 600 New<br />
74<br />
COMPREHENSIVE LABOR ANALYSIS: CLARKSVILLE-MONTGOMERY COUNTY
RECOMMENDATIONS<br />
INCREASE COMMUNICATION AND COLLABORATION<br />
<strong>Clarksville</strong> has an active Area Chamber of Commerce, the Economic Development Council,<br />
the Industrial Board, Workforce Essentials, and military transition programs. Together, these<br />
provide great regional cooperation and collaboration. Nonetheless, during the focus groups and<br />
interviews, companies expressed interest in working more closely with educators. Requesting<br />
corporate support for specific programs, events, school activities, and community efforts can draw<br />
commitment from the multinational companies with local operations. One model for doing this is<br />
the North Louisiana Partnership’s effort in strengthening alignment between industry, education<br />
and workforce development. A best practice is to attract industry champions to provide leadership<br />
for such groups as well as administrative, technical and advocacy support.<br />
Another area for more interaction could be in discussing the vision for the community from a large<br />
variety of perspectives. The need for this can be seen in the downtown redevelopment and riverfront<br />
development efforts. Both areas (downtown and the riverfront) offer considerable possibilities<br />
for development. Intractable disagreements or political wrangling could stall development or<br />
alienate the broader community. One strategy to include more people—particularly educators<br />
and manufacturers—could be to facilitate more discussions, activities, fundraising, etc., all focused<br />
on building excitement and commitment to redeveloping these prime locations in <strong>Clarksville</strong>.<br />
Create a platform where industry can be the leader in partnering with education and government<br />
to tackle workforce issues that are inherent to all. An industry-led group to meet on task-oriented<br />
issues will not only push workforce to the forefront but will provide long-term benefits to the<br />
region. We suggest finding a reputable business leader to be the industry champion and have<br />
them spearhead the group and discussion. The group will list workforce issues and see if there<br />
are any underlying solutions to provide this new “Workforce Development Task Force.” The group<br />
will meet monthly (to keep momentum) until the task is complete. Once completed, if there are<br />
no other issues, the group can disband until another issue arises—keeping in mind not to waste<br />
the time of industry partners. At this time, the group should be comfortable with each other to<br />
be able to reorganize and regain traction when needed. Other efforts that can help improve<br />
communication, collaboration, and awareness of what manufacturing has to offer could include:<br />
• Reverse career fair<br />
• Manufacturing week<br />
• Hands-on field trips<br />
• Career day: engage students and educate them about the career opportunities within skilled<br />
trade industries. Students get the opportunity to talk with local business owners to learn about<br />
the many different careers our community has to offer.<br />
• Leverage recently retired manufacturers to build relationship with college and industry<br />
Recommendations 75
• Best practice: Sector Partnership Model: http://www.sectorstrategies.org/toolkit/introduction<br />
• Best practice: Technical high school<br />
• Connecting industry to classroom (people in industry can talk to students about careers). Best<br />
practice: Nepris https://www.nepris.com/<br />
• Best practice: Diploma Pathway (Louisiana legislation): http://www.louisianabelieves.com/<br />
courses<br />
• Best practice: See Cincinnati’s Agenda 360 as a model for conducting a results-driven Strategic<br />
Planning initiative. http://www.cincinnatichamber.com/agenda360/#.WirH80qnFPY<br />
Areas to increase interactions and communication:<br />
• Military and manufacturers<br />
• Industry and education<br />
• Entrepreneurs and everybody<br />
• Developers and the broader community<br />
• Nashville businesses and <strong>Clarksville</strong> companies<br />
ATTRACT OR GROW MORE CREATIVE AND<br />
TECHNOLOGY-BASED JOBS AND INVESTMENT<br />
<strong>Clarksville</strong> has a strong and growing economy with a significant base of manufacturing jobs.<br />
We recommend that a next step to build and grow the economy is to focus on increasing<br />
technology-based activity. Manufacturing communities that better withstand the highs and lows<br />
of manufacturing tend to have about 30% of “white collar” manufacturing jobs and 70% plant jobs.<br />
For the <strong>Clarksville</strong> employers that we interviewed, the ratio of “white collar jobs” to plant jobs is<br />
about 10% and 90%. “White collar” work includes engineering, design, research and development,<br />
applied research, technology transfer efforts, headquarter work in accounting, legal, marketing, etc.<br />
Production-based economies with a healthy mix of creative work (such as in R&D, engineering, and<br />
design) tend to also have a high rate of business start-ups and entrepreneurial activity. Attracting<br />
more technology-based work will provide upward career mobility and more variety in higher-skilled<br />
work to retain graduates of local schools such as Austin Peay State University.<br />
Many large companies have significant manufacturing operations in <strong>Clarksville</strong>. Working with them<br />
to understand what they require to bring more technology work to the area could quickly bring in<br />
new investment. For example, Hankook intends to have multiple phases of investment that could<br />
include proving grounds. This could a foundation to build on and to demonstrate <strong>Clarksville</strong>’s<br />
potential to other manufacturers. Manufacturing firms foster and incubate tinkerers, inventors, fixers,<br />
and engineers. Much innovation and entrepreneurial activity in industrial economies stems from<br />
employees who solve a problem, and then take that solution and create a company. Technology<br />
attraction efforts can include:<br />
• Provide Class A office space<br />
• Foster industry support of education initiatives such as robotics clubs, STEM competitions,<br />
executives in the classroom<br />
• Create technology transfer activities with formal channels between post-secondary schools<br />
and industry<br />
76<br />
COMPREHENSIVE LABOR ANALYSIS: CLARKSVILLE-MONTGOMERY COUNTY
• Encourage engineering internships<br />
• Develop shared space R&D facilities and makerspaces<br />
• Offer grant-writing assistance for educators and entrepreneurs (SBIR grants, for example)<br />
• Work closely with the larger manufacturers already located in <strong>Clarksville</strong><br />
• Increase interaction with post-secondary institutions on developing STEM programs, lab<br />
space, corporate advisory committees<br />
• Support entrepreneurial activity (business plan assistance, micro-grants, mentors, co-working<br />
spaces)<br />
• Host match-making events for Nashville and <strong>Clarksville</strong> companies—Best practice: Pure<br />
Michigan Business Connect. https://www.michiganbusiness.org/pmbc/<br />
DEVELOP TARGETED AND HIGHLY VISIBLE<br />
STRATEGIES TO RETAIN EXITING MILITARY<br />
PERSONNEL<br />
Dr. Fred Mael wrote a study in May, 2017, that is comprehensive in suggestions and ideas for<br />
retaining and transitioning people based at Fort Campbell who are separating from the military. 1<br />
Using these suggestions, as well as the many programs available to understand how military<br />
occupations and skills translate into the civilian labor force will guide stakeholders in supporting<br />
exiting military.<br />
From his study for Fort Campbell, Dr. Mael found evidence that transition remains difficult for<br />
many veterans and families. A variety of reasons for this are suggested, such as mismatch of<br />
skills to civilian employer requirements, mistranslation of skills, negative perceptions from both<br />
parties regarding the other (soldier and civilian employer), veteran stress at “starting over”, and<br />
often immediate financial loss for the veteran and family (usually stemming from loss of significant<br />
benefits in housing and other financial support provided by the military).<br />
Dr. Mael’s study highlights the factors that contribute successful transition from military to civilian<br />
labor force, which include:<br />
• Personality<br />
• Family influences<br />
• Age/experience<br />
• MOS (military occupation)<br />
• Personal characteristics<br />
• Leader attitudes<br />
• Accepting loss of status and power<br />
• Patience<br />
• Adaptability<br />
• “All in”<br />
• A realistic transition time frame<br />
• Openness to networking<br />
1 Mael, Fred, Ph.D. (2017). Veterans to Workplace: Keys to Successful Transition. Baltimore, Maryland: Mael Consulting.<br />
Recommendations 77
• Openness to information seeking<br />
• Realistic job search preview<br />
• Resume preparation<br />
• Interview preparation<br />
He suggests that programs and counseling efforts can enhance these traits for exiting soldiers.<br />
Furthermore, Dr. Mael’s study highlights efforts that employers and workforce and economic<br />
developers can do. These include:<br />
• Employer programs to facilitate social integration and workplace friendships<br />
• Mentoring in the workplace<br />
• Protocol for onboarding veterans<br />
• Educate hiring managers<br />
For government and agencies<br />
• Programs and tax incentives to hire veterans<br />
• Coordinated efforts to better link veterans with employers<br />
• Understand best practices by states and companies<br />
• Classification system for job search readiness<br />
• Track new veteran hires and identify critical junctures<br />
• Identify/adapt relevant networking training<br />
• Make case for preferring hiring veteran’s spouses<br />
CREATE AN IMPLEMENTATION PLAN<br />
Two studies, one from 2009 and the other from 2013, were conducted to provide economic<br />
development implementation strategies.23 These thorough reports can provide the basis for<br />
updating the next steps to take in ensuring that <strong>Clarksville</strong>-Montgomery County maintains a strong<br />
workforce, education system, and quality of life for its citizens. Since these studies, significant<br />
progress has happened in the development of the <strong>Clarksville</strong> economy—particularly regarding<br />
record levels of corporate investment, job creation, and investment in education. But many of<br />
the findings that led to the strategies suggested remain true today. Some of these (as taken from<br />
these earlier reports) include:<br />
Strengths<br />
• Fort Campbell<br />
• Geographic location near Nashville, Interstate 24 and within a six hour drive of four major cities<br />
• Austin Peay State University<br />
• Small-town feel with a good quality of life<br />
• Great place to raise a family<br />
• Consolidated city and county public school system<br />
• A growing and diverse population<br />
• Cumberland River and the new riverfront development<br />
3 A Labor Market Assessment for the Fort Campbell Region. Austin, Texas: TIP Strategies. 2013.<br />
78<br />
COMPREHENSIVE LABOR ANALYSIS: CLARKSVILLE-MONTGOMERY COUNTY
• Numerous golf courses in the area<br />
• Local attractions such as Customs House Museum, historic Collinsville, and the Beachaven<br />
Winery<br />
• Leadership in the community<br />
• Affordable land and labor<br />
Weaknesses<br />
• Lack of identity and long-term vision for the future<br />
• Infrastructure has not kept up with rapid growth<br />
• Lack of master plan for development<br />
• Need for more involvement in leadership roles by younger residents<br />
• Lack of consolidated government<br />
• Need for more amenities for residents such as parks, trails, cultural events, higher-end retail<br />
stores and non-chain restaurants<br />
• Under-utilization of Cumberland River area<br />
• Challenge to fund new schools due to rapid growth<br />
Recommendations<br />
• Creation of a long-term vision and master plan for development, particularly with regard to<br />
infrastructure improvements<br />
• Consolidation of city and county governments<br />
• More involvement of younger residents in leadership roles and economic development activities<br />
• Stronger partnership with Austin Peay State University<br />
• Continued development of the riverfront area and marina<br />
• Establishment of more amenities for residents such as parks, trails, cultural events, higher-end<br />
retail stores and non-chain restaurants<br />
Recommendations 79
CONCLUSION<br />
The greater <strong>Clarksville</strong> region is a place young families choose to live with<br />
an increasing number of millennials settling in to this rapidly growing region<br />
in middle Tennessee. The area has benefitted from strong population and<br />
job growth and significant corporate investment.<br />
With 3,000 businesses around Montgomery County and growing rapidly, it is critical the<br />
conversation around workforce continues. This could be realized by building on partnerships<br />
between government, education, business, and industry. To achieve success, business and industry<br />
need to lead the discussion and be more involved in education at ground level.<br />
Despite the rapid growth in population and the number of jobs, income and education levels<br />
are lower than in nearby regions. On a positive note, the share of working age population in the<br />
labor force is significantly higher than the national average and the median age, at 29, is quite<br />
low (the median age for the state and nation is 38). This bodes well for labor force growth and<br />
skills improvements. The younger age cohorts are more likely to take on additional skills training,<br />
but these are also the age cohorts with the highest job turnover. Turnover raises concerns for<br />
business and industry as they struggle to find skilled workers, particularly for entry-level positions.<br />
Manufacturers cited competition in the market for workers and lack of soft skills as the largest<br />
contributing factors in their difficulties to find the workers they need.<br />
Registered nurses, teachers, and managers are the occupations with great potential (most abundant,<br />
high wage, and projected high growth) over the next five years. <strong>Clarksville</strong> and Montgomery County<br />
are a hotbed for teachers as higher education institutions strive to fill the education gaps. A source<br />
of filling such in-demand jobs are the roughly 400 military personnel exiting Fort Campbell each<br />
month that the region has been struggling to tap into and identify with. The military experience<br />
or capabilities that translate into the civilian workforce these individuals possess (sometimes with<br />
some additional education and training needed) include management skills, health care, truck<br />
drivers, technicians, and mechanics. However, training institutions are already having a difficult<br />
time keeping up with demand from business for these positions, let alone the influx of exiting<br />
military needs. The solution is more complex. Exiting military may have different expectations for<br />
work than area businesses may provide—both in compensation and the civilian workplace style.<br />
In addition, the projected growth is such that stakeholders will need to strategically plan their<br />
next steps to stay aligned with current business and industry needs and partner with education<br />
and training institutions all while keeping future growth opportunities at the forefront. There are<br />
a multitude of opportunities for additional growth through expansion of regional industry supply<br />
chains, as examined in this report. Furthermore, important existing industries may need attention<br />
such as metal manufacturing, nonmetallic manufacturing, textile product mills, and nursing care<br />
facilities. While other emerging industries will require support from educators, workforce and<br />
80<br />
COMPREHENSIVE LABOR ANALYSIS: CLARKSVILLE-MONTGOMERY COUNTY
economic development professionals to help them prosper as well. These emerging industries<br />
include distribution and electronic commerce, truck transportation, merchant wholesalers, and<br />
professional services.<br />
Conclusion 81
APPENDIX I:<br />
CORPORATE SUPPORT<br />
Many companies, listed here, participated in focus groups, interviews, and<br />
electronic surveys. We appreciate their time and assistance.<br />
• A.O. Smith Corporation<br />
• Agero<br />
• Ajax Distribution<br />
• Akebono<br />
• Avanti<br />
• Boothill Blades<br />
• Brazeway<br />
• Bridgestone Metalpha USA Inc.<br />
• Budweiser of <strong>Clarksville</strong><br />
• Cargo Partner<br />
• <strong>Clarksville</strong> Foundry Inc.<br />
• Constantina/Verstraete<br />
• Convergys<br />
• Dorman Products, Inc.<br />
• Electrolux<br />
• Esquire Wire<br />
• Florim USA<br />
• Frontier Basement Systems<br />
• Google<br />
• Grupo Antolin<br />
• Hankook Tire<br />
• Hendrickson Trailer<br />
• Jenkins & Wynn<br />
• Jostens<br />
• LG Electronics<br />
• Lowe’s<br />
• Legends Bank<br />
• Mildred and Mable’s<br />
• Morgan Contractors<br />
• Nashville State Community<br />
College<br />
• Nyrstar <strong>Clarksville</strong> Zinc Plant<br />
• Oldcastle Adams<br />
• Premier Medical<br />
• Progressive Directions<br />
• Purity Zinc<br />
• Rainbow, Inc.<br />
• Red Knight Distribution<br />
• Shiloh Industries<br />
• Source Chiropractic<br />
• Thrive Creative Group, LLC<br />
• Trane<br />
• U.S. Bank<br />
• Vulcan Materials Company<br />
• Winn Materials<br />
• Wyatt Johnson<br />
82<br />
COMPREHENSIVE LABOR ANALYSIS: CLARKSVILLE-MONTGOMERY COUNTY
APPENDIX II:<br />
INVESTMENT IN CLARKSVILLE-<br />
MONTGOMERY COUNTY<br />
CORPORATE INVESTMENT<br />
YEAR COMPANY INVESTMENT (MILLIONS $) JOBS NEW OR EXISTING<br />
2012 Bridgestone Metalpha 75.0 52 Existing<br />
2012 Agero 8.2 500 New<br />
2012 Florim USA 60.0 33 Existing<br />
2013 Akebono Brake 82.0 94 Existing<br />
2014 Hankook Tire 820.0 1800 New<br />
2014 Shiloh Industries 20.0 150 New<br />
2015 Akebono Brake 48.0 65 Existing<br />
2015 Google 600.0 70 New<br />
2015 Esquire Wire 1.8 60 Existing<br />
2016 Nam Yang USA 3.0 10 New<br />
2016 Verstraete IML USA 20.0 59 New<br />
2017 LG Electronics 252.0 600 New<br />
Conclusion 83
APPENDIX III:<br />
CLARKSVILLE-MONTGOMERY COUNTY<br />
EDC BUSINESS SURVEY<br />
As part of the effort to reach as many <strong>Clarksville</strong> businesses as possible, an electronic survey was conducted. Survey<br />
questions and the responses received are shown below.<br />
The <strong>Clarksville</strong>-Montgomery County Economic Development Council (EDC) seeks your input. The<br />
<strong>Clarksville</strong>-Montgomery County EDC is creating a comprehensive labor analysis to understand the<br />
current workforce and employer needs within <strong>Clarksville</strong>-Montgomery county and the surrounding<br />
region. We are commissioning Economic Modeling Specialists (Emsi) to assist us with the research,<br />
data gathering, and labor market analysis. As part of that process, Emsi is conducting a targeted<br />
survey to help identify initial thoughts regarding what labor assets and workforce challenges are<br />
present in the <strong>Clarksville</strong>-Montgomery County region. All survey responses will remain anonymous.<br />
We are asking for your assistance in starting that discussion by taking a few minutes to fill out<br />
this survey.<br />
1) What industry best matches your business?12+6+36+85+6+6+6+6+12<br />
Mining, Quarrying, and Oil and Gas Extraction<br />
Utilities<br />
3.0%<br />
6.1%<br />
Construction<br />
18.2%<br />
Manufacturing<br />
42.4%<br />
Wholesale Trade<br />
Retail Trade<br />
Information<br />
Real Estate and Rental and Leasing<br />
Health Care and Social Assistance<br />
Arts, Entertainment, and Recreation<br />
Accommodation & Food Services (e.g. restaurants, hotels, etc.)<br />
Other Services (e.g. automotive repair, personal care services, etc.)<br />
3.0%<br />
3.0%<br />
3.0%<br />
3.0%<br />
3.0%<br />
3.0%<br />
6.1%<br />
6.1%<br />
84<br />
COMPREHENSIVE LABOR ANALYSIS: CLARKSVILLE-MONTGOMERY COUNTY
2) Is your firm in one of the following sectors?<br />
35.5%<br />
Write In<br />
9+39+3+3+10+36+G<br />
9.7%<br />
Professional Services<br />
3.2%<br />
General Warehousing Distribution<br />
9.7%<br />
Automobile and<br />
Related Manufacturing<br />
3.2%<br />
Information/Technology<br />
38.7%<br />
Other (Non-Auto)<br />
Manufacturing<br />
OTHER (Write-in):<br />
• Apartment Rentals<br />
• Broadband / Telecom<br />
Utilities<br />
• Construction<br />
• Electrical installation<br />
• Excavation, demolition.<br />
• Glazing<br />
• Hospitality<br />
• Non-Profit Community<br />
Services<br />
• Strobe lighting repair<br />
• Aggregate hauler<br />
• Wholesale distribution<br />
3) What zip code is your business in?<br />
37040, 37041, 37042, 37043<br />
4) Does your company have difficulty finding qualified candidates to fill<br />
vacant positions?<br />
74.2% Yes<br />
25.8% No<br />
5) Please fill in the number of employees at your firm at each of the<br />
following levels: (e.g. Full-time = 40; Part-time = 20; Contract = 10) NOTE:<br />
totals from all responses.<br />
Full-time: 4,438<br />
Part-time: 440<br />
Contracted: 526<br />
6) Please identify the skills or educational requirements your firm uses in<br />
evaluating candidates (check all that apply):<br />
52% Technical Training (including certifications)<br />
70% Prior Related Experience<br />
42% Recruit for a Specific Technical Skill<br />
15% Education Level Achievement – Associate’s Degree<br />
21% Education Level Achievement – Bachelor’s Degree<br />
42% Company provides On-the-Job Training<br />
21% Other - Write In: CDL Drivers License, Attitude, HS Diploma, WorkKeys Testing, Not hiring,<br />
Interview, Background checks, Drug screens, Clean driving history<br />
Conclusion 85
7) How does your company plan to meet its workforce needs over the next<br />
five years? (check all that apply)<br />
18% Create an apprenticeship experience<br />
58% Partner with a community college, technical college, or similar training organization<br />
28% Hire private services to provide training<br />
28% Deliver training with internal resources<br />
58% Use traditional recruiting methods<br />
18% Increase the use of internships to attract future employees<br />
8) Over the next 2 years, the number of employees at my company will:<br />
Decrease: 10%<br />
Stay the same: 40%<br />
Increase: 50%<br />
9) Please rank the following economic development priorities (on a scale of<br />
1 to 100):<br />
79 Invest in infrastructure development (roads, water, sewer, utilities, etc.)<br />
44 Fund retail development<br />
72 Fund workforce education and training<br />
69 Highway access—interchanges<br />
73 Quality of roads<br />
38 Availability of vacant land<br />
68 Ease of doing business with the City or County government—such as permits<br />
55 Build a larger population base<br />
75 Size of the workforce<br />
70 Workforce training availability<br />
60 Incentive packages<br />
46 Empty buildings ready for development<br />
61 Available housing<br />
67 High school educational facilities<br />
62 Post-secondary educational facilities<br />
69 Broadband and internet connectivity<br />
40 Community bank or other local financial institutions<br />
60 Parks and other recreational facilities<br />
45 Incubators and other business start-up programs<br />
63 Established multi-modal facilities (truck, train, etc.)<br />
10) What are the first few words that come to mind when you think of<br />
<strong>Clarksville</strong>-Montgomery County?<br />
• Booming<br />
• Crowded<br />
86<br />
COMPREHENSIVE LABOR ANALYSIS: CLARKSVILLE-MONTGOMERY COUNTY
• Friendly people<br />
• Good Location<br />
• Great place to live<br />
• Growing (8 responses)<br />
• Home<br />
• Large<br />
• Large, but still feels small town<br />
• Opportunities<br />
• Roads , 374 con.<br />
• Safe<br />
• Small town values<br />
• Two Mayors on different scripts.<br />
• Army<br />
• Boring<br />
• Family<br />
• Good place to live<br />
• Good quality of life<br />
• Great proximity to Nashville<br />
• Hometown<br />
• Infrastructure<br />
• Liveable<br />
• Lower crime<br />
• military<br />
• military emphasis<br />
• No master plan on infrastructure development.<br />
• Opportunity<br />
• OVER CROWDED ROADS<br />
• Revenue<br />
• Roads and bridges<br />
• Safety<br />
• Terrible roads<br />
• Work<br />
• Traffic<br />
• Traffic<br />
• sorry newspaper<br />
• Proximity to large MSA<br />
• opportunity<br />
• mediocre shopping<br />
• lower cost of living<br />
• Large enough but not Metro<br />
• infrastructure lacking<br />
• hometown feel<br />
• Growing<br />
• green<br />
• Great Military and College community with nice diversity<br />
• Fort Campbell<br />
Conclusion 87
• EXCELLENT SCHOOLS<br />
• Diversity<br />
• Better Roads<br />
• behind the times<br />
• A great place to live and work.<br />
11) Is there any one thing, such as automation, that could change your future<br />
hiring / employee skill needs?<br />
• Automation<br />
• CDL Training leading to licensure<br />
• good work ethic<br />
• GPS equipment Allow high school kids to work part time in the summer on construction jobs,<br />
with proper supervision.<br />
• If money was no object and we could automate some of our process it would decrease the<br />
number of FTE’s needed and decrease risk of work related injuries.<br />
• Mind-sets<br />
• RECESSION<br />
• Robotics<br />
• Technical training<br />
• We are fortunate to have a good employee base. However, our community needs to provide<br />
better for it’s citizens to keep attracting more people. We do not have a good plan to do that.<br />
• we need more entry level laborers<br />
• Yes, more automated manufacturing means a need for different skills<br />
• Yes, self service automation for end users. Could change the type of services we offer. Easier<br />
services accomplished by end user, more complex tasks require our employees.<br />
12) What are <strong>Clarksville</strong>-Montgomery County’s strengths regarding<br />
business and economic development?<br />
• Centralized location, interstate 24, Fort Campbell<br />
• Great if you’re selling cars. Other than that....<br />
• I think they do a great job in that area<br />
• Local government support of new and expanding industry, recognition of need to connect<br />
exiting military veterans with employers, availability of utilities needed.<br />
• LOCATION<br />
• Lots of room out in the county for development<br />
• Low cost of living, good quality of life, large spaces available, good organizations able to attract<br />
new businesses.<br />
• Military being here<br />
• not sure<br />
• Our retired military population and a good EDC. We have invested in the industrial park and<br />
it has paid huge dividends.<br />
• Proximity to I-24. Incentive packages for new business. Strong Chamber and EDC. Proximity<br />
to a major airport.<br />
88<br />
COMPREHENSIVE LABOR ANALYSIS: CLARKSVILLE-MONTGOMERY COUNTY
• Seems like a good effort to recruit businesses to <strong>Clarksville</strong>-Montgomery County and continue<br />
our growth as a community.<br />
• Small town feel, but big enough<br />
• Strong support from local and state governments, strong support from TVA<br />
• Tax break incentives interstate proximity great school systems<br />
• Tax credits and help with new equipment costs for new companies and existing large companies<br />
for adding employees.<br />
• tourism<br />
• Very good area for support from State and Local Governments for companies. Location is<br />
central and good logistically for many business purposes. Diverse population that draws from<br />
military and local secondary and tech schools.<br />
13) What are <strong>Clarksville</strong>-Montgomery County’s weaknesses regarding<br />
business and economic development?<br />
• Development that is predominantly focused on Exit 4. No real development on Exit 11. Wilma<br />
Rudolph has become a traffic nightmare and the street side signs are not aesthetically appealing.<br />
• horrible traffic congestion on main roads<br />
• I don’t know of any<br />
• investment in downtown<br />
• Labor shortage. Our unemployment rate has gone from 12% in 2012 to 3%. Keeping people<br />
working - a segment does not need to work. Competing with all the influx of new business<br />
and industry is becoming more and more difficult.<br />
• Lack of infrastructure- need better internet and better roads<br />
• Local Politics<br />
• Low unemployment, making availability of qualified workers very weak. Infrastructure, including<br />
schools, are not keeping up with need. Reluctance of local elected officials to be progressive<br />
when it comes to consolidated government and entertainment venues.<br />
• NO METRO GOV’T<br />
• Not a lot for small companies.<br />
• Not enough technical schools to produce trained multi-craft maintenance candidates.<br />
• not sure<br />
• Only developing one section of town. People would like to have activities/restaurants in places<br />
other than exit 4. Put some stuff between New Providence and post. Also, diversity in selection<br />
of types of businesses is lacking.<br />
• Our roads suck and we do not have a master plan to handle traffic. You can drive around during<br />
peak periods, and see traffic problems every where. We do not have a large convention center<br />
or event center and this is embarrassing.<br />
• Proximity to Nashville, poor road network once off the I24 corridor<br />
• roads<br />
• Sometimes it’s hard to get an answer regarding city/county services; the “that’s not our<br />
department” response is frustrating.<br />
• Traffic, downtown without attractions, not enough retail shops and restaurant.<br />
Conclusion 89
14) What services or activities does <strong>Clarksville</strong>-Montgomery County<br />
provide that are most helpful to your business (or business in general)?<br />
• bringing in new companies<br />
• Building Permit Data<br />
• Business After Hours<br />
• Chamber of Commerce<br />
• EDC<br />
• EDC/Chamber<br />
• Emergency and law enforcement<br />
• FIRE PROTECTION<br />
• Industrial Park<br />
• Low taxes and cost of housing<br />
• Misc. Resources<br />
• parks<br />
• post-HS education<br />
• roads<br />
• School system<br />
• Support for utilities<br />
• Tax incentives<br />
• taxes<br />
• tourism<br />
• tournaments<br />
• UTILITIES<br />
• workforce drug training<br />
• Workforce Essential<br />
• workforce essentials<br />
• Workforce Essentials<br />
15) What services or activities are missing that <strong>Clarksville</strong>-Montgomery<br />
County should provide to help your business (or business in general)?<br />
• An Event Center<br />
• Attractions<br />
• Availability of natural gas on the southwest side of the Cumberland River<br />
• Better bus schedules<br />
• Better bus system with more locations and expanded hours<br />
• Better Roads<br />
• Entertainment Venues<br />
• Hospital imrovement/better reputation<br />
• Internet access in industrial park<br />
• like exit 1, too many businesses<br />
• Mass transportation improvement to industrial park<br />
• no incentives for growing.<br />
• Regular continuous city bus schedules through the Industrial Park<br />
90<br />
COMPREHENSIVE LABOR ANALYSIS: CLARKSVILLE-MONTGOMERY COUNTY
• some bad areas of congestion<br />
• Sponsorship of manufacturing alliances<br />
• Teen activities<br />
16) Are employee commute times a concern?<br />
38+62+G<br />
38.1%<br />
Yes<br />
61.9%<br />
No<br />
17) How long is your commute to work?<br />
Responses ranged from 10 minutes to 45 minutes, with an average of 20 minutes across all<br />
responses.<br />
Conclusion 91
APPENDIX IV:<br />
MOC TO SOC CROSSWALK<br />
One approach to helping veterans transition into the civilian workforce is to provide information on what jobs might<br />
be suitable given the soldier’s military occupation (MOC). The table below shows typical labor force occupations by<br />
Standard Occupational Classification (SOC) matched to their counterpart Military Occupational Classifications (MOC).<br />
MOC SOC CODE SOC TITLE JOBS<br />
Infantry<br />
11-1021<br />
11-3011<br />
11-3121<br />
13-1151<br />
17-3031<br />
21-1092<br />
33-1011<br />
33-3012<br />
33-3051<br />
General and<br />
Operations<br />
Managers<br />
Administrative<br />
Services Managers<br />
Human Resources<br />
Managers<br />
Training and<br />
Development<br />
Specialists<br />
Surveying<br />
and Mapping<br />
Technicians<br />
Probation Officers<br />
and Correctional<br />
Treatment<br />
Specialists<br />
First-Line<br />
Supervisors of<br />
Correctional<br />
Officers<br />
Correctional<br />
Officers and<br />
Jailers<br />
Police and Sheriff's<br />
Patrol Officers<br />
ANNUAL<br />
OPENINGS<br />
MEDIAN<br />
HOURLY<br />
EARNINGS<br />
RESIDENT<br />
WORKERS<br />
NET<br />
COM-<br />
MUTERS<br />
1,889 185 $34.78 2,778 (889)<br />
273 26 $30.96 446 (173)<br />
145 15 $36.66 203 (58)<br />
239 27 $23.17 336 (97)<br />
42 3 $19.56 70 (28)<br />
103 11 $17.99 138 (35)<br />
36 4 $20.26 60 (24)<br />
410 45 $13.42 610 (200)<br />
767 68 $19.45 898 (131)<br />
33-9032 Security Guards 309 46 $14.23 941 (632)<br />
43-1011<br />
47-1011<br />
47-2061<br />
47-4041<br />
49-1011<br />
First-Line<br />
Supervisors of<br />
Office and Admin.<br />
Support Workers<br />
First-Line Spvs.<br />
of Construction<br />
Trades and<br />
Extraction Workers<br />
Construction<br />
Laborers<br />
Hazardous<br />
Materials Removal<br />
Workers<br />
First-Line Spvs.<br />
of Mechanics,<br />
Installers, and<br />
Repairers<br />
1,615 187 $21.50 2,180 (565)<br />
647 69 $20.54 894 (247)<br />
1,557 185 $12.68 2,022 (465)<br />
24 4 $17.10 27 (3)<br />
540 54 $25.65 715 (175)<br />
TYPICAL<br />
ENTRY LEVEL<br />
EDUCATION<br />
Bachelor's<br />
degree<br />
Bachelor's<br />
degree<br />
Bachelor's<br />
degree<br />
Bachelor's<br />
degree<br />
High school<br />
diploma or<br />
equivalent<br />
Bachelor's<br />
degree<br />
High school<br />
diploma or<br />
equivalent<br />
High school<br />
diploma or<br />
equivalent<br />
High school<br />
diploma or<br />
equivalent<br />
High school<br />
diploma or<br />
equivalent<br />
High school<br />
diploma or<br />
equivalent<br />
High school<br />
diploma or<br />
equivalent<br />
No formal<br />
educational<br />
credential<br />
High school<br />
diploma or<br />
equivalent<br />
High school<br />
diploma or<br />
equivalent<br />
92<br />
COMPREHENSIVE LABOR ANALYSIS: CLARKSVILLE-MONTGOMERY COUNTY
MOC SOC CODE SOC TITLE JOBS<br />
Infantry<br />
Aviation<br />
49-3021<br />
49-3023<br />
49-9043<br />
49-9071<br />
51-1011<br />
51-2021<br />
53-1031<br />
53-3033<br />
11-3071<br />
15-2031<br />
17-3021<br />
43-5032<br />
49-1011<br />
49-3011<br />
53-1011<br />
53-1031<br />
53-2021<br />
53-2022<br />
Automotive Body<br />
and Related<br />
Repairers<br />
Automotive<br />
Service<br />
Technicians and<br />
Mechanics<br />
<strong>Main</strong>tenance<br />
Workers,<br />
Machinery<br />
<strong>Main</strong>tenance and<br />
Repair Workers,<br />
General<br />
First-Line Spvs. of<br />
Production and<br />
Operating Workers<br />
Coil Winders,<br />
Tapers, and<br />
Finishers<br />
First-Line<br />
Supervisors of<br />
Transportation and<br />
Material-Moving<br />
Machine and<br />
Vehicle Operators<br />
Light Truck or<br />
Delivery Services<br />
Drivers<br />
Logistics<br />
Managers<br />
Operations<br />
Research Analysts<br />
Aerospace<br />
Engineering<br />
and Operations<br />
Technicians<br />
Dispatchers,<br />
Except Police, Fire,<br />
and Ambulance<br />
First-Line Spvs.<br />
of Mechanics,<br />
Installers, and<br />
Repairers<br />
Aircraft Mechanics<br />
and Service<br />
Technicians<br />
Aircraft Cargo<br />
Handling<br />
Supervisors<br />
First-Line Spvs. of<br />
Transportation and<br />
Material-Moving<br />
Machine and<br />
Vehicle Operators<br />
Air Traffic<br />
Controllers<br />
Airfield Operations<br />
Specialists<br />
ANNUAL<br />
OPENINGS<br />
MEDIAN<br />
HOURLY<br />
EARNINGS<br />
RESIDENT<br />
WORKERS<br />
NET<br />
COM-<br />
MUTERS<br />
221 22 $17.48 277 (56)<br />
989 101 $15.52 1,232 (243)<br />
251 32 $26.15 288 (37)<br />
1,824 197 $17.60 2,220 (396)<br />
1,434 155 $24.88 1,468 (34)<br />
49 5 $17.22 52 (3)<br />
221 27 $24.34 316 (95)<br />
720 95 $13.04 1,179 (459)<br />
183 17 $32.89 236 (53)<br />
48 6 $30.30 96 (48)<br />
MOC SOC CODE SOC TITLE JOBS<br />
<strong>Main</strong>tenance<br />
11-1021<br />
37-3019<br />
47-1011<br />
47-2141<br />
47-4051<br />
47-4061<br />
49-1011<br />
49-2022<br />
49-3023<br />
49-9041<br />
49-9043<br />
49-9069<br />
49-9071<br />
49-9098<br />
49-9099<br />
51-1011<br />
53-1021<br />
53-1031<br />
General and<br />
Operations<br />
Managers<br />
Grounds<br />
<strong>Main</strong>tenance<br />
Workers, All Other<br />
First-Line Spvs.<br />
of Construction<br />
Trades and<br />
Extraction Workers<br />
Painters,<br />
Construction and<br />
<strong>Main</strong>tenance<br />
Highway<br />
<strong>Main</strong>tenance<br />
Workers<br />
Rail-Track Laying<br />
and <strong>Main</strong>tenance<br />
Equip. Operators<br />
First-Line Spvs.<br />
of Mechanics,<br />
Installers, and<br />
Repairers<br />
Telecom.<br />
Equipment<br />
Installers and<br />
Repairers, Except<br />
Line Installers<br />
Automotive<br />
Service<br />
Technicians and<br />
Mechanics<br />
Industrial<br />
Machinery<br />
Mechanics<br />
<strong>Main</strong>tenance<br />
Workers,<br />
Machinery<br />
Precision<br />
Instrument &<br />
Equip. Repairers,<br />
All Other<br />
<strong>Main</strong>tenance and<br />
Repair Workers,<br />
General<br />
Helpers--<br />
Installation,<br />
<strong>Main</strong>tenance, and<br />
Repair Workers<br />
Installation,<br />
<strong>Main</strong>t., and Repair<br />
Workers, All Other<br />
First-Line Spvs. of<br />
Production and<br />
Operating Workers<br />
First-Line Spvs. of<br />
Helpers, Laborers,<br />
and Material<br />
Movers, Hand<br />
First-Line Spvs. of<br />
Transportation and<br />
Material-Moving<br />
Machine and<br />
Vehicle Operators<br />
ANNUAL<br />
OPENINGS<br />
MEDIAN<br />
HOURLY<br />
EARNINGS<br />
RESIDENT<br />
WORKERS<br />
NET<br />
COM-<br />
MUTERS<br />
1,889 185 $34.78 2,778 (889)<br />
54 8 $9.94 83 (29)<br />
647 69 $20.54 894 (247)<br />
543 47 $12.89 601 (58)<br />
81 11 $13.76 118 (37)<br />
16 Insf. Data $20.96 15 1<br />
540 54 $25.65 715 (175)<br />
307 31 $22.02 420 (113)<br />
989 101 $15.52 1,232 (243)<br />
716 81 $22.73 750 (34)<br />
251 32 $26.15 288 (37)<br />
16 Insf. Data $23.29 22 (6)<br />
1,824 197 $17.60 2,220 (396)<br />
157 21 $13.50 201 (44)<br />
335 36 $14.29 399 (64)<br />
1,434 155 $24.88 1,468 (34)<br />
321 43 $20.56 397 (76)<br />
221 27 $24.34 316 (95)<br />
TYPICAL<br />
ENTRY LEVEL<br />
EDUCATION<br />
Bachelor's<br />
degree<br />
No formal<br />
educational<br />
credential<br />
High school<br />
diploma or<br />
equivalent<br />
No formal<br />
educational<br />
credential<br />
High school<br />
diploma or<br />
equivalent<br />
High school<br />
diploma or<br />
equivalent<br />
High school<br />
diploma or<br />
equivalent<br />
Postsecondary<br />
nondegree<br />
award<br />
Postsecondary<br />
nondegree<br />
award<br />
High school<br />
diploma or<br />
equivalent<br />
High school<br />
diploma or<br />
equivalent<br />
High school<br />
diploma or<br />
equivalent<br />
High school<br />
diploma or<br />
equivalent<br />
High school<br />
diploma or<br />
equivalent<br />
High school<br />
diploma or<br />
equivalent<br />
High school<br />
diploma or<br />
equivalent<br />
High school<br />
diploma or<br />
equivalent<br />
High school<br />
diploma or<br />
equivalent<br />
94<br />
COMPREHENSIVE LABOR ANALYSIS: CLARKSVILLE-MONTGOMERY COUNTY
MOC SOC CODE SOC TITLE JOBS<br />
Logistics<br />
11-3061<br />
11-3071<br />
11-3121<br />
11-9021<br />
11-9141<br />
11-9199<br />
13-1022<br />
13-1023<br />
13-1041<br />
Purchasing<br />
Managers<br />
Storage and<br />
Distribution<br />
Managers<br />
Human Resources<br />
Managers<br />
Construction<br />
Managers<br />
Property, Real<br />
Estate, and<br />
Community<br />
Association<br />
Managers<br />
Supply Chain<br />
Managers<br />
Wholesale and<br />
Retail Buyers,<br />
Except Farm<br />
Products<br />
Purchasing Agents,<br />
Except Wholesale,<br />
Retail, and Farm<br />
Products<br />
Government<br />
Property<br />
Inspectors and<br />
Investigators<br />
ANNUAL<br />
OPENINGS<br />
MEDIAN<br />
HOURLY<br />
EARNINGS<br />
RESIDENT<br />
WORKERS<br />
NET<br />
COM-<br />
MUTERS<br />
81 7 $36.54 108 (27)<br />
183 17 $32.89 236 (53)<br />
145 15 $36.66 203 (58)<br />
465 33 $17.12 612 (147)<br />
264 25 $21.81 358 (94)<br />
953 81 $18.93 1,089 (136)<br />
134 17 $23.30 179 (45)<br />
268 27 $24.40 322 (54)<br />
171 20 $22.98 293 (122)<br />
13-1051 Cost Estimators 157 18 $26.71 237 (80)<br />
13-1081 Logisticians 154 15 $30.32 198 (44)<br />
13-1111<br />
43-1011<br />
43-3061<br />
Management<br />
Analysts<br />
First-Line<br />
Supervisors<br />
of Office and<br />
Administrative<br />
Support Workers<br />
Procurement<br />
Clerks<br />
333 41 $31.14 526 (193)<br />
1,615 187 $21.50 2,180 (565)<br />
135 13 $20.26 147 (12)<br />
43-4151 Order Clerks 254 34 $15.19 305 (51)<br />
43-5011<br />
43-5061<br />
43-5071<br />
43-5081<br />
Cargo and Freight<br />
Agents<br />
Production,<br />
Planning, and<br />
Expediting Clerks<br />
Shipping,<br />
Receiving, and<br />
Traffic Clerks<br />
Stock Clerks /<br />
Marking Clerks<br />
(Warehouse,<br />
Storage Yard, Sales<br />
Floor)<br />
19 2 $18.33 41 (22)<br />
408 46 $21.31 495 (87)<br />
749 95 $13.97 974 (225)<br />
2,797 424 $10.92 3,382 (585)<br />
TYPICAL<br />
ENTRY LEVEL<br />
EDUCATION<br />
Bachelor's<br />
degree<br />
High school<br />
diploma or<br />
equivalent<br />
Bachelor's<br />
degree<br />
Bachelor's<br />
degree<br />
High school<br />
diploma or<br />
equivalent<br />
Bachelor's<br />
degree<br />
Bachelor's<br />
degree<br />
Bachelor's<br />
degree<br />
Bachelor's<br />
degree<br />
Bachelor's<br />
degree<br />
Bachelor's<br />
degree<br />
Bachelor's<br />
degree<br />
High school<br />
diploma or<br />
equivalent<br />
High school<br />
diploma or<br />
equivalent<br />
High school<br />
diploma or<br />
equivalent<br />
High school<br />
diploma or<br />
equivalent<br />
High school<br />
diploma or<br />
equivalent<br />
High school<br />
diploma or<br />
equivalent<br />
No formal<br />
educational<br />
credential<br />
Conclusion 95
MOC SOC CODE SOC TITLE JOBS<br />
Logistics<br />
Field Artillery<br />
53-1021<br />
53-1031<br />
53-7062<br />
53-7064<br />
11-1021<br />
11-3021<br />
11-3121<br />
13-1151<br />
15-1121<br />
15-1141<br />
15-1142<br />
15-1199<br />
15-2031<br />
17-3031<br />
19-2021<br />
19-2099<br />
First-Line<br />
Supervisors of<br />
Helpers, Laborers,<br />
and Material<br />
Movers, Hand<br />
First-Line<br />
Supervisors of<br />
Transportation and<br />
Material-Moving<br />
Machine and<br />
Vehicle Operators<br />
Laborers and<br />
Freight, Stock, and<br />
Material Movers,<br />
Hand<br />
Packers and<br />
Packagers, Hand<br />
General and<br />
Operations<br />
Managers<br />
Computer and<br />
Information<br />
Systems Managers<br />
Human Resources<br />
Managers<br />
Training and<br />
Development<br />
Specialists<br />
Computer<br />
Systems Analysts<br />
Database<br />
Administrators<br />
Network and<br />
Computer<br />
Systems<br />
Administrators<br />
Information<br />
Technology<br />
Project Managers<br />
Operations<br />
Research Analysts<br />
Surveying<br />
Technicians<br />
Atmospheric and<br />
Space Scientists<br />
Remote Sensing<br />
Scientists and<br />
Technologists<br />
ANNUAL<br />
OPENINGS<br />
MEDIAN<br />
HOURLY<br />
EARNINGS<br />
RESIDENT<br />
WORKERS<br />
NET<br />
COM-<br />
MUTERS<br />
321 43 $20.56 397 (76)<br />
221 27 $24.34 316 (95)<br />
3,860 642 $11.76 4,877 (1,017)<br />
1,085 196 $10.33 1,233 (148)<br />
1,889 185 $34.78 2,778 (889)<br />
160 16 $42.86 311 (151)<br />
145 15 $36.66 203 (58)<br />
239 27 $23.17 336 (97)<br />
230 23 $30.01 409 (179)<br />
38 4 $32.15 72 (34)<br />
163 14 $29.81 285 (122)<br />
280 22 $31.41 344 (64)<br />
48 6 $30.30 96 (48)<br />
42 3 $19.56 70 (28)<br />
MOC SOC CODE SOC TITLE JOBS<br />
Field Artillery<br />
Medical<br />
ANNUAL<br />
OPENINGS<br />
MEDIAN<br />
HOURLY<br />
EARNINGS<br />
RESIDENT<br />
WORKERS<br />
NET<br />
COM-<br />
MUTERS<br />
43-9021 Data Entry Keyers 155 18 $11.99 262 (107)<br />
47-2073<br />
49-1011<br />
49-2022<br />
49-2094<br />
49-3031<br />
49-3042<br />
49-9071<br />
49-9098<br />
49-9099<br />
11-9111<br />
11-9161<br />
21-1011<br />
21-1022<br />
21-1023<br />
Operating<br />
Engineers<br />
and Other<br />
Construction<br />
Equipment<br />
Operators<br />
First-Line<br />
Supervisors<br />
of Mechanics,<br />
Installers, and<br />
Repairers<br />
Telecom. Equip.<br />
Installers and<br />
Repairers, Except<br />
Line Installers<br />
Electrical and<br />
Electronics<br />
Repairers,<br />
Commercial<br />
and Industrial<br />
Equipment<br />
Bus and Truck<br />
Mechanics and<br />
Diesel Engine<br />
Specialists<br />
Mobile Heavy<br />
Equipment<br />
Mechanics, Except<br />
Engines<br />
<strong>Main</strong>tenance and<br />
Repair Workers,<br />
General<br />
Helpers--<br />
Installation,<br />
<strong>Main</strong>tenance, and<br />
Repair Workers<br />
Installation,<br />
<strong>Main</strong>tenance, and<br />
Repair Workers, All<br />
Other<br />
Medical and<br />
Health Services<br />
Managers<br />
Emergency<br />
Management<br />
Directors<br />
Substance Abuse<br />
and Behavioral<br />
Disorder<br />
Counselors<br />
Healthcare Social<br />
Workers<br />
Mental Health and<br />
Substance Abuse<br />
Social Workers<br />
423 51 $16.20 531 (108)<br />
540 54 $25.65 715 (175)<br />
307 31 $22.02 420 (113)<br />
55 6 $26.03 72 (17)<br />
243 28 $18.75 375 (132)<br />
169 19 $19.74 230 (61)<br />
1,824 197 $17.60 2,220 (396)<br />
157 21 $13.50 201 (44)<br />
335 36 $14.29 399 (64)<br />
415 37 $38.03 608 (193)<br />
11 Insf. Data $25.35 12 (1)<br />
63 10 $19.52 80 (17)<br />
71 10 $23.98 133 (62)<br />
64 11 $15.95 95 (31)<br />
21-1091 Health Educators 36 5 $18.61 57 (21)<br />
29-1031<br />
Dietitians and<br />
Nutritionists<br />
50 4 $22.01 69 (19)<br />
TYPICAL<br />
ENTRY LEVEL<br />
EDUCATION<br />
High school<br />
diploma or<br />
equivalent<br />
High school<br />
diploma or<br />
equivalent<br />
High school<br />
diploma or<br />
equivalent<br />
Postsecondary<br />
nondegree<br />
award<br />
Postsecondary<br />
nondegree<br />
award<br />
High school<br />
diploma or<br />
equivalent<br />
High school<br />
diploma or<br />
equivalent<br />
High school<br />
diploma or<br />
equivalent<br />
High school<br />
diploma or<br />
equivalent<br />
High school<br />
diploma or<br />
equivalent<br />
Bachelor's<br />
degree<br />
Bachelor's<br />
degree<br />
Bachelor's<br />
degree<br />
Master's<br />
degree<br />
Bachelor's<br />
degree<br />
Bachelor's<br />
degree<br />
Bachelor's<br />
degree<br />
Conclusion 97
MOC SOC CODE SOC TITLE JOBS<br />
Medical<br />
ANNUAL<br />
OPENINGS<br />
MEDIAN<br />
HOURLY<br />
EARNINGS<br />
RESIDENT<br />
WORKERS<br />
NET<br />
COM-<br />
MUTERS<br />
29-1051 Pharmacists 368 21 $54.61 517 (149)<br />
29-1069<br />
29-1126<br />
Physicians and<br />
Surgeons, All<br />
Other<br />
Respiratory<br />
Therapists<br />
203 12 $107.82 344 (141)<br />
95 6 $22.21 173 (78)<br />
29-1141 Registered Nurses 2,245 150 $26.64 3,524 (1,279)<br />
29-2012<br />
Medical and<br />
Clinical Laboratory<br />
Technicians<br />
187 11 $19.41 359 (172)<br />
29-2021 Dental Hygienists 240 19 $30.82 296 (56)<br />
29-2031<br />
29-2034<br />
29-2041<br />
29-2051<br />
29-2052<br />
29-2053<br />
29-2054<br />
29-2055<br />
29-2057<br />
29-2061<br />
29-2071<br />
29-2081<br />
29-2091<br />
29-2099<br />
Cardiovascular<br />
Technologists and<br />
Technicians<br />
Radiologic<br />
Technologists<br />
Emergency<br />
Medical<br />
Technicians and<br />
Paramedics<br />
Dietetic<br />
Technicians<br />
Pharmacy<br />
Technicians<br />
Psychiatric<br />
Technicians<br />
Respiratory<br />
Therapy<br />
Technicians<br />
Surgical<br />
Technologists<br />
Ophthalmic<br />
Medical<br />
Technicians<br />
Licensed Practical<br />
and Licensed<br />
Vocational Nurses<br />
Medical Records<br />
and Health<br />
Information<br />
Technicians<br />
Opticians,<br />
Dispensing<br />
Orthotists and<br />
Prosthetists<br />
Radiologic<br />
Technicians<br />
29 2 $19.02 52 (23)<br />
160 9 $23.42 278 (118)<br />
272 17 $13.75 394 (122)<br />
33 3 $11.09 34 (1)<br />
692 58 $13.26 879 (187)<br />
49 4 $10.67 53 (4)<br />
MOC SOC CODE SOC TITLE JOBS<br />
Medical<br />
Administrative<br />
31-2022<br />
Physical Therapist<br />
Aides<br />
ANNUAL<br />
OPENINGS<br />
MEDIAN<br />
HOURLY<br />
EARNINGS<br />
RESIDENT<br />
WORKERS<br />
NET<br />
COM-<br />
MUTERS<br />
58 11 $10.27 92 (34)<br />
31-9091 Dental Assistants 444 59 $16.78 511 (67)<br />
31-9092 Medical Assistants 562 83 $13.36 835 (273)<br />
31-9093<br />
Medical<br />
Equipment<br />
Preparers<br />
23 3 $14.39 38 (15)<br />
31-9095 Pharmacy Aides 34 5 $9.38 45 (11)<br />
31-9097 Phlebotomists 84 11 $11.60 140 (56)<br />
33-3021<br />
35-2012<br />
43-6013<br />
51-9081<br />
51-9082<br />
11-3011<br />
11-3121<br />
13-1071<br />
13-1075<br />
13-1141<br />
13-1151<br />
23-1012<br />
23-2011<br />
Immigration<br />
and Customs<br />
Inspectors<br />
Cooks, Institution<br />
and Cafeteria<br />
Medical<br />
Secretaries<br />
Dental Laboratory<br />
Technicians<br />
Medical Appliance<br />
Technicians<br />
Administrative<br />
Services Managers<br />
Human Resources<br />
Managers<br />
Human Resources<br />
Specialists<br />
Labor Relations<br />
Specialists<br />
Compensation,<br />
Benefits, and<br />
Job Analysis<br />
Specialists<br />
Training and<br />
Development<br />
Specialists<br />
Judicial Law<br />
Clerks<br />
Paralegals and<br />
Legal Assistants<br />
65 8 $23.29 96 (31)<br />
589 88 $10.24 734 (145)<br />
317 46 $13.07 473 (156)<br />
18 3 $17.22 20 (2)<br />
37 5 $15.20 105 (68)<br />
273 26 $30.96 446 (173)<br />
145 15 $36.66 203 (58)<br />
443 50 $24.63 658 (215)<br />
21 3 $29.41 37 (16)<br />
55 6 $26.05 100 (45)<br />
239 27 $23.17 336 (97)<br />
MOC SOC CODE SOC TITLE JOBS<br />
Administrative<br />
Supply and Services<br />
43-1011<br />
43-3051<br />
43-4161<br />
43-6011<br />
43-6014<br />
First-Line<br />
Supervisors<br />
of Office and<br />
Administrative<br />
Support Workers<br />
Payroll and<br />
Timekeeping<br />
Clerks<br />
Human Resources<br />
Assistants, Except<br />
Payroll and<br />
Timekeeping<br />
Executive<br />
Secretaries<br />
and Executive<br />
Administrative<br />
Assistants<br />
Secretaries and<br />
Administrative<br />
Assistants, Except<br />
Legal, Medical,<br />
and Executive<br />
ANNUAL<br />
OPENINGS<br />
MEDIAN<br />
HOURLY<br />
EARNINGS<br />
RESIDENT<br />
WORKERS<br />
NET<br />
COM-<br />
MUTERS<br />
1,615 187 $21.50 2,180 (565)<br />
184 19 $18.00 234 (50)<br />
147 16 $18.65 187 (40)<br />
357 42 $19.90 620 (263)<br />
2,874 320 $13.75 3,915 (1,041)<br />
43-9021 Data Entry Keyers 155 18 $11.99 262 (107)<br />
43-9022<br />
43-9061<br />
11-3061<br />
11-3071<br />
11-9021<br />
11-9051<br />
11-9199<br />
13-1022<br />
13-1023<br />
Word Processors<br />
and Typists<br />
Office Clerks,<br />
General<br />
Purchasing<br />
Managers<br />
Storage and<br />
Distribution/<br />
Transportation<br />
Managers<br />
Construction<br />
Managers<br />
Food Service<br />
Managers<br />
Supply Chain<br />
Managers<br />
Wholesale and<br />
Retail Buyers,<br />
Except Farm<br />
Products<br />
Purchasing Agents,<br />
Except Wholesale,<br />
Retail, and Farm<br />
Products<br />
34 4 $15.46 34 0<br />
2,307 301 $13.79 3,370 (1,063)<br />
81 7 $36.54 108 (27)<br />
183 17 $32.89 236 (53)<br />
465 33 $17.12 612 (147)<br />
593 72 $18.62 704 (111)<br />
953 81 $18.93 1,089 (136)<br />
134 17 $23.30 179 (45)<br />
268 27 $24.40 322 (54)<br />
13-1051 Cost Estimators 157 18 $26.71 237 (80)<br />
13-1081 Logisticians 154 15 $30.32 198 (44)<br />
13-1111<br />
13-1151<br />
Management<br />
Analysts<br />
Training and<br />
Development<br />
Specialists<br />
333 41 $31.14 526 (193)<br />
239 27 $23.17 336 (97)<br />
TYPICAL<br />
ENTRY LEVEL<br />
EDUCATION<br />
High school<br />
diploma or<br />
equivalent<br />
High school<br />
diploma or<br />
equivalent<br />
Associate's<br />
degree<br />
High school<br />
diploma or<br />
equivalent<br />
High school<br />
diploma or<br />
equivalent<br />
High school<br />
diploma or<br />
equivalent<br />
High school<br />
diploma or<br />
equivalent<br />
High school<br />
diploma or<br />
equivalent<br />
Bachelor's<br />
degree<br />
High school<br />
diploma or<br />
equivalent<br />
Bachelor's<br />
degree<br />
High school<br />
diploma or<br />
equivalent<br />
Bachelor's<br />
degree<br />
Bachelor's<br />
degree<br />
Bachelor's<br />
degree<br />
Bachelor's<br />
degree<br />
Bachelor's<br />
degree<br />
Bachelor's<br />
degree<br />
Bachelor's<br />
degree<br />
100<br />
COMPREHENSIVE LABOR ANALYSIS: CLARKSVILLE-MONTGOMERY COUNTY
MOC SOC CODE SOC TITLE JOBS<br />
Supply and Services<br />
Signal/Communication<br />
43-3031<br />
43-3061<br />
Bookkeeping,<br />
Accounting, and<br />
Auditing Clerks<br />
Procurement<br />
Clerks<br />
ANNUAL<br />
OPENINGS<br />
MEDIAN<br />
HOURLY<br />
EARNINGS<br />
RESIDENT<br />
WORKERS<br />
NET<br />
COM-<br />
MUTERS<br />
1,576 178 $16.48 2,183 (607)<br />
135 13 $20.26 147 (12)<br />
43-4151 Order Clerks 254 34 $15.19 305 (51)<br />
43-5061<br />
43-5071<br />
43-5081<br />
51-1011<br />
53-1021<br />
53-3032<br />
53-7062<br />
53-7064<br />
11-1021<br />
11-3021<br />
11-3121<br />
11-9161<br />
13-1111<br />
13-1151<br />
15-1122<br />
15-1141<br />
Production,<br />
Planning, and<br />
Expediting Clerks<br />
Shipping,<br />
Receiving, and<br />
Traffic Clerks<br />
Stock Clerks-<br />
Stockroom,<br />
Warehouse,<br />
Storage Yard,<br />
Sales Floor<br />
First-Line<br />
Supervisors of<br />
Production and<br />
Operating Workers<br />
First-Line<br />
Supervisors of<br />
Helpers, Laborers,<br />
and Material<br />
Movers, Hand<br />
Heavy and Tractor-<br />
Trailer Truck<br />
Drivers<br />
Laborers and<br />
Freight, Stock, and<br />
Material Movers,<br />
Hand<br />
Packers and<br />
Packagers, Hand<br />
General and<br />
Operations<br />
Managers<br />
Computer and<br />
Information<br />
Systems Managers<br />
Human Resources<br />
Managers<br />
Emergency<br />
Management<br />
Directors<br />
Management<br />
Analysts<br />
Training and<br />
Development<br />
Specialists<br />
Information<br />
Security Analysts<br />
Database<br />
Administrators<br />
408 46 $21.31 495 (87)<br />
749 95 $13.97 974 (225)<br />
2,797 424 $10.92 3,382 (585)<br />
1,434 155 $24.88 1,468 (34)<br />
321 43 $20.56 397 (76)<br />
2,271 273 $17.38 3,430 (1,159)<br />
3,860 642 $11.76 4,877 (1,017)<br />
1,085 196 $10.33 1,233 (148)<br />
1,889 185 $34.78 2,778 (889)<br />
160 16 $42.86 311 (151)<br />
145 15 $36.66 203 (58)<br />
11 Insf. Data $25.35 12 (1)<br />
333 41 $31.14 526 (193)<br />
239 27 $23.17 336 (97)<br />
27 3 $31.44 49 (22)<br />
38 4 $32.15 72 (34)<br />
TYPICAL<br />
ENTRY LEVEL<br />
EDUCATION<br />
Some college,<br />
no degree<br />
High school<br />
diploma or<br />
equivalent<br />
High school<br />
diploma or<br />
equivalent<br />
High school<br />
diploma or<br />
equivalent<br />
High school<br />
diploma or<br />
equivalent<br />
No formal<br />
educational<br />
credential<br />
High school<br />
diploma or<br />
equivalent<br />
High school<br />
diploma or<br />
equivalent<br />
Postsecondary<br />
nondegree<br />
award<br />
No formal<br />
educational<br />
credential<br />
No formal<br />
educational<br />
credential<br />
Bachelor's<br />
degree<br />
Bachelor's<br />
degree<br />
Bachelor's<br />
degree<br />
Bachelor's<br />
degree<br />
Bachelor's<br />
degree<br />
Bachelor's<br />
degree<br />
Bachelor's<br />
degree<br />
Bachelor's<br />
degree<br />
Conclusion 101
MOC SOC CODE SOC TITLE JOBS<br />
Signal/Communication<br />
15-1142<br />
15-1143<br />
15-1152<br />
15-1199<br />
15-2031<br />
17-3023<br />
Network and<br />
Computer<br />
Systems<br />
Administrators<br />
Telecom.<br />
Engineering<br />
Specialists<br />
Computer<br />
Network Support<br />
Specialists<br />
Information<br />
Technology<br />
Project Managers<br />
Operations<br />
Research Analysts<br />
Electronics<br />
Engineering<br />
Technicians<br />
ANNUAL<br />
OPENINGS<br />
MEDIAN<br />
HOURLY<br />
EARNINGS<br />
RESIDENT<br />
WORKERS<br />
NET<br />
COM-<br />
MUTERS<br />
163 14 $29.81 285 (122)<br />
52 4 $37.24 105 (53)<br />
92 9 $25.81 169 (77)<br />
280 22 $31.41 344 (64)<br />
48 6 $30.30 96 (48)<br />
154 12 $25.04 177 (23)<br />
27-3042 Technical Writers 24 3 $24.44 36 (12)<br />
27-3091<br />
Interpreters and<br />
Translators<br />
39 5 $19.36 50 (11)<br />
27-4013 Radio Operators
MOC SOC CODE SOC TITLE JOBS<br />
Signal/Communication<br />
Corps of Engineers<br />
49-2093<br />
49-2094<br />
49-2097<br />
49-9052<br />
49-9098<br />
11-1021<br />
11-3021<br />
11-9021<br />
11-9041<br />
11-9161<br />
13-1151<br />
15-1141<br />
15-1199<br />
17-1021<br />
Electrical and<br />
Electronics<br />
Installers and<br />
Repairers,<br />
Transportation<br />
Equipment<br />
Electrical and<br />
Electronics<br />
Repairers,<br />
Commercial<br />
and Industrial<br />
Equipment<br />
Electronic Home<br />
Entertainment<br />
Equipment<br />
Installers and<br />
Repairers<br />
Telecom. Line<br />
Installers and<br />
Repairers<br />
Helpers--<br />
Installation,<br />
<strong>Main</strong>tenance, and<br />
Repair Workers<br />
General and<br />
Operations<br />
Managers<br />
Computer and<br />
Information<br />
Systems Managers<br />
Construction<br />
Managers<br />
Architectural<br />
and Engineering<br />
Managers<br />
Emergency<br />
Management<br />
Directors<br />
Training and<br />
Development<br />
Specialists<br />
Database<br />
Administrators<br />
Geospatial<br />
Information<br />
Scientists and<br />
Technicians/<br />
Technologists<br />
Cartographers and<br />
Photogrammetrists<br />
ANNUAL<br />
OPENINGS<br />
MEDIAN<br />
HOURLY<br />
EARNINGS<br />
RESIDENT<br />
WORKERS<br />
NET<br />
COM-<br />
MUTERS<br />
19 2 $22.23 17 2<br />
55 6 $26.03 72 (17)<br />
26 3 $15.11 32 (6)<br />
63 8 $19.77 78 (15)<br />
157 21 $13.50 201 (44)<br />
1,889 185 $34.78 2,778 (889)<br />
160 16 $42.86 311 (151)<br />
465 33 $17.12 612 (147)<br />
128 11 $48.38 184 (56)<br />
11 Insf. Data $25.35 12 (1)<br />
239 27 $23.17 336 (97)<br />
38 4 $32.15 72 (34)<br />
280 22 $31.41 344 (64)<br />
MOC SOC CODE SOC TITLE JOBS<br />
Corps of Engineers<br />
Military Police<br />
47-1011<br />
47-2061<br />
47-2072<br />
47-2073<br />
47-4011<br />
47-4051<br />
47-4099<br />
47-5021<br />
47-5031<br />
53-1031<br />
53-3032<br />
53-7021<br />
53-7032<br />
53-7051<br />
11-3121<br />
11-3131<br />
11-9039<br />
11-9151<br />
11-9161<br />
First-Line Spvs.of<br />
Constr. Trades and<br />
Extraction Workers<br />
Construction<br />
Laborers<br />
Pile-Driver<br />
Operators<br />
Operating<br />
Engineers<br />
and Other<br />
Construction<br />
Equip. Operators<br />
Construction<br />
and Building<br />
Inspectors<br />
Highway<br />
<strong>Main</strong>tenance<br />
Workers<br />
Construction and<br />
Related Workers,<br />
All Other<br />
Earth Drillers,<br />
Except Oil and Gas<br />
Explosives<br />
Workers, Ordnance<br />
Handling Experts,<br />
and Blasters<br />
First-Line<br />
Supervisors of<br />
Transportation and<br />
Material-Moving<br />
Machine and<br />
Vehicle Operators<br />
Heavy and Tractor-<br />
Trailer Truck<br />
Drivers<br />
Crane and Tower<br />
Operators<br />
Excavating and<br />
Loading Machine<br />
and Dragline<br />
Operators<br />
Industrial Truck<br />
and Tractor<br />
Operators<br />
Human Resources<br />
Managers<br />
Training and<br />
Development<br />
Managers<br />
Fitness and<br />
Wellness<br />
Coordinators<br />
Social and<br />
Community<br />
Service Managers<br />
Emergency<br />
Management<br />
Directors<br />
ANNUAL<br />
OPENINGS<br />
MEDIAN<br />
HOURLY<br />
EARNINGS<br />
RESIDENT<br />
WORKERS<br />
NET<br />
COM-<br />
MUTERS<br />
647 69 $20.54 894 (247)<br />
1,557 185 $12.68 2,022 (465)<br />
MOC SOC CODE SOC TITLE JOBS<br />
Military Police<br />
11-9199<br />
13-1151<br />
13-1199<br />
19-4092<br />
21-1092<br />
33-1011<br />
33-1012<br />
33-1099<br />
Security, Loss<br />
Prevention<br />
Managers<br />
Training and<br />
Development<br />
Specialists<br />
Security<br />
Management<br />
Specialists<br />
Forensic Science<br />
Technicians<br />
Probation Officers<br />
and Correctional<br />
Treatment<br />
Specialists<br />
First-Line<br />
Supervisors of<br />
Correctional<br />
Officers<br />
First-Line<br />
Supervisors<br />
of Police and<br />
Detectives<br />
First-Line<br />
Supervisors of<br />
Protective Service<br />
Workers, All<br />
Others<br />
ANNUAL<br />
OPENINGS<br />
MEDIAN<br />
HOURLY<br />
EARNINGS<br />
RESIDENT<br />
WORKERS<br />
NET<br />
COM-<br />
MUTERS<br />
953 81 $18.93 1,089 (136)<br />
443 50 $24.63 658 (215)<br />
761 80 $28.39 1,015 (254)<br />
19 3 $20.49 33 (14)<br />
103 11 $17.99 138 (35)<br />
36 4 $20.26 60 (24)<br />
224 18 $21.98 272 (48)<br />
41 5 $17.73 73 (32)<br />
33-3011 Bailiffs 79 7 $10.59 83 (4)<br />
33-3012<br />
33-3021<br />
33-3031<br />
33-3041<br />
33-3051<br />
33-3052<br />
33-9011<br />
33-9021<br />
Correctional<br />
Officers and<br />
Jailers<br />
Detectives,<br />
Criminal Invest.,<br />
Special Agents,<br />
Intel. Analysts,<br />
Immigration<br />
and Customers<br />
Inspectors, Police<br />
Identification and<br />
Records Officers<br />
Fish and Game<br />
Wardens<br />
Parking<br />
Enforcement<br />
Workers<br />
Police and Sheriffs<br />
Patrol Officers and<br />
Deputy Sheriffs<br />
Transit and<br />
Railroad Police<br />
Animal Control<br />
Workers<br />
Private Detectives<br />
and Investigators<br />
410 45 $13.42 610 (200)<br />
65 8 $23.29 96 (31)<br />
11 Insf. Data $26.15 18 (7)<br />
MOC SOC CODE SOC TITLE JOBS<br />
Military Police<br />
Electronics/Missile <strong>Main</strong>tenance<br />
33-9031<br />
Gaming Surveill.<br />
Officers<br />
and Gaming<br />
Investigators<br />
ANNUAL<br />
OPENINGS<br />
MEDIAN<br />
HOURLY<br />
EARNINGS<br />
RESIDENT<br />
WORKERS<br />
MOC SOC CODE SOC TITLE JOBS<br />
Electronics/Missile <strong>Main</strong>tenance<br />
Chemical<br />
49-2021<br />
49-2022<br />
49-2091<br />
49-2093<br />
49-2094<br />
49-2096<br />
49-2097<br />
49-9031<br />
49-9098<br />
51-2022<br />
51-9061<br />
Radio, Cellular, and<br />
Tower Equipment<br />
Installers and<br />
Repairers<br />
Telecom. Equip.<br />
Installers and<br />
Repairers, Except<br />
Line Installers<br />
Avionics<br />
Technicians<br />
Electrical and<br />
Electronics<br />
Installers and<br />
Repairers,<br />
Transportation<br />
Equipment<br />
Electrical and<br />
Electronics<br />
Repairers,<br />
Commercial<br />
and Industrial<br />
Equipment<br />
Electronic Equip.<br />
Installers and<br />
Repairers, Motor<br />
Vehicles<br />
Electronic Home<br />
Entertainment<br />
Equipment<br />
Installers and<br />
Repairers<br />
Home Appliance<br />
Repairers<br />
Helpers--<br />
Installation,<br />
<strong>Main</strong>tenance, and<br />
Repair Workers<br />
Electrical and<br />
Electronic<br />
Equipment<br />
Assemblers<br />
Inspectors, Testers,<br />
Sorters, Samplers,<br />
and Weighers<br />
ANNUAL<br />
OPENINGS<br />
MEDIAN<br />
HOURLY<br />
EARNINGS<br />
RESIDENT<br />
WORKERS<br />
NET<br />
COM-<br />
MUTERS<br />
12 Insf. Data $23.93 19 (7)<br />
307 31 $22.02 420 (113)<br />
MOC SOC CODE SOC TITLE JOBS<br />
Chemical<br />
Armor<br />
33-1021<br />
33-2011<br />
47-4041<br />
49-1011<br />
49-2092<br />
49-9021<br />
49-9041<br />
49-9071<br />
49-9098<br />
51-8021<br />
51-8031<br />
51-9011<br />
11-1021<br />
11-3071<br />
11-3131<br />
13-1151<br />
Municipal Fire<br />
Fighting and<br />
Prevention<br />
Supervisors<br />
Municipal<br />
Firefighters<br />
Hazardous<br />
Materials Removal<br />
Workers<br />
First-Line<br />
Supervisors<br />
of Mechanics,<br />
Installers, and<br />
Repairers<br />
Electric Motor,<br />
Power Tool, and<br />
Related Repairers<br />
Heating and Air<br />
Conditioning<br />
Mechanics and<br />
Installers<br />
Industrial<br />
Machinery<br />
Mechanics<br />
<strong>Main</strong>tenance and<br />
Repair Workers,<br />
General<br />
Helpers--<br />
Installation,<br />
<strong>Main</strong>tenance, and<br />
Repair Workers<br />
Stationary<br />
Engineers and<br />
Boiler Operators<br />
Water and<br />
Wastewater<br />
Treatment Plant<br />
and System<br />
Operators<br />
Chemical<br />
Equipment<br />
Operators and<br />
Tenders<br />
General and<br />
Operations<br />
Managers<br />
Transportation,<br />
Storage and<br />
Distribution<br />
Managers<br />
Training and<br />
Development<br />
Managers<br />
Training and<br />
Development<br />
Specialists<br />
ANNUAL<br />
OPENINGS<br />
MEDIAN<br />
HOURLY<br />
EARNINGS<br />
RESIDENT<br />
WORKERS<br />
NET<br />
COM-<br />
MUTERS<br />
102 8 $24.20 124 (22)<br />
332 29 $17.70 370 (38)<br />
24 4 $17.10 27 (3)<br />
540 54 $25.65 715 (175)<br />
MOC SOC CODE SOC TITLE JOBS<br />
Armor<br />
Intelligence<br />
33-1011<br />
33-1012<br />
33-3012<br />
33-3021<br />
First-Line<br />
Supervisors of<br />
Correctional<br />
Officers<br />
First-Line<br />
Supervisors<br />
of Police and<br />
Detectives<br />
Correctional<br />
Officers and<br />
Jailers<br />
Intelligence<br />
Analysts<br />
ANNUAL<br />
OPENINGS<br />
MEDIAN<br />
HOURLY<br />
EARNINGS<br />
RESIDENT<br />
WORKERS<br />
NET<br />
COM-<br />
MUTERS<br />
36 4 $20.26 60 (24)<br />
224 18 $21.98 272 (48)<br />
410 45 $13.42 610 (200)<br />
65 8 $23.29 96 (31)<br />
33-9032 Security Guards 309 46 $14.23 941 (632)<br />
47-2061<br />
47-4041<br />
49-9043<br />
11-1021<br />
11-3021<br />
11-3121<br />
11-9041<br />
11-9161<br />
Construction<br />
Laborers<br />
Hazardous<br />
Materials Removal<br />
Workers<br />
<strong>Main</strong>tenance<br />
Workers,<br />
Machinery<br />
General and<br />
Operations<br />
Managers<br />
Computer and<br />
Information<br />
Systems Managers<br />
Human Resources<br />
Managers<br />
Architectural<br />
and Engineering<br />
Managers<br />
Emergency<br />
Management<br />
Directors<br />
1,557 185 $12.68 2,022 (465)<br />
24 4 $17.10 27 (3)<br />
251 32 $26.15 288 (37)<br />
1,889 185 $34.78 2,778 (889)<br />
160 16 $42.86 311 (151)<br />
145 15 $36.66 203 (58)<br />
128 11 $48.38 184 (56)<br />
11 Insf. Data $25.35 12 (1)<br />
11-9199 Security Managers 953 81 $18.93 1,089 (136)<br />
13-1111<br />
13-1151<br />
13-1199<br />
15-1121<br />
15-1122<br />
15-1141<br />
15-1142<br />
Management<br />
Analysts<br />
Training and<br />
Development<br />
Specialists<br />
Security<br />
Management<br />
Specialists<br />
Computer<br />
Systems Analysts<br />
Information<br />
Security Analysts<br />
Database<br />
Administrators<br />
Network and<br />
Computer<br />
Systems<br />
Administrators<br />
333 41 $31.14 526 (193)<br />
239 27 $23.17 336 (97)<br />
761 80 $28.39 1,015 (254)<br />
230 23 $30.01 409 (179)<br />
27 3 $31.44 49 (22)<br />
38 4 $32.15 72 (34)<br />
163 14 $29.81 285 (122)<br />
TYPICAL<br />
ENTRY LEVEL<br />
EDUCATION<br />
High school<br />
diploma or<br />
equivalent<br />
High school<br />
diploma or<br />
equivalent<br />
High school<br />
diploma or<br />
equivalent<br />
High school<br />
diploma or<br />
equivalent<br />
High school<br />
diploma or<br />
equivalent<br />
No formal<br />
educational<br />
credential<br />
High school<br />
diploma or<br />
equivalent<br />
High school<br />
diploma or<br />
equivalent<br />
Bachelor's<br />
degree<br />
Bachelor's<br />
degree<br />
Bachelor's<br />
degree<br />
Bachelor's<br />
degree<br />
Bachelor's<br />
degree<br />
Bachelor's<br />
degree<br />
Bachelor's<br />
degree<br />
Bachelor's<br />
degree<br />
Bachelor's<br />
degree<br />
Bachelor's<br />
degree<br />
Bachelor's<br />
degree<br />
Bachelor's<br />
degree<br />
Bachelor's<br />
degree<br />
Conclusion 109
MOC SOC CODE SOC TITLE JOBS<br />
Intelligence<br />
15-1143<br />
15-1199<br />
15-2031<br />
17-1021<br />
17-3031<br />
19-2099<br />
19-4099<br />
Computer Network<br />
Architects<br />
Geospatial<br />
Information<br />
Scientists and<br />
Technologists<br />
Operations<br />
Research Analysts<br />
Cartographers and<br />
Photogrammetrists<br />
Mapping<br />
Technicians<br />
Remote Sensing<br />
Scientists and<br />
Technologists<br />
Remote Sensing<br />
Technicians<br />
ANNUAL<br />
OPENINGS<br />
MEDIAN<br />
HOURLY<br />
EARNINGS<br />
RESIDENT<br />
WORKERS<br />
NET<br />
COM-<br />
MUTERS<br />
52 4 $37.24 105 (53)<br />
280 22 $31.41 344 (64)<br />
48 6 $30.30 96 (48)<br />
MOC SOC CODE SOC TITLE JOBS<br />
Intelligence<br />
Air Defense Artillery<br />
49-1011<br />
49-2022<br />
49-2094<br />
11-1021<br />
11-3071<br />
11-3131<br />
13-1151<br />
First-Line<br />
Supervisors<br />
of Mechanics,<br />
Installers, and<br />
Repairers<br />
Telecom.<br />
Equipment<br />
Installers and<br />
Repairers, Except<br />
Line Installers<br />
Electrical and<br />
Electronics<br />
Repairers,<br />
Commercial and<br />
Industrial Equip.<br />
General and<br />
Operations<br />
Managers<br />
Transp., Storage<br />
& Distribution<br />
Managers<br />
Training and Dev.<br />
Managers<br />
Training and Dev.<br />
Specialists<br />
ANNUAL<br />
OPENINGS<br />
MEDIAN<br />
HOURLY<br />
EARNINGS<br />
RESIDENT<br />
WORKERS<br />
NET<br />
COM-<br />
MUTERS<br />
540 54 $25.65 715 (175)<br />
307 31 $22.02 420 (113)<br />
55 6 $26.03 72 (17)<br />
1,889 185 $34.78 2,778 (889)<br />
183 17 $32.89 236 (53)<br />
24 3 $35.77 51 (27)<br />
239 27 $23.17 336 (97)<br />
27-4013 Radio Operators
APPENDIX V:<br />
DATA SOURCES AND CALCULATIONS<br />
COST OF LIVING DATA<br />
Emsi cost of living data is based on the Cost of Living Index published quarterly by the Council<br />
for Community and Economic Research (C2ER).<br />
OCCUPATION DATA<br />
Emsi occupation employment data are based on final Emsi industry data and final Emsi staffing<br />
patterns. Wage estimates are based on Occupational Employment Statistics (QCEW and Non-<br />
QCEW Employees classes of worker) and the American Community Survey (Self-Employed and<br />
Extended Proprietors). Occupational wage estimates also affected by county-level Emsi earnings<br />
by industry.<br />
OCCUPATION RESIDENCE DATA<br />
This data comes from the Census LODES data, specifically from Origin and Destination (OD) data,<br />
Regional Area Characteristics (RAC), and Workforce Area Characteristics (WAC) data which Emsi<br />
applies to occupation jobs figures.<br />
STATE DATA SOURCES<br />
This report uses state data from the following agencies: Tennessee Department of Labor and<br />
Workforce Development, Research and Statistics Division<br />
112<br />
COMPREHENSIVE LABOR ANALYSIS: CLARKSVILLE-MONTGOMERY COUNTY
For more information please contact:<br />
Cal Wray, EDFP<br />
Executive Director<br />
<strong>Clarksville</strong>-Montgomery County Economic Development Council<br />
Aspire <strong>Clarksville</strong> Foundation<br />
25 Jefferson Street, Suite 300<br />
<strong>Clarksville</strong>, TN 37040<br />
Office: 931-245-4333, Cell: 931-257-4212<br />
Marla W. Rye<br />
Workforce Essentials, Inc.<br />
523 Madison St. Suite A<br />
<strong>Clarksville</strong>, TN 37040<br />
Office: 931.905-3500, Cell: 931.206.3783<br />
Mrye@workforceessentials.com<br />
cal@clarksville.tn.us, www.clarksvillepartnership.com