Regions in Figures 2018

Create successful ePaper yourself
Turn your PDF publications into a flip-book with our unique Google optimized e-Paper software.
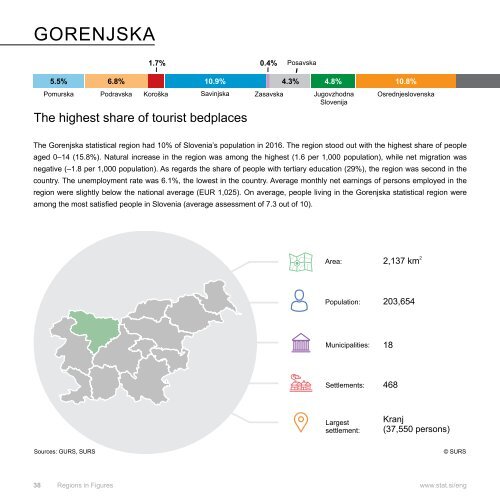
GORENJSKA<br />
1.7%<br />
0.4% Posavska<br />
5.5% 6.8%<br />
10.9%<br />
4.3% 4.8%<br />
10.8%<br />
Pomurska Podravska Koroška Sav<strong>in</strong>jska Zasavska Jugovzhodna Osrednjeslovenska<br />
Slovenija<br />
The highest share of tourist bedplaces<br />
The Gorenjska statistical region had 10% of Slovenia’s population <strong>in</strong> 2016. The region stood out with the highest share of people<br />
aged 0–14 (15.8%). Natural <strong>in</strong>crease <strong>in</strong> the region was among the highest (1.6 per 1,000 population), while net migration was<br />
negative (–1.8 per 1,000 population). As regards the share of people with tertiary education (29%), the region was second <strong>in</strong> the<br />
country. The unemployment rate was 6.1%, the lowest <strong>in</strong> the country. Average monthly net earn<strong>in</strong>gs of persons employed <strong>in</strong> the<br />
region were slightly below the national average (EUR 1,025). On average, people liv<strong>in</strong>g <strong>in</strong> the Gorenjska statistical region were<br />
among the most satisfied people <strong>in</strong> Slovenia (average assessment of 7.3 out of 10).<br />
Sources: GURS, SURS<br />
© SURS<br />
38 <strong>Regions</strong> <strong>in</strong> <strong>Figures</strong> www.stat.si/eng