Blueprint Germany - Öko-Institut eV
Blueprint Germany - Öko-Institut eV
Blueprint Germany - Öko-Institut eV

Create successful ePaper yourself
Turn your PDF publications into a flip-book with our unique Google optimized e-Paper software.
PJ<br />
2.500<br />
2.000<br />
1.500<br />
1.000<br />
500<br />
0<br />
Index of CO 2 emissions<br />
2005 2020 2005 2006 20302007 2008 2009 2040 2010 2011 2012 2050 2013<br />
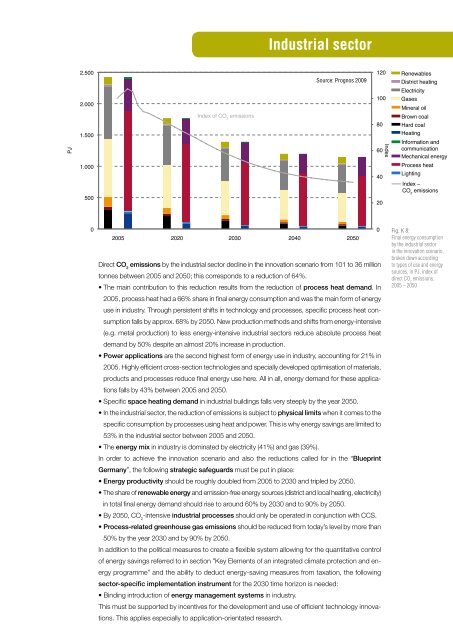
Direct CO emissions by the industrial sector decline in the innovation scenario from 101 to 36 million<br />
2<br />
tonnes between 2005 and 2050; this corresponds to a reduction of 64%.<br />
• The main contribution to this reduction results from the reduction of process heat demand. In<br />
2005, process heat had a 66% share in final energy consumption and was the main form of energy<br />
use in industry. Through persistent shifts in technology and processes, specific process heat consumption<br />
falls by approx. 68% by 2050. New production methods and shifts from energy-intensive<br />
(e.g. metal production) to less energy-intensive industrial sectors reduce absolute process heat<br />
demand by 50% despite an almost 20% increase in production.<br />
• Power applications are the second highest form of energy use in industry, accounting for 21% in<br />
2005. Highly efficient cross-section technologies and specially developed optimisation of materials,<br />
products and processes reduce final energy use here. All in all, energy demand for these applications<br />
falls by 43% between 2005 and 2050.<br />
• Specific space heating demand in industrial buildings falls very steeply by the year 2050.<br />
• In the industrial sector, the reduction of emissions is subject to physical limits when it comes to the<br />
specific consumption by processes using heat and power. This is why energy savings are limited to<br />
53% in the industrial sector between 2005 and 2050.<br />
• The energy mix in industry is dominated by electricity (41%) and gas (39%).<br />
In order to achieve the innovation scenario and also the reductions called for in the “<strong>Blueprint</strong><br />
<strong>Germany</strong>”, the following strategic safeguards must be put in place:<br />
Industrial sector<br />
Source: Prognos 2009<br />
• Energy productivity should be roughly doubled from 2005 to 2030 and tripled by 2050.<br />
• The share of renewable energy and emission-free energy sources (district and local heating, electricity)<br />
in total final energy demand should rise to around 60% by 2030 and to 90% by 2050.<br />
• By 2050, CO 2 -intensive industrial processes should only be operated in conjunction with CCS.<br />
• Process-related greenhouse gas emissions should be reduced from today’s level by more than<br />
50% by the year 2030 and by 90% by 2050.<br />
In addition to the political measures to create a flexible system allowing for the quantitative control<br />
of energy savings referred to in section ”Key Elements of an integrated climate protection and energy<br />
programme” and the ability to deduct energy-saving measures from taxation, the following<br />
sector-specific implementation instrument for the 2030 time horizon is needed:<br />
• Binding introduction of energy management systems in industry.<br />
This must be supported by incentives for the development and use of efficient technology innovations.<br />
This applies especially to application-orientated research.<br />
120<br />
100<br />
80<br />
60<br />
40<br />
20<br />
0<br />
Index<br />
Renewables<br />
District heating<br />
Electricity<br />
Gases<br />
Mineral oil<br />
Brown coal<br />
Hard coal<br />
Heating<br />
Information and<br />
communication<br />
Mechanical energy<br />
Process heat<br />
Lighting<br />
Index –<br />
CO 2 emissions<br />
Fig. K 8:<br />
Final energy consumption<br />
by the industrial sector<br />
in the innovation scenario,<br />
broken down according<br />
to types of use and energy<br />
sources, in PJ, index of<br />
direct CO 2 emissions,<br />
2005 – 2050