Stanton PhD Thesis final_docx - Atrium - University of Guelph
Stanton PhD Thesis final_docx - Atrium - University of Guelph
Stanton PhD Thesis final_docx - Atrium - University of Guelph
Create successful ePaper yourself
Turn your PDF publications into a flip-book with our unique Google optimized e-Paper software.
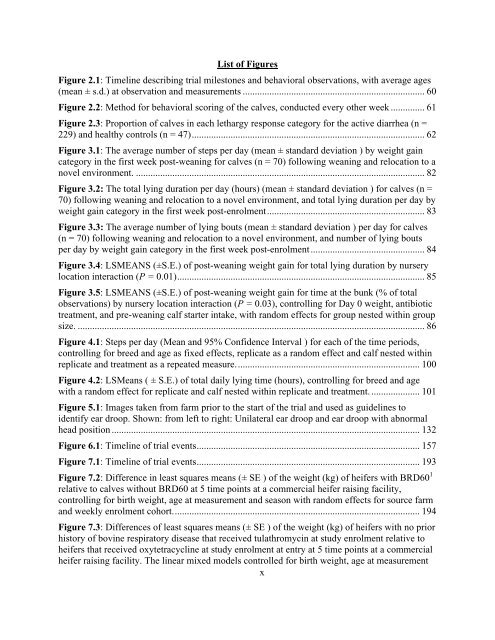
List <strong>of</strong> Figures<br />
Figure 2.1: Timeline describing trial milestones and behavioral observations, with average ages<br />
(mean ± s.d.) at observation and measurements ........................................................................... 60<br />
Figure 2.2: Method for behavioral scoring <strong>of</strong> the calves, conducted every other week .............. 61<br />
Figure 2.3: Proportion <strong>of</strong> calves in each lethargy response category for the active diarrhea (n =<br />
229) and healthy controls (n = 47) ................................................................................................ 62<br />
Figure 3.1: The average number <strong>of</strong> steps per day (mean ± standard deviation ) by weight gain<br />
category in the first week post-weaning for calves (n = 70) following weaning and relocation to a<br />
novel environment. ....................................................................................................................... 82<br />
Figure 3.2: The total lying duration per day (hours) (mean ± standard deviation ) for calves (n =<br />
70) following weaning and relocation to a novel environment, and total lying duration per day by<br />
weight gain category in the first week post-enrolment ................................................................. 83<br />
Figure 3.3: The average number <strong>of</strong> lying bouts (mean ± standard deviation ) per day for calves<br />
(n = 70) following weaning and relocation to a novel environment, and number <strong>of</strong> lying bouts<br />
per day by weight gain category in the first week post-enrolment ............................................... 84<br />
Figure 3.4: LSMEANS (±S.E.) <strong>of</strong> post-weaning weight gain for total lying duration by nursery<br />
location interaction (P = 0.01) ...................................................................................................... 85<br />
Figure 3.5: LSMEANS (±S.E.) <strong>of</strong> post-weaning weight gain for time at the bunk (% <strong>of</strong> total<br />
observations) by nursery location interaction (P = 0.03), controlling for Day 0 weight, antibiotic<br />
treatment, and pre-weaning calf starter intake, with random effects for group nested within group<br />
size. ............................................................................................................................................... 86<br />
Figure 4.1: Steps per day (Mean and 95% Confidence Interval ) for each <strong>of</strong> the time periods,<br />
controlling for breed and age as fixed effects, replicate as a random effect and calf nested within<br />
replicate and treatment as a repeated measure. ........................................................................... 100<br />
Figure 4.2: LSMeans ( ± S.E.) <strong>of</strong> total daily lying time (hours), controlling for breed and age<br />
with a random effect for replicate and calf nested within replicate and treatment. .................... 101<br />
Figure 5.1: Images taken from farm prior to the start <strong>of</strong> the trial and used as guidelines to<br />
identify ear droop. Shown: from left to right: Unilateral ear droop and ear droop with abnormal<br />
head position ............................................................................................................................... 132<br />
Figure 6.1: Timeline <strong>of</strong> trial events ............................................................................................ 157<br />
Figure 7.1: Timeline <strong>of</strong> trial events ............................................................................................ 193<br />
Figure 7.2: Difference in least squares means (± SE ) <strong>of</strong> the weight (kg) <strong>of</strong> heifers with BRD60 1<br />
relative to calves without BRD60 at 5 time points at a commercial heifer raising facility,<br />
controlling for birth weight, age at measurement and season with random effects for source farm<br />
and weekly enrolment cohort. ..................................................................................................... 194<br />
Figure 7.3: Differences <strong>of</strong> least squares means (± SE ) <strong>of</strong> the weight (kg) <strong>of</strong> heifers with no prior<br />
history <strong>of</strong> bovine respiratory disease that received tulathromycin at study enrolment relative to<br />
heifers that received oxytetracycline at study enrolment at entry at 5 time points at a commercial<br />
heifer raising facility. The linear mixed models controlled for birth weight, age at measurement<br />
x


