WRD CAFR FINAL 2017

Create successful ePaper yourself
Turn your PDF publications into a flip-book with our unique Google optimized e-Paper software.
Comprehensive Annual Financial Report<br />
Fiscal Year Ended<br />
June 30, <strong>2017</strong> and 2016<br />
WATER REPLENISHMENT DISTRICT OF<br />
SOUTHERN CALIFORNIA<br />
4040 Paramount Boulevard<br />
Lakewood, California 90712<br />
Prepared by:<br />
Finance Department<br />
Scott M. Ota, CPA, CFF, CIRA, CGMA<br />
Chief Financial Officer<br />
Jenna H. Shaunessy, Manager of Finance and Administration<br />
Elizabeth Betham, Senior Accountant<br />
Binhyen Bui, Senior Accountant<br />
Kathryn Burns, Senior Accountant
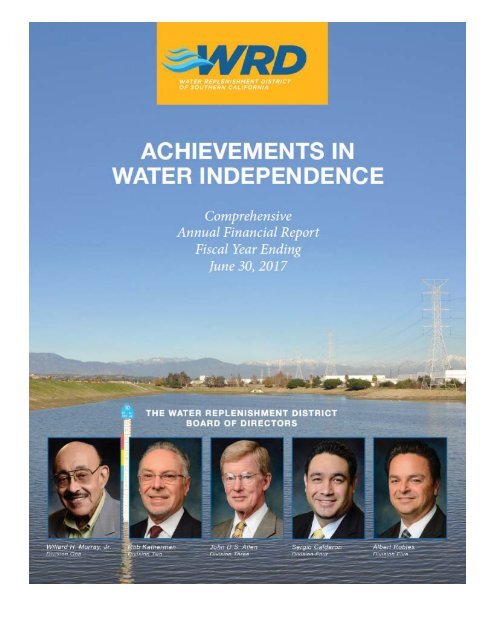
Our Mission Statement<br />
“To provide, protect and preserve high quality<br />
groundwater through innovative, cost-effective and<br />
environmentally sensitive basin management practices<br />
for the benefit of residents and businesses of the Central<br />
and West Coast Basins.”<br />
Water Replenishment District of Southern California<br />
Board of Directors as of June 30, <strong>2017</strong><br />
Elected/ Current<br />
Name Division Title Appointed Term<br />
Willard H. Murray, Jr. 1 President Elected 01/15 – 01/19<br />
Robert Katherman 2 Vice President Elected 01/15 – 01/19<br />
John D.S. Allen 3 Secretary Elected 01/17 – 01/21<br />
Albert Robles 5 Treasurer Elected 01/17 - 01/21<br />
Sergio Calderon 4 Director Elected 01/15 - 01/19<br />
Water Replenishment District of Southern California<br />
Robb Whitaker, General Manager<br />
4040 Paramount Boulevard<br />
Lakewood, California 90712<br />
(562) 921-5521<br />
www.wrd.org
Water Replenishment District of Southern California<br />
Table of Contents<br />
INTRODUCTORY SECTION (Unaudited)<br />
Letter of Transmittal<br />
Organizational Chart<br />
Map of the District<br />
Government Finance Officers Association –<br />
Certificate of Achievement for Excellence in Financial Reporting<br />
PAGE<br />
i<br />
x<br />
xi<br />
xii<br />
FINANCIAL SECTION<br />
Report of Independent Auditors 1<br />
Management’s Discussion and Analysis (Unaudited) 3<br />
BASIC FINANCIAL STATEMENTS<br />
Statements of Net Position 9<br />
Statements of Revenues, Expenses and Changes in Net Position 10<br />
Statements of Cash Flows 11<br />
Notes to Financial Statements 13<br />
REQUIRED SUPPLEMENTARY INFORMATION (Unaudited)<br />
Schedule of Funding Progress – OPEB<br />
Schedule of Proportionate Share of the Net Pension Liability – CalPERS<br />
Schedule of Proportionate Share of the Net Pension Liability – PARS<br />
Schedule of Contributions – CalPERS<br />
Schedule of Contributions – PARS<br />
47<br />
48<br />
49<br />
50<br />
51<br />
STATISTICAL SECTION (Unaudited)<br />
Statistical Section – Table of Contents 52<br />
Changes in Net Position by Component – Last Ten Fiscal Years 53<br />
Operating Revenues by Source – Last Ten Fiscal Years 55<br />
Operating Expenses by Activity – Last Ten Fiscal Years 56<br />
Revenue Base – Last Ten Fiscal Years 57<br />
Revenue Rates – Last Ten Fiscal Years 58<br />
Customers by Type – Last Ten Fiscal Years 59<br />
Principal Customers – Current Fiscal Year and Ten Years Ago 60<br />
Ratio of Outstanding Debt – Last Ten Fiscal Years 61<br />
Debt Coverage – Last Ten Fiscal Years 62<br />
Demographics and Economic Statistics – County of Los Angeles – Last Ten Fiscal<br />
Years 63<br />
Largest Employers – County of Los Angeles<br />
Operating and Capacity Indicators – Last Ten Fiscal Years<br />
REPORT ON INTERNAL CONTROLS AND COMPLIANCE<br />
Report of Independent Auditors on Internal Control over Financial Reporting and<br />
On Compliance and Other Matters Based on an Audit of Financial Statements<br />
Performed in Accordance with Government Auditing Standards 66<br />
64<br />
65
(This page intentionally left blank.)
Introductory Section
(This page intentionally left blank.)
December 20, <strong>2017</strong><br />
The Honorable Board of Directors of the<br />
Water Replenishment District of Southern California<br />
State law requires that every general-purpose government agency publish within six months of<br />
the close of each fiscal year a complete set of audited financial statements. This report is<br />
published to fulfill that requirement for the fiscal year ended June 30, <strong>2017</strong>.<br />
Management assumes full responsibility for the completeness and reliability of the information<br />
contained in this report, based upon a comprehensive framework of internal controls that it has<br />
established for this purpose. Due to costs, internal controls should not exceed anticipated<br />
benefits; the objective is to provide reasonable, rather than absolute, assurance that the financial<br />
statements are free of any material misstatements.<br />
Vasquez & Company LLP, Certified Public Accountants, have issued an unmodified (“clean”)<br />
opinion on the Water Replenishment District of Southern California’s financial statements for<br />
the year ended June 30, <strong>2017</strong>. The independent auditors’ report is located at the front of the<br />
financial section of this report.<br />
Management’s discussion and analysis (MD&A) immediately follows the independent auditors’<br />
report and provides a narrative introduction, overview, and analysis of the basic financial<br />
statements. MD&A complements and should be read in conjunction with this letter of<br />
transmittal.<br />
The District has one blended component unit with a June 30 year-end. Accordingly, the<br />
Southern California Water Replenishment Financing Corporation is presented as a blended<br />
component unit of the District.<br />
Profile of the District<br />
The District is a special water district that was established in 1959 by popular vote to counteract<br />
the effects of over pumping of groundwater from two major groundwater basins in Los Angeles<br />
County. It is the only replenishment district in California operating under the provisions of the<br />
California Water Code, Section 60000 et seq., which specifically governs water replenishment<br />
districts.<br />
The District manages the Central and West Coast groundwater basin (collectively, the “Basins”)<br />
which provide groundwater for approximately four million residents in 43 cities of southern Los<br />
Angeles County (County). The District was formed in response to a history of over pumping of<br />
the Basins which caused wells to go dry and seawater to intrude into the potable water aquifers.<br />
The District serves as the groundwater manager for the Basins, in accordance with the<br />
i
adjudications of the Basins. The District protects the Basins by replenishing the groundwater,<br />
deterring sea water intrusion and removing contaminants from the groundwater. The District is<br />
bound by the Baldwin, Whittier, and Merced Hills to the north, the Orange County line to the<br />
east, and the Pacific Ocean to the south and west. It lies entirely within Los Angeles County and<br />
serves 43 cities, including Los Angeles, Long Beach, Downey, and Torrance. The<br />
approximately 420 square mile service area uses about 250,000 acre-feet of groundwater per<br />
year.<br />
The District’s stated mission is “to provide, protect and preserve high quality groundwater<br />
through innovative, cost-effective and environmentally sensitive water basin management<br />
practices for the benefit of residents and businesses of the Central and West Coast Basins.”<br />
Although the District does not directly serve customers, it ensures the health of the groundwater<br />
basins so groundwater supplies are available to those with water rights to those basins, such as<br />
the cities that supply water to their residents. According to District estimates, in the past nearly<br />
40 percent of the water consumed by the area served by the District comes from groundwater<br />
sources. Due to the drought and conservation, the percentage is now closer to 50 percent. The<br />
remaining amount comes from water imported from the Colorado River and Northern California.<br />
The District was originally established to oversee the replenishment of groundwater levels in the<br />
West Coast and Central groundwater basins of Los Angeles County. The need for an entity to<br />
perform this function had become clear by the 1950s. The increasing population of the Los<br />
Angeles area during the early part of this century had overwhelmed the area’s limited sources of<br />
surface water, so communities, private water companies, and businesses began pumping water<br />
out of the groundwater basins. Since the natural inflow to the groundwater basins relies<br />
primarily on rainfall that averages only 14 inches per year, it was not long before the pumping<br />
outstripped the basins’ ability to recharge themselves through natural means. As the<br />
groundwater levels continued to go down, some wells went dry and saltwater intruded into the<br />
basins’ coastal areas, causing wells to be abandoned.<br />
The West Basin Water Association was formed in 1947, and the Central Basin Water<br />
Association was formed in 1952. These associations developed a plan to provide supplemental<br />
water to their members, limit groundwater extraction from the basins, and create a means to<br />
provide groundwater pumping rights to users who lacked access to other supplemental water<br />
supplies. At about the same time, the entities went to court seeking specific assignments for<br />
groundwater rights. In 1956 and 1961, the court awarded varying amounts of groundwater rights<br />
to a number of entities. During fiscal year 1997 – 98, 150 parties to these judgments held a total<br />
of 217,367 acre-feet of water rights in the Central Basin, and 68 parties held a total of 64,468<br />
acre-feet of water rights in the West Coast Basin. Since water rights are property rights, they can<br />
be bought and sold.<br />
By law, the District has broad authority to carry out its responsibilities, which include the<br />
purchase of water to replenish the basins, administering clean water programs and investing in<br />
projects intended to improve the reliable supply of clean water at a reasonable cost. The District<br />
annually purchases an average of 71,000 acre-feet of water to be added to spreading grounds,<br />
where it gradually percolates into the underlying aquifers. The District also purchases an<br />
average of 27,000 acre-feet per year of water to be injected into seawater barrier wells along the<br />
coastline. Water injected into these barrier wells forms a dam of freshwater that keeps seawater<br />
ii
from flowing into the groundwater aquifers in areas where groundwater levels have dropped<br />
below sea level. Los Angeles County operates the spreading grounds and barrier wells, using the<br />
water the District provides.<br />
In addition, the District operates a number of clean water programs under the authority of 1991<br />
legislation that broadened its mission to include the detection, prevention, and removal of<br />
contaminants in the groundwater. In response to this legislation, the District has established<br />
programs to monitor water quality, remove containments, and mitigate saltwater intrusion.<br />
Local Economy<br />
The District office is located in Los Angeles County, with over 10 million residents in 88 cities<br />
spread across 4,100 square miles; Los Angeles County’s population exceeds that of 43 states. If<br />
it were a country, it would be the twentieth largest economy in the world. In addition to its<br />
signature industries—entertainment, tourism and fashion—its enormous and diversified<br />
economy is home to the largest port complex in the Western Hemisphere and the largest number<br />
of manufacturing jobs of any county in the country. Other major industries include health care,<br />
education and knowledge creation and business services.<br />
The county added 94,700 jobs in 2015, equivalent to a 2.2% annual increase. A majority of the<br />
county’s major industries added jobs last year, as broad-based growth pushed wage and salaried<br />
jobs to a record high. Los Angeles County should continue to add jobs this year. Along with job<br />
growth, the unemployment rate fell to 6.9%, the lowest rate of the post-recession period. The<br />
unemployment rate should further improve.<br />
Population growth is expected to slow slightly this year and next, with the rate of growth at<br />
approximately 0.6% this year and 0.4% in <strong>2017</strong>. Even at such low growth rates, the county will<br />
increase by over 100,000 residents during that time period. Most of the recent population growth<br />
in Los Angeles County has been due to natural increase (births outnumbering deaths), while net<br />
migration was slightly negative again last year. The county’s high cost of living and lack of<br />
affordable housing units for low and middle-income households are contributing to the<br />
slowdown in population growth.<br />
Like the nation and state, Los Angeles County experienced broad-based job gains in 2015,<br />
adding approximately 95,000 jobs last year. Job gains were seen in most of the county’s major<br />
industries, with records reached in seven (out of 17) and two more poised to surpass their prerecession<br />
peaks in 2016. The largest job gains occurred in health care and social assistance<br />
(21,800 jobs), followed by leisure and hospitality (19,600 jobs) and government (10,000 jobs).<br />
The fastest growing sectors in percentage terms were construction (5.9%), leisure and hospitality<br />
(4.2%), wholesale trade (3.5%), and health care and social assistance (also 3.5%). Private sector<br />
job losses occurred in manufacturing, information, finance and insurance, and the natural<br />
resources sector.<br />
iii
As America’s gateway to Asia, international trade plays an important role in the Los Angeles<br />
economy. The twin ports rebounded after the labor negotiations early in the year to post their<br />
third-best year in 2015, with throughput of 15.4 million containers. Despite this, low inflationary<br />
pressure combined with a strong dollar brought the value of two-way trade through the Los<br />
Angeles Customs District down to $393.4 billion from the record-setting volume of $416.6<br />
billion in 2014.<br />
In terms of employment, the professional services super-sector is the second largest in Los<br />
Angeles County, with over 620,000 workers in 2015 (surpassed only by health care and<br />
education). There are three major industries in this group: professional, scientific and technical<br />
services; management of enterprises; and administrative, support and waste services. All saw<br />
solid gains in 2015. Professional, scientific and technical services was the largest of the three<br />
with 288,700 jobs in 2015. The industry, which includes legal, accounting, architecture,<br />
computer systems design, consulting, research and advertising, added 5,800 jobs, equivalent to a<br />
2.0% growth rate. Finally, the administrative, support and waste services sector added 4,900 jobs<br />
(1.8%) for a total of 271,900. All three components of professional services and technology are<br />
expected to see additional job gains in 2016 and <strong>2017</strong>.<br />
Los Angeles County has seen steady improvement over the past four years, both in terms of job<br />
gains and unemployment rate declines. This improvement is expected to continue in 2016 and<br />
<strong>2017</strong>, although at a slower pace. With the economy back at full employment levels, wage gains<br />
are expected over the next year across many occupations. Households could experience<br />
significant gains in purchasing power this year as wage gains spread out more broadly than in<br />
recent years.<br />
California water supplies are much better off than they were a year ago. The 2015/16 El Niño<br />
did produce additional rain and snow, however it was much farther north than expected. The<br />
additional rain in northern California has led to a healthy replenishment of the state’s northern<br />
reservoirs including Shasta, Oroville and Folsom. Toward Los Angeles and San Diego, the<br />
winter’s moisture has been much more disappointing. However, with the runoff from the storms<br />
in northern California boosting the reservoir levels, the Department of Water Resources (DWR)<br />
increased its water delivery estimate for most recipients to 60 percent of requests for the calendar<br />
year. DWR’s initial State Water Project allocation, announced in December, was 10 percent of<br />
requests.<br />
On the water conservation side of the equation, the State Water Resources Control Board<br />
recently announced that Californians have reduced residential water use by 28 percent in May<br />
2016, compared to the same month in 2013. Cumulatively, local water suppliers have saved 1.6<br />
million acre-feet in the 12 months since mandatory conservation goals began. Starting in June<br />
2016, the State Water Resources Control Board recently updated emergency water conservation<br />
regulations to provide urban water agencies the ability to set their own conservation standards<br />
based on a “stress test” of supply reliability. Water suppliers must demonstrate that they have<br />
sufficient supplies to withstand three years of continuous drought or take additional measures<br />
that include mandatory conservation targets. The regulation is in effect through January <strong>2017</strong>.<br />
iv
The Water Replenishment District of Southern California has embraced water conservation and<br />
the use of recycled water for many years. Through coordination and planning with other local<br />
and regional water suppliers, the District continues to engage in developing long-term solutions<br />
to the various water supply challenges. These efforts are evidenced in the District’s participation<br />
in regional conjunctive use programs as well as local groundwater storage and recovery projects.<br />
It is through participation in these and other programs, such as the District’s Water Independence<br />
Now (WIN) program, that will enable the District to continue to meet its long-term water supply<br />
needs.<br />
The WIN program is specifically designed to make use of local water supplies to become<br />
completely independent of imported water from the Colorado River and the California State<br />
Water Project. Prior to 1961/62, the West and Central Groundwater Basins received about 36%<br />
of the replenishment water from storm water and 64% from imported water. Today, the demand<br />
for imported water has dropped dramatically due to the many projects and cooperative<br />
interagency programs <strong>WRD</strong> has helped develop. The increase in replenishment due to natural<br />
recharge is a direct result of storm water capture projects which increases the ability to benefit<br />
from local storm events. The WIN program will completely eliminate the need for imported<br />
water by replacing the current imported water needs with recycled water. This will be<br />
accomplished through completion of the Groundwater Reliability Improvement Program (GRIP)<br />
and the use of 100% recycled water at the West Coast and Dominguez Gap Seawater Intrusion<br />
Barrier Projects.<br />
Source of economic data: Los Angeles County Profile; Los Angeles County Economic<br />
Development Corporation.<br />
Relevant Financial Policies<br />
Internal Control Structure<br />
District management is responsible for the establishment and maintenance of the internal control<br />
structure that ensures that the assets of the District are protected from loss, theft, or misuse. The<br />
internal control structure also ensures that adequate accounting data are compiled to allow for the<br />
preparation of financial statements in conformity with generally accepted accounting principles.<br />
The District’s internal control structure is designed to provide reasonable assurance that these<br />
objectives are met. The concept of reasonable assurance recognizes that (1) the cost of a control<br />
should not exceed the benefits likely to be derived, and (2) the valuation of costs and benefits<br />
requires estimates and judgments by management.<br />
Investment Policy<br />
The Board of Directors annually adopts an investment policy that conforms to California State<br />
law, District ordinance and resolutions, prudent money management, and the “prudent person”<br />
standards. The Investment Policy’s objectives are safety, liquidity, and yield. District funds are<br />
normally invested in the State Treasurer’s Local Agency Investment Fund, Certificates of<br />
Deposit, Government Agency Obligations or other specifically authorized investments.<br />
v
Replenishment Assessment<br />
Following twelve public budget workshops, the <strong>WRD</strong> Board of Directors voted to increase the<br />
2016-<strong>2017</strong> Replenishment Assessment to $297.00 per acre-foot. When compared to the cost of<br />
imported water of about $1,032 per acre-foot, groundwater represents a substantial savings. We<br />
are as proud of the very open and collaborative process we used to arrive at the result as we are<br />
of the result itself. Despite rising costs, especially for necessary legal services, we managed to<br />
stay the course through general belt-tightening and a conscious decision to reduce purchases for<br />
increasingly expensive imported water in favor of more cost-effective local supply.<br />
Fitch Ratings and Standard & Poor’s affirms <strong>WRD</strong>’s AA+ Debt Rating<br />
Reflecting confidence in <strong>WRD</strong>’s financial stability and management, both of the major rating<br />
agencies rated the certificates AA+, which is at or near the top rating for water agencies in the<br />
state.<br />
District Achievements<br />
This was an extraordinarily productive year for <strong>WRD</strong>. Projects completed or started will produce<br />
or enable the delivery of nearly 40,000 acre-feet of local water. The expanded Vander Lans<br />
Advanced Water Treatment Facility (AWTF) became fully operational. We broke ground on the<br />
expansion of the Robert W. Goldsworthy Desalter. The turnout structures connecting our major<br />
source of recycled water to our major spreading grounds was completed. And we broke ground<br />
on the crown jewel of our Water Independence Now (WIN) initiative --- the 10,000 acre-foot<br />
capacity GRIP AWTF.<br />
Five-Year Strategic Action Plan<br />
During an all-day workshop to assess <strong>WRD</strong> priorities, the Board refined its vision and strategic<br />
direction for the next five years. The results of that robust discussion were reflected in a Strategic<br />
Action Plan adopted by the Board. The five main goals of the District identified in the Plan:<br />
Continue to implement Water Independence Now (WIN)<br />
Provide high quality groundwater<br />
Promote organizational excellence<br />
Advance groundwater awareness<br />
Foster environmental stewardship and sustainability<br />
At <strong>WRD</strong>, the Strategic Action Plan is not a document we adopt and put on the shelf for five<br />
years. Its implementation governs virtually everything we do. Executing the WIN initiative is a<br />
relentless pursuit, reflected by our brick-and-mortar projects. High quality groundwater is the<br />
objective and result of our Safe Drinking Water program under which we adopted three<br />
additional projects this year. We enhanced organizational excellence this year by awarding<br />
contracts to help us implement an Asset Management Plan and Supervisory Control and Data<br />
Acquisition Plan, both indispensable elements of sophisticated management for the modern<br />
organization. Our education and outreach efforts, highlighted by our much-emulated ECO<br />
Gardener program, cover every corner of the District. And our implementation of local supply<br />
projects greatly reduces the carbon footprint for the region.<br />
vi
Five-Year Capital Improvement Program<br />
The Board adopted an updated Five-Year Capital Improvement Program (CIP), providing a road<br />
map that will take us through 2019/20. The CIP summarizes ongoing and planned capital<br />
projects and equipment purchases and links those projects and purchases to <strong>WRD</strong>’s Strategic<br />
Action Plan and annual budget. The CIP includes a total of $146 million in capital projects and<br />
reflects more than $12 million in grant funding <strong>WRD</strong> has received.<br />
Grant Funding<br />
Grant funding helps reduce the Replenishment Assessment the District would otherwise have to<br />
adopt. Just this year, we received three grants totaling over $9 million. $9 million is equivalent to<br />
roughly $34 for one year on the Replenishment Assessment. The grants included just over $5<br />
million for the GRIP Recycled Water Turnout Structures and just over $4 million for the<br />
Goldsworthy Desalter expansion. Both were from the Drought Solicitation Round of Proposition<br />
84 Implementation Grants. <strong>WRD</strong> also received an $85,250 grant from the Metropolitan Water<br />
District for our Tracer Alternative Research Project.<br />
Additionally, the District received a grant of $15 million from the State Water Resources Control<br />
Board that will go toward the cost of the GRIP AWTF.<br />
Leo J. Vander Lans AWTF<br />
Full operation commenced at the expanded Leo J. Vander Lans Advanced Water Treatment<br />
Facility (AWTF). The expansion project increased the capacity at the facility from 3,300 acrefeet<br />
per year to 8,000 acre-feet per year, eliminating altogether the need for imported water at the<br />
Alamitos Barrier.<br />
Robert W. Goldsworthy Desalter<br />
The District broke ground on a project to more than double the capacity of the Robert W.<br />
Goldsworthy Desalter. This project will treat an additional 2,400 acre-feet of brackish<br />
groundwater to provide a total of 4,800 acre-feet of potable water to the City of Torrance each<br />
year.<br />
Groundwater Reliability Improvement Program<br />
The Groundwater Reliability Improvement Program (GRIP) is the cornerstone of <strong>WRD</strong>’s WIN<br />
initiative. GRIP will allow <strong>WRD</strong> to become 100% independent of imported water for<br />
groundwater replenishment. Once completed in 2018, GRIP will enable <strong>WRD</strong> to offset the<br />
current use of imported water with a combined total of 21,000 acre-feet per year of both tertiary<br />
treated water (11,000 acre-feet) and advanced treated water (10,000 acre-feet) for groundwater<br />
replenishment in the Central Basin via the Montebello Forebay. GRIP has two main components:<br />
Turnout Structures<br />
<strong>WRD</strong> completed work on two new turnout structures to connect the Los Angeles County<br />
Sanitation Districts’ recycled water delivery pipeline to the Montebello Forebay Spreading<br />
Grounds and the San Gabriel River. The structures are key elements of GRIP and starting this<br />
summer will enable delivery to the spreading grounds of an additional 11,000 acre-feet of<br />
recycled water per year on average.<br />
vii
Advanced Water Treatment Facility<br />
The Advanced Water Treatment Facility (AWTF) is the centerpiece of GRIP and a final<br />
piece of the first phase of the WIN initiative. Major steps were taken this year to make this<br />
long-planned project a reality. Specifically, the <strong>WRD</strong> Board:<br />
Certified the Final Environmental Impact Report for the project<br />
Adopted a design/build procurement process for project delivery<br />
With active community participation, conducted a robust and highly competitive<br />
design competition for the treatment building and related facilities<br />
Selected a design concept and an architectural and design team to work with the<br />
engineering and construction team to implement final design<br />
Hired an Owner’s Engineer/Agent to provide professional program management and<br />
technical advisory services relating to the GRIP AWTF for the duration of advanced<br />
planning, design, entitlement, permitting and commissioning.<br />
Executed a Project Labor Agreement for the project with the Los Angeles/Orange<br />
County Construction Trades Council<br />
Selected an engineering, construction and operations and maintenance team to build<br />
the project and operate the treatment facility once complete<br />
Awards and Acknowledgements<br />
The Government Finance Officers Association of the United States and Canada (GFOA)<br />
awarded a Certificate of Achievement for Excellence in Financial Reporting to the District for its<br />
Comprehensive Annual Financial Report (<strong>CAFR</strong>) for the fiscal year ended June 30, 2016. This<br />
was the thirteenth consecutive year that the District submitted its <strong>CAFR</strong> for this prestigious<br />
award. In order to be awarded a Certificate of Achievement, a government unit must publish an<br />
easily readable and efficiently organized <strong>CAFR</strong>. This report must satisfy both generally<br />
accepted accounting principles and applicable legal requirements.<br />
A Certificate of Achievement is valid for a period of one year only. We believe that our current<br />
<strong>CAFR</strong> continues to meet the Certificate of Achievement Program’s requirements and we are<br />
submitting it to the GFOA to determine its eligibility for another certificate.<br />
The District has also been presented with the following awards as part of its ongoing effort to<br />
provide, protect and preserve high-quality groundwater within the Central and West Coast<br />
Groundwater Basins.<br />
<br />
<br />
Government Finance Officers Association Distinguished Budget Presentation Award<br />
California Society of Municipal Finance Officers Association Award of Excellence in<br />
Budgeting<br />
viii
Preparation of this report was accomplished by the combined efforts of District staff. We<br />
appreciate the dedicated efforts and professionalism that our staff members bring to the District.<br />
We would also like to thank the members of the Board of Directors for their continued support in<br />
the planning and implementation of the Water Replenishment District of Southern California’s<br />
fiscal policies.<br />
Respectfully submitted,<br />
Scott M. Ota, CPA, CFF, CIRA, CGMA<br />
Chief Financial Officer<br />
Water Replenishment District of Southern California<br />
ix
Water Replenishment District of Southern California<br />
Organizational Chart<br />
x
Water Replenishment District of Southern California<br />
Map of the District<br />
xi
xii
Financial Section
(This page intentionally left blank.)
Report of Independent Auditors<br />
The Honorable Members of the Board<br />
Water Replenishment District of Southern California<br />
Report on the Financial Statements<br />
We have audited the accompanying financial statements of the Water Replenishment District of<br />
Southern California (the District) as of and for the years ended June 30, <strong>2017</strong> and 2016, and the<br />
related notes to the financial statements, which collectively comprise the District’s basic financial<br />
statements as listed in the table of contents.<br />
Management’s Responsibility for the Financial Statements<br />
Management is responsible for the preparation and fair presentation of these financial statements in<br />
accordance with accounting principles generally accepted in the United States of America; this<br />
includes the design, implementation, and maintenance of internal control relevant to the preparation<br />
and fair presentation of financial statements that are free from material misstatement, whether due<br />
to fraud or error.<br />
Auditors’ Responsibility<br />
Our responsibility is to express an opinion on these financial statements based on our audits. We<br />
conducted our audits in accordance with auditing standards generally accepted in the United States<br />
of America, the State Controller’s Minimum Audit Requirements for California Special Districts and<br />
the standards applicable to financial audits contained in Government Auditing Standards, issued by<br />
the Comptroller General of the United States. Those standards require that we plan and perform<br />
the audit to obtain reasonable assurance about whether the financial statements are free from<br />
material misstatement.<br />
An audit involves performing procedures to obtain audit evidence about the amounts and<br />
disclosures in the financial statements. The procedures selected depend on the auditors’ judgment,<br />
including the assessment of the risks of material misstatement of the financial statements, whether<br />
due to fraud or error. In making those risk assessments, the auditor considers internal control<br />
relevant to the entity’s preparation and fair presentation of the financial statements in order to<br />
design audit procedures that are appropriate in the circumstances, but not for the purpose of<br />
expressing an opinion on the effectiveness of the entity’s internal control. Accordingly, we express<br />
no such opinion. An audit also includes evaluating the appropriateness of accounting policies used<br />
and the reasonableness of significant accounting estimates made by management, as well as<br />
evaluating the overall presentation of the financial statements.<br />
We believe that the audit evidence we have obtained is sufficient and appropriate to provide a basis<br />
for our audit opinion.<br />
Opinion<br />
In our opinion, the financial statements referred to above present fairly, in all material respects, the<br />
financial position of the District as of June 30, <strong>2017</strong> and 2016, and the changes in financial position,<br />
and cash flows thereof for the years then ended in accordance with accounting principles generally<br />
accepted in the United States of America.<br />
1
Other Matters<br />
Required Supplementary Information<br />
Accounting principles generally accepted in the United States of America require that the<br />
management’s discussion and analysis on pages 3 through 8, and the required supplementary<br />
information on page 47 through 51, be presented to supplement the basic financial statements. Such<br />
information, although not a part of the basic financial statements, is required by the Governmental<br />
Accounting Standards Board who considers it to be an essential part of financial reporting for placing<br />
the basic financial statements in an appropriate operational, economic, or historical context. We<br />
have applied certain limited procedures to the required supplementary information in accordance<br />
with auditing standards generally accepted in the United States of America, which consisted of<br />
inquiries of management about the methods of preparing the information and comparing the<br />
information for consistency with management’s responses to our inquiries, the basic financial<br />
statements, and other knowledge we obtained during our audit of the basic financial statements. We<br />
do not express an opinion or provide any assurance on the information because the limited<br />
procedures do not provide us with sufficient evidence to express an opinion or provide any<br />
assurance.<br />
Other Information<br />
Our audit was conducted for the purpose of forming an opinion on the financial statements that<br />
collectively comprise the District’s basic financial statements. The introductory and statistical<br />
sections are presented for purposes of additional analysis and are not a required part of the basic<br />
financial statements.<br />
The introductory and statistical sections have not been subjected to the auditing procedures applied<br />
in the audit of the basic financial statements, and accordingly we do not express an opinion or<br />
provide any assurance on them.<br />
Other Reporting Required by Government Auditing Standards<br />
In accordance with Government Auditing Standards, we have also issued our report dated<br />
December 20, <strong>2017</strong>, on our consideration of the District’s internal control over financial reporting and<br />
on our tests of its compliance with certain provisions of laws, regulations, contracts, and grant<br />
agreements and other matters. The purpose of that report is solely to describe the scope of our<br />
testing of internal control over financial reporting and compliance and the results of that testing, and<br />
not to provide an opinion on the effectiveness of the District’s internal control over financial reporting<br />
or on compliance. That report is an integral part of an audit performed in accordance with<br />
Government Auditing Standards in considering the District’s internal control over financial reporting<br />
and compliance.<br />
Los Angeles, California<br />
December 20, <strong>2017</strong><br />
2
Water Replenishment District of Southern California<br />
Management’s Discussion and Analysis (Unaudited)<br />
June 30, <strong>2017</strong> and 2016<br />
The following Management's Discussion and Analysis (MD&A) of activities and financial<br />
performance of the Water Replenishment District of Southern California (District) provides an<br />
introduction to the financial statements of the District for the fiscal years ended June 30, <strong>2017</strong> and<br />
2016. We encourage readers to consider the information presented here in conjunction with the<br />
transmittal letter in the Introductory Section and with the basic financial statements and related<br />
notes, which follow this section.<br />
Financial Highlights<br />
<br />
<br />
<br />
The District's net position increased by 18.5% or $16,258,977 from $87,722,701 in fiscal<br />
year 2016 to $103,981,678 in fiscal year <strong>2017</strong>. Net position increased 9.6% or $7,705,157<br />
from $80,017,544 in fiscal year 2015 to $87,722,701 in fiscal year 2016.<br />
The District's total operating revenues increased 25.1% or $14,720,477 from $59,852,856 in<br />
fiscal year 2016 to $74,573,333 in fiscal year <strong>2017</strong>. This is due to deferred revenue being<br />
recognized as a part of the District’s purchase of imported spreading water in <strong>2017</strong>.<br />
The District's total expenses increased by 21.9% or $12,673,602 from fiscal year 2016 to<br />
<strong>2017</strong>. This was primarily due to the following:<br />
The District reimburses the cost for the District’s general election every two years to the<br />
County Registrar-Recorder. In fiscal year <strong>2017</strong>, the cost was $1.37 million;<br />
Total water costs increased $10,774,876 from $36,913,524 in fiscal year 2016 to<br />
$47,688,400 in <strong>2017</strong>.<br />
From fiscal year 2015 to 2016 total expense decreased by 23.9% or $18,223,623. This was<br />
primarily due to the following:<br />
The West Coast Seawater Intrusion Barrier Project received a high amount of recycled<br />
water than initially expected, saving about $3.3 million over the prior year Due to the<br />
expansion of the Leo J. Vander Lans Advanced Water Treatment Facility, less imported<br />
water was needed at the Alamitos Seawater Barrier, cutting costs by about $2.8 million;<br />
The District was able to provide In-Lieu replenishment water purchases for $6.2 million in<br />
fiscal year 2015 that was unavailable in 2016 causing a decrease in expenses;<br />
In fiscal year ended June 30, 2015, the District had significant litigation expenses ($10.3<br />
million) related to the claim that the District failed to comply with the requirements of<br />
Proposition 218. The parties resolved the litigation through a negotiated settlement in<br />
2015. The District did not incur any litigation expenses in 2016.<br />
Required Financial Statements<br />
This annual report includes the basic financial statements. The Statement of Net Position, Statement<br />
of Revenues, Expenses and Changes in Net Position, and Statement of Cash Flows provide<br />
information about the activities and performance of the District.<br />
The Statement of Net Position includes all of the District's investments in resources (assets) and the<br />
obligations to creditors (liabilities). It also provides the basis for computing a rate of return,<br />
evaluating the capital structure of the District and assessing the liquidity and financial flexibility of the<br />
District. All of the current year's revenue and expenses are accounted for in the Statement of<br />
Revenues, Expenses and Changes in Net Position. This statement measures the success of the<br />
District's operations over the past year and can be used to determine if the District has successfully<br />
recovered all of its costs through its rates and other charges. This statement can also be used to<br />
3
Water Replenishment District of Southern California<br />
Management’s Discussion and Analysis (Unaudited)<br />
June 30, <strong>2017</strong> and 2016<br />
evaluate fiscal stability and credit worthiness. The final required financial statement is the Statement<br />
of Cash Flows, which provides information about the District's cash receipts and cash payments<br />
during the reporting period. The Statement of Cash Flows reports cash receipts, cash payments and<br />
net changes in cash resulting from operations, investing, noncapital financing, and capital and<br />
related financing activities.<br />
The notes provide additional information that is essential to a full understanding of the data provided<br />
in the basic financial statements. The notes to the basic financial statements can be found on pages<br />
13 through 46.<br />
Financial Analysis of the District<br />
One of the most important questions asked about the District's finances is, "Is the District better off<br />
or worse off as a result of this year's activities?" The Statement of Net Position and the Statement of<br />
Revenues, Expenses and Changes in Net Position report information about the District in a way that<br />
helps answer this question. These statements include all assets and liabilities using the accrual<br />
basis of accounting, which is similar to the accounting used by most private sector companies. All of<br />
the current year's revenues and expenses are taken into account regardless of when the cash is<br />
received or paid.<br />
These two statements report the District's net position and changes in them. One can think of the<br />
District's net position - the difference between assets and liabilities - as a way to measure the<br />
District's financial health, or financial position. Over time, increases or decreases in the District's net<br />
position are one indicator of whether its financial health is improving or deteriorating. However, one<br />
will need to consider other non-financial factors such as changes in economic conditions, population<br />
growth and new or changed government legislation, such as changes in Federal and State water<br />
quality standards.<br />
Statement of Net Position<br />
Condensed Statement of Net Position<br />
June 30,<br />
Change<br />
June 30,<br />
Change<br />
<strong>2017</strong> 2016 Amount % 2015 Amount %<br />
Current assets $ 68,511,957 $ 68,486,791 $ 25,166 0.0 $ 63,977,006 $ 4,509,785 7.0<br />
Restricted assets 33,015,303 75,168,581 (42,153,278) -56.1 28,444,554 46,724,027 164.3<br />
Other noncurrent assets 662,998 1,028,682 (365,684) -35.5 1,233,800 (205,118) -16.6<br />
Capital assets, net 195,214,183 141,795,238 53,418,945 37.7 116,886,598 24,908,640 21.3<br />
Total assets 297,404,441 286,479,292 10,925,149 3.8 210,541,958 75,937,334 36.1<br />
Deferred outflows of resources 11,937,505 14,780,986 (2,843,481) 1,291.3 1,062,375 13,718,611 100.0<br />
Current liabilities 19,783,146 22,157,323 (2,374,177) -10.7 17,195,906 4,961,417 28.9<br />
Noncurrent liabilities 181,113,233 173,627,515 7,485,718 4.3 99,388,078 74,239,437 74.7<br />
Total liabilities 200,896,379 195,784,838 5,111,541 2.6 116,583,984 79,200,854 67.9<br />
Deferred inflows of resources 4,463,889 17,752,739 (13,288,850) -74.9 15,002,805 2,749,934 18.3<br />
Net position<br />
Net investment in capital assets 49,325,988 45,393,945 3,932,043 8.7 47,030,300 (1,636,355) -3.5<br />
Unrestricted 54,655,690 42,328,756 12,326,934 29.1 32,987,244 9,341,512 28.3<br />
Total net position $ 103,981,678 $ 87,722,701 $ 16,258,977 18.5 $ 80,017,544 $ 7,705,157 9.6<br />
As noted earlier, over time, changes in net position may serve as a useful indicator of a<br />
government's financial condition. In the case of the District, assets of the District exceeded liabilities<br />
by $103,981,678 and $87,722,701 as of June 30, <strong>2017</strong> and 2016, respectively.<br />
4
Water Replenishment District of Southern California<br />
Management’s Discussion and Analysis (Unaudited)<br />
June 30, <strong>2017</strong> and 2016<br />
Total assets increased $10.9 million or 3.8% in the current year primarily due to the use of restricted<br />
cash received from the 2015 Replenishment Assessment Revenue Bonds to fund the District’s 5-<br />
Year Capital Improvement Program; restricted cash decreased $42.2 million and capital assets<br />
increased $53.4 million.<br />
Deferred outflow of resources decreased ($2,843,481) and relates to the refunding of the District’s<br />
2008 and 2011 certificates of participation which were refunded through the 2015 Replenishment<br />
Assessment Revenue Bonds.<br />
Total liabilities increased $5.1 million or 2.6% due to a decrease of ($2.4 million) in current liabilities<br />
and an increase of $7.5 million in noncurrent liabilities.<br />
At the end of fiscal years <strong>2017</strong> and 2016, the District shows a positive balance in unrestricted net<br />
position of $54,655,690 and $42,328,756, respectively, which will primarily be used for the future<br />
purchase of replenishment water.<br />
Statement of Revenues, Expenses and Changes in Net Position<br />
Condensed Statements of Revenues, Expenses and Changes in Net Position<br />
Year Ended June 30, Change Year ended<br />
Change<br />
<strong>2017</strong> 2016 Amount % 2015 Amount %<br />
Revenues:<br />
Operating revenues $ 74,573,333 $ 59,852,856 $ 14,720,477 24.6 $ 80,154,123 $ (20,301,267) (25.3)<br />
Nonoperating revenues<br />
Property taxes 613,015 585,957 27,058 4.6 581,180 4,777 0.8<br />
Interest and investment earnings 864,242 562,438 301,804 53.7 163,704 398,734 243.6<br />
Other, net 3,270,421 4,192,116 (921,695) (22.0) 4,102,881 89,235 2.2<br />
Total revenues 79,321,011 65,193,367 14,127,644 21.7 85,001,888 (19,808,521) (23.3)<br />
Expenses<br />
Operating expenses 62,347,174 51,786,834 10,560,340 20.4 69,991,319 (18,204,485) (26.0)<br />
Depreciation and amortization 4,014,947 4,003,734 11,213 0.3 2,629,444 1,374,290 52.3<br />
Nonoperating expenses 4,250,569 2,148,520 2,102,049 97.8 3,541,948 (1,393,428) (39.3)<br />
Total expenses 70,612,690 57,939,088 12,673,602 21.9 76,162,711 (18,223,623) (23.9)<br />
Income before capital contributions 8,708,321 7,254,279 1,454,042 20.0 8,839,177 (1,584,898) (17.9)<br />
Capital contributions - capital grants 7,550,656 450,878 7,099,778 1,574.7 1,109,714 (658,836) (59.4)<br />
Change in net position 16,258,977 7,705,157 8,553,820 111.0 9,948,891 (2,243,734) (22.6)<br />
Net position at beginning of year 87,722,701 80,017,544 7,705,157 9.6 70,068,653 9,948,891 14.2<br />
Net position at end of year $ 103,981,678 $ 87,722,701 $ 16,258,977 18.5 $ 80,017,544 $ 7,705,157 9.6<br />
The Statement of Revenues, Expenses and Changes in Net Position shows how the District's net<br />
position changed during the fiscal year. The net position increased $16,258,977 and $7,705,157<br />
during the fiscal years ended June 30, <strong>2017</strong> and 2016, respectively. In fiscal year <strong>2017</strong>, the<br />
increase in net position is due to total revenues of $79,321,011 exceeding total expenses of<br />
$70,612,690 with capital contributions of $7,550,656. In fiscal year 2016, the increase in net position<br />
is due to total revenues of $65,193,367 exceeding total expenses of $57,939,088 with capital<br />
contributions of $450,878.<br />
A closer examination of the sources of changes in net position reveals that:<br />
5
Water Replenishment District of Southern California<br />
Management’s Discussion and Analysis (Unaudited)<br />
June 30, <strong>2017</strong> and 2016<br />
In fiscal year <strong>2017</strong>, total revenue increased $14,127,644 and total expenses increased $12,673,602<br />
for a net increase of $1,454,042. The District also saw an increase in capital contributions of<br />
$7,099,778 for a change in net position for <strong>2017</strong> of $8,553,820.<br />
Total revenue decreased ($19,808,521) in 2016 and total expenses decreased ($18,223,623) for a<br />
net decrease of ($1,584,898). The District also saw a decrease in capital contributions of ($658,836)<br />
for a change in net position for 2016 of ($2,243,734).<br />
Operating Revenues<br />
<strong>2017</strong> 2016 Change 2015 Change<br />
Operating Revenues:<br />
Water replenishment assessment $ 73,822,097 $ 58,128,626 $ 15,693,471 $ 79,085,428 $ (20,956,802)<br />
Desalter assessments - 619,806 (619,806) 517,963 101,843<br />
Water treatment subsidies 355,914 412,706 (56,792) 182,649 230,057<br />
Other operating income 395,322 691,718 (296,396) 368,083 323,635<br />
Total operating revenues $ 74,573,333 $ 59,852,856 $ 14,720,477 $ 80,154,123 $ (20,301,267)<br />
Total operating revenues increased $14,720,477 from $59,852,856 in 2016 to $74,573,333 in fiscal<br />
year <strong>2017</strong>. The primary reasons for the increase is due to an increase in the replenishment<br />
assessment from $297.00 acre-foot to $318.00 per acre-foot and an increase in deferred revenue<br />
due to imported spreading water purchases.<br />
In 2016, the District did not recognize as much deferred revenue as in the prior year and water<br />
replenishment assessment revenues returned to pre-2015 levels.<br />
Operating Expenses - Water Supply Management Expenses<br />
<strong>2017</strong> 2016 Change 2015 Change<br />
Water supply management:<br />
Water purchases - injecting $ 21,344,615 $ 17,798,133 $ 3,546,482 $ 23,385,697 $ (5,587,564)<br />
Water purchases - spreading 22,333,722 16,290,901 6,042,821 14,325,715 1,965,186<br />
Connection fees 4,010,063 2,824,490 1,185,573 2,586,820 237,670<br />
Total water supply management expenses $ 47,688,400 $ 36,913,524 $ 10,774,876 $ 40,298,232 $ (3,384,708)<br />
Water purchases make up the majority of the District’s total operating expenses which saw an<br />
increase of $10,774,876 over the prior fiscal year. The main reason for the change was due to an<br />
increase of $6,042,821 in imported spreading water purchased for replenishment. Additionally, there<br />
was a net increase of $3,546,482 for the purchase of injection water at the seawater intrusion<br />
barriers with additional imported injection water purchased at both the West Coast Barrier and the<br />
Alamitos Barrier, along with reduced injection of at the Dominguez Gap Barrier.<br />
6
Water Replenishment District of Southern California<br />
Management’s Discussion and Analysis (Unaudited)<br />
June 30, <strong>2017</strong> and 2016<br />
Capital Assets Administration<br />
At June 30, <strong>2017</strong> and 2016, the District’s investment in capital assets amounted to $195,214,183<br />
and $141,795,238 (net of accumulated depreciation), respectively. This investment in capital assets<br />
includes land, utility plant, monitoring and injection equipment, service connections, office furniture<br />
and equipment, and construction-in-progress. Major capital asset additions during fiscal year <strong>2017</strong><br />
and 2016 include expenses related to the Leo J. Vander Lans Advanced Water Treatment Facility<br />
Expansion Project, Goldsworthy Desalter, the Regional Groundwater Monitoring Program and the<br />
Groundwater Reliability Improvement Program (GRIP).<br />
The capital assets of the District are summarized below and more fully analyzed in Note 4 to the<br />
basic financial statements.<br />
Balance Additions/ Deletions/ Balance<br />
July 1, 2016 Transfers Transfers June 30, <strong>2017</strong><br />
Non-depreciable assets $ 61,504,989 $ 57,408,281 $ - $ 118,913,270<br />
Depreciable assets 112,262,505 25,611 (183,591) 112,104,525<br />
Accumulated depreciation (31,972,256) (4,014,947) 183,591 (35,803,612)<br />
Capital assets, net $ 141,795,238 $ 53,418,945 $ - $ 195,214,183<br />
Balance Additions/ Deletions/ Balance<br />
July 1, 2015 Transfers Transfers June 30, 2016<br />
Non-depreciable assets $ 72,901,147 $ 28,887,664 $ (40,283,822) $ 61,504,989<br />
Depreciable assets 72,018,807 40,308,532 (64,834) 112,262,505<br />
Accumulated depreciation (28,033,356) (4,003,734) 64,834 (31,972,256)<br />
Capital assets, net $ 116,886,598 $ 65,192,462 $ (40,283,822) $ 141,795,238<br />
Long-term Debt<br />
At June 30, <strong>2017</strong> and 2016, the District had long-term debt of $178,903,498 and $171,569,874<br />
outstanding, respectively (See Note 6 to the basic financial statement for further details).<br />
Changes in long-term debt in fiscal year <strong>2017</strong> were as follows:<br />
Balance Balance<br />
July 1, 2016 Additions Deletions June 30, <strong>2017</strong><br />
Replenishment Assessment Revenue Bonds $ 148,345,000 $ - $ (1,655,000) $ 146,690,000<br />
Clean Water State Revolving Fund Loan - 9,778,138 - 9,778,138<br />
148,345,000 9,778,138 (1,655,000) 156,468,138<br />
Bond premium 23,224,874 - (789,514) 22,435,360<br />
Total long-term debt $ 171,569,874 $ 9,778,138 $ (2,444,514) $ 178,903,498<br />
7
Water Replenishment District of Southern California<br />
Management’s Discussion and Analysis (Unaudited)<br />
June 30, <strong>2017</strong> and 2016<br />
Changes in long-term debt in fiscal year 2016 were as follows:<br />
Balance Balance<br />
July 1, 2015 Additions Deletions June 30, 2016<br />
Certificates of participation (2004) $ 12,595,000 $ - $ (12,595,000) $ -<br />
Certificates of participation (2008) 16,560,000 - (16,560,000) -<br />
Certificates of participation (2011) 68,135,000 - (68,135,000) -<br />
Replenishment Assessment Revenue Bonds - 148,345,000 - 148,345,000<br />
97,290,000 148,345,000 (97,290,000) 148,345,000<br />
Bond discount (390,435) - 390,435 -<br />
Bond premium 1,401,287 23,224,874 (1,401,287) 23,224,874<br />
Total long-term debt $ 98,300,852 $ 171,569,874 $ (98,300,852) $ 171,569,874<br />
Requests for Information<br />
This management’s discussion and analysis is designed to provide the District's funding sources,<br />
customers, stakeholders and other interested parties with an overview of the District's financial<br />
operations and overall financial condition. Should the reader have questions regarding the<br />
information included in this report or wish to request additional financial information, please contact<br />
the District's Chief Financial Officer at 4040 Paramount Boulevard, Lakewood, California 90712.<br />
8
Basic Financial Statements
(This page intentionally left blank.)
Water Replenishment District of Southern California<br />
Statements of Net Position<br />
June 30,<br />
<strong>2017</strong> 2016<br />
ASSETS<br />
Current assets<br />
Cash and cash equivalents $ 47,307,938 $ 47,303,889<br />
Water replenishment assessments receivable, net 20,481,843 20,683,118<br />
Grants receivable - 4,858<br />
Notes receivable - current portion 505,940 308,460<br />
Prepaid expenses and other deposits 216,236 186,466<br />
Total current assets - unrestricted 68,511,957 68,486,791<br />
Restricted current assets - cash and cash equivalents<br />
Cash and cash equivalents 33,015,303 75,168,581<br />
Total current assets 101,527,260 143,655,372<br />
Noncurrent assets<br />
Notes receivable - net of current portion 616,881 925,341<br />
Net pension asset 46,117 103,341<br />
Capital assets, net 195,214,183 141,795,238<br />
Total noncurrent assets 195,877,181 142,823,920<br />
Total assets 297,404,441 286,479,292<br />
DEFERRED OUTFLOWS OF RESOURCES<br />
Deferred amount on debt refunding 9,485,875 12,538,541<br />
Deferred outflows related to pensions 2,451,630 2,242,445<br />
Total deferred outflows of resources 11,937,505 14,780,986<br />
LIABILITIES<br />
Current liabilities<br />
Accounts payable and accrued expenses 8,965,483 9,370,037<br />
Accrued wages and related payables 190,998 246,579<br />
Compensated absences - current portion 184,190 178,201<br />
Advances from Caltrans 5,198,850 5,243,866<br />
Interest payable 2,893,625 5,463,640<br />
Long-term debt - current portion 2,350,000 1,655,000<br />
Total current liabilities 19,783,146 22,157,323<br />
Noncurrent liabilities<br />
Net pension liability 4,188,699 3,190,280<br />
Compensated absences - net of current portion 245,177 216,466<br />
Post employment benefits 125,859 305,895<br />
Long-term debt - net of current portion 176,553,498 169,914,874<br />
Total noncurrent liabilities 181,113,233 173,627,515<br />
Total liabilities 200,896,379 195,784,838<br />
DEFERRED INFLOWS OF RESOURCES<br />
Deferred inflows of resources - replenishment assessments 4,154,665 16,039,344<br />
Deferred inflows related to pensions 309,224 1,713,395<br />
Total deferred inflows of resources 4,463,889 17,752,739<br />
NET POSITION<br />
Net position<br />
Net investment in capital assets 49,325,988 45,393,945<br />
Unrestricted 54,655,690 42,328,756<br />
Total net position $ 103,981,678 $ 87,722,701<br />
See notes to the financial statements.<br />
9
Water Replenishment District of Southern California<br />
Statements of Revenues, Expenses, and Changes in Net Position<br />
Years ended June 30,<br />
<strong>2017</strong> 2016<br />
Operating revenues<br />
Water replenishment assessments $ 73,822,097 $ 58,128,626<br />
Desalter assessments - 619,806<br />
Water treatment subsidies 355,914 412,706<br />
Other operating income 395,322 691,718<br />
Total operating revenues 74,573,333 59,852,856<br />
Operating expenses<br />
Water supply management:<br />
Water purchases - injecting 21,344,615 17,798,133<br />
Water purchases - spreading 22,333,722 16,290,901<br />
Connection fees 4,010,063 2,824,490<br />
General and administrative 14,658,774 14,873,310<br />
Total operating expenses 62,347,174 51,786,834<br />
Operating income before depreciation and amortization 12,226,159 8,066,022<br />
Depreciation and amortization (4,014,947) (4,003,734)<br />
Operating income 8,211,212 4,062,288<br />
Nonoperating revenue (expense)<br />
Property taxes 613,015 585,957<br />
Interest and investment earnings 864,242 562,438<br />
Interest expense (2,875,746) (2,148,520)<br />
Election costs (1,374,823) -<br />
Other, net 3,270,421 4,192,116<br />
Net nonoperating revenue (expense) 497,109 3,191,991<br />
Income before capital contributions 8,708,321 7,254,279<br />
Capital contributions - capital grants 7,550,656 450,878<br />
Total capital contributions 7,550,656 450,878<br />
Change in net position 16,258,977 7,705,157<br />
Total net position - beginning of year 87,722,701 80,017,544<br />
Total net position - end of year $ 103,981,678 $ 87,722,701<br />
See notes to the financial statements.<br />
10
Water Replenishment District of Southern California<br />
Statements of Cash Flows<br />
Years ended June 30,<br />
<strong>2017</strong> 2016<br />
Cash flows from operating activities<br />
Cash receipts from water assessments and subsidies $ 62,889,929 $ 58,422,137<br />
Cash paid to vendors and suppliers for materials and services (56,128,440) (59,430,294)<br />
Cash paid to employees for salaries and wages (4,359,022) (3,470,647)<br />
Net cash provided by (used in) operating activities 2,402,467 (4,478,804)<br />
Cash flows from capital and related financing activities<br />
Acquisition and construction of capital assets (57,433,892) (28,912,374)<br />
Payment of long-term debt (1,655,000) (98,300,852)<br />
Proceeds from issuance of debt 9,778,138 171,569,874<br />
Proceeds from capital contributions - capital grants 7,555,514 457,536<br />
Deferred capital project (45,016) (97,002)<br />
Interest paid on long-term debt (6,235,275) 1,351,586<br />
Net cash provided by (used in) capital<br />
and related financing activities (48,035,531) 46,068,768<br />
Cash flows from non-capital financing activities<br />
Cash paid for election expenses (1,374,823) -<br />
Proceeds from other nonoperating revenue (expense), net 3,270,421 4,192,116<br />
Proceeds from property taxes 613,015 585,957<br />
Net cash provided by non-capital<br />
financing activities 2,508,613 4,778,073<br />
Cash flows from investing activities<br />
Principal received from (issuance of) notes receivable 110,980 694,828<br />
Interest and investment earnings 864,242 562,438<br />
Net cash provided by investing activities 975,222 1,257,266<br />
Change in cash and cash equivalents (42,149,229) 47,625,303<br />
Cash and cash equivalents - beginning of year 122,472,470 74,847,167<br />
Cash and cash equivalents - end of year $ 80,323,241 $ 122,472,470<br />
Reconciliation of cash and cash equivalents to statements of<br />
net position<br />
Cash and cash equivalents $ 47,307,938 $ 47,303,889<br />
Restricted assets - cash and cash equivalents 33,015,303 75,168,581<br />
Total cash and cash equivalents $ 80,323,241 $ 122,472,470<br />
Noncash, investing, capital and financing activities<br />
Capitalized interest $ 5,198,150 $ 4,486,520<br />
See notes to the financial statements.<br />
11
Water Replenishment District of Southern California<br />
Statements of Cash Flows (Continued)<br />
Years ended June 30,<br />
<strong>2017</strong> 2016<br />
Reconciliation of operating income to net cash<br />
provided by (used in) operating activities<br />
Operating income $ 8,211,212 $ 4,062,288<br />
Adjustments to reconcile operating income to net cash<br />
provided by (used in) operating activities:<br />
Depreciation 4,014,947 4,003,734<br />
Changes in assets and liabilities:<br />
(Increase) decrease in assets:<br />
Water replenishment assessments receivable, net 201,275 (4,180,653)<br />
Prepaid expenses and other deposits (29,770) 179,117<br />
Net pension assets 57,224 -<br />
Increase (decrease) in liabilities:<br />
Accounts payable and accrued expenses - water purchases (404,554) 1,640,926<br />
Deferred outflows of resources 2,843,481 (13,718,611)<br />
Deferred inflows of resources (13,288,850) 2,749,934<br />
Accrued wages and related payables (55,581) 118,044<br />
Net pension liability 998,419 334,023<br />
Post employment benefits (180,036) 305,895<br />
Compensated absences 34,700 26,499<br />
Total adjustments (5,808,745) (8,541,092)<br />
Net cash provided by (used in) operating activities $ 2,402,467 $ (4,478,804)<br />
See notes to the financial statements.<br />
12
Water Replenishment District of Southern California<br />
Notes to Financial Statements<br />
Years ended June 30, <strong>2017</strong> and 2016<br />
NOTE 1<br />
REPORTING ENTITY AND SUMMARY OF SIGNIFICANT ACCOUNTING POLICIES<br />
Organization and Operations of the Reporting Entity<br />
The Water Replenishment District of Southern California (District) was formed by a<br />
vote of the people in 1959 for the purpose of protecting the groundwater resources of<br />
the Central and West Coast groundwater basins in Southern Los Angeles County.<br />
The District provides groundwater management for four million residents in 43 cities<br />
of Southern Los Angeles County (County). The District was formed in response to a<br />
history of overpumping of the basins which caused wells to go dry and seawater to<br />
intrude into the potable water aquifers. The District's principal funding mechanisms<br />
include a water replenishment assessment on all the pumping from the groundwater<br />
basins and a general tax assessment in the form of a tax levy upon the real property<br />
and improvements within the County. The District is governed by a five member<br />
Board of Directors who serve overlapping four-year terms.<br />
The criteria used in determining the scope of the financial reporting entity is based on<br />
the provisions of Governmental Accounting Standards Board Statements No. 14 and<br />
61 (an amendment of No. 14). The District is the primary governmental unit based on<br />
the foundation of a separately elected governing board that is elected by the citizens<br />
in a general popular election. Component units are legally separate organizations for<br />
which the elected officials of the primary government are financially accountable. The<br />
District is financially accountable if it appoints a voting majority of the organization's<br />
governing body and: 1) it is able to impose its will on that organization, or 2) there is a<br />
potential for the organization to provide specific financial benefits to, or impose<br />
specific financial burdens on, the primary government.<br />
The Southern California Water Replenishment Financing Corporation (Corporation)<br />
was incorporated on March 11, 1999. The Corporation is a California nonprofit public<br />
benefit corporation formed to assist the District by acquiring, constructing, operating<br />
and maintaining facilities, equipment, or other property needed by the District and<br />
leasing or selling such property to the District and as such has no employees or other<br />
operations. Although the Corporation is a legally separate entity, it is included as a<br />
blended component unit of the District, as it is in substance a part of the District's<br />
operations. No separate financial statements are prepared for the Corporation.<br />
Basis of Accounting and Measurement Focus<br />
The District reports its activities as an enterprise fund, which is used to account for<br />
operations that are financed and operated in a manner similar to a private business<br />
enterprise, where the intent of the District is that the costs of managing the<br />
groundwater basins on a continuing basis are financed or recovered primarily through<br />
user charges (water replenishment assessments), capital grants and similar funding.<br />
Revenues and expenses are recognized on the full accrual basis of accounting.<br />
Revenues from water replenishment assessments are recognized in the accounting<br />
period in which related costs or charges associated with the rates assessed are<br />
incurred. Expenses are recognized in the period incurred.<br />
13
Water Replenishment District of Southern California<br />
Notes to Financial Statements<br />
Years ended June 30, <strong>2017</strong> and 2016<br />
NOTE 1 REPORTING ENTITY AND SUMMARY OF SIGNIFICANT ACCOUNTING<br />
POLICIES (CONTINUED)<br />
Operating revenues, such as water replenishment assessments, result from<br />
exchange transactions associated with the District’s principal activity. Exchange<br />
transactions are those in which each party receives and gives up essentially equal<br />
value. Nonoperating revenues, such as grant funding and investment income, result<br />
from non-exchange transactions, in which, the District gives or receives value without<br />
directly receiving or giving value in exchange. Operating expenses, such as water<br />
purchases, are the result of the District’s exchange transactions along with<br />
associated expenses for running the District’s day-to-day operations. Nonoperating<br />
expenses, such as interest paid on debt service or election costs every other year,<br />
are the result of expenses that do not relate to the District’s day-to-day operations.<br />
Financial Reporting<br />
The District's basic financial statements are presented in conformance with the<br />
provisions of Governmental Accounting Standards Board (GASB) Statement No. 34,<br />
Basic Financial Statements and Management's Discussion and Analysis - for State<br />
and Local Governments (GASB No. 34). This statement established revised financial<br />
reporting requirements for state and local governments throughout the United States<br />
for the purpose of enhancing the understandability and usefulness of financial<br />
reports.<br />
GASB No. 34 and its related GASB pronouncements provide for a revised view of<br />
financial information and restructure the format of financial information provided prior<br />
to its adoption. A statement of net position replaces the balance sheet and reports<br />
assets, liabilities, and the difference between them as net position, not equity. A<br />
statement of revenues, expenses and changes in net position replaces both the<br />
income statement and the statement of changes in retained earnings and contributed<br />
capital. GASB No. 34 also requires that the statement of cash flows be prepared<br />
using the direct method. Under the direct method, cash flows from operating activities<br />
are presented by major categories.<br />
Implementation of New Accounting Pronouncements<br />
During the fiscal year ended June 30, <strong>2017</strong>, the District adopted the following new<br />
Statements of GASB:<br />
<br />
GASB Statement No. 73, Accounting and Financial Reporting for Pensions<br />
and Related Assets That Are Not Within The Scope of GASB Statement 68,<br />
and Amendments to Certain Provisions of GASB Statements 67 and 68. The<br />
requirements of this Statement that address accounting and financial<br />
reporting by employers and governmental nonemployer contributing entities<br />
for pensions that are not within the scope of Statement 68 are effective for<br />
financial statements for fiscal years beginning after June 15, 2016. The<br />
implementation of this Statement did not materially impact the District’s<br />
financial statements for the fiscal year ended June 30, <strong>2017</strong>.<br />
14
Water Replenishment District of Southern California<br />
Notes to Financial Statements<br />
Years ended June 30, <strong>2017</strong> and 2016<br />
NOTE 1 REPORTING ENTITY AND SUMMARY OF SIGNIFICANT ACCOUNTING<br />
POLICIES (CONTINUED)<br />
<br />
<br />
<br />
<br />
<br />
<br />
GASB Statement No. 74, Financial Reporting for Postemployment Benefit<br />
Plans Other Than Pension Plans. This Statement is effective for financial<br />
statements for fiscal years beginning after June 15, 2016. Earlier application<br />
is encouraged. The implementation of this Statement did not materially<br />
impact the District’s financial statements for the fiscal year ended June 30,<br />
<strong>2017</strong><br />
GASB Statement No. 77, Tax Abatement Disclosures. The requirements of<br />
this Statement are effective for reporting periods beginning after December<br />
15, 2015. The implementation of this Statement did not materially impact the<br />
District’s financial statements for the fiscal year ended June 30, <strong>2017</strong>.<br />
GASB Statement No. 78, Pensions Provided Through Certain Multiple-<br />
Employer Defined Benefit Pension Plans. The requirements of this Statement<br />
are effective for reporting periods beginning after December 15, 2015. The<br />
implementation of this Statement did not materially impact the District’s<br />
financial statements for the fiscal year ended June 30, <strong>2017</strong>.<br />
GASB Statement No. 79, Certain External Investment Pools and Pool<br />
Participants. The requirements of this Statement are effective for reporting<br />
periods beginning after June 15, 2015, except for the provisions in<br />
paragraphs 18, 19, 23-26, and 40, which are effective for reporting periods<br />
beginning after December 15, 2015. The implementation of this Statement<br />
did not materially impact the District’s financial statements for the fiscal year<br />
ended June 30, <strong>2017</strong>.<br />
GASB Statement No. 80, Blending Requirements for Certain Component<br />
Units – an Amendment of GASB Statement No. 14. The requirements of this<br />
Statement are effective for reporting periods beginning after June 15,<br />
2016. The implementation of this Statement did not materially impact the<br />
District’s financial statements for the fiscal year ended June 30, <strong>2017</strong>.<br />
GASB Statement No. 82, Pension Issues – an Amendment of GASB<br />
Statements No. 67, No. 68, and No. 73. The requirements of this Statement<br />
are effective for reporting periods beginning after June 15, 2016, except for<br />
the requirements of paragraph 7 in a circumstance in which an employer’s<br />
pension liability is measured as of a date other than the employer’s most<br />
recent fiscal year-end. In that circumstance, the requirements of paragraph 7<br />
are effective for that employer in the first reporting period in which the<br />
measurement date of the pension liability is on or after June 15, <strong>2017</strong>. The<br />
implementation of this Statement did not materially impact the District’s<br />
financial statements for the fiscal year ended June 30, <strong>2017</strong>.<br />
15
Water Replenishment District of Southern California<br />
Notes to Financial Statements<br />
Years ended June 30, <strong>2017</strong> and 2016<br />
NOTE 1 REPORTING ENTITY AND SUMMARY OF SIGNIFICANT ACCOUNTING<br />
POLICIES (CONTINUED)<br />
Pension<br />
For purposes of measuring the net pension liability and deferred outflows/inflows of<br />
resources related to pension, and pension expense, information about the fiduciary<br />
net position of the District’s California Public Employees’ Retirement System<br />
(CalPERS) plan (Plan) and additions to/deductions from the Plan’s fiduciary net<br />
position have been determined on the same basis as they are reported by CalPERS.<br />
For this purpose, benefit payments (including refunds of employee contributions) are<br />
recognized when due and payable in accordance with the benefit terms. Investments<br />
are reported at fair value.<br />
Assets, Liabilities and Net Position<br />
Use of Estimates - The preparation of the basic financial statements in conformity<br />
with accounting principles generally accepted in the United States of America<br />
requires management to make estimates and assumptions that affect the reported<br />
amounts of assets and liabilities and disclosures of contingent assets and liabilities at<br />
the date of the financial statements and the reported changes in net position during<br />
the reporting period. Actual results could differ from those estimates.<br />
Cash and Cash Equivalents - Whenever possible, the District's cash is invested in<br />
interest bearing accounts. However, the safety and liquidity of the District’s cash<br />
always takes priority over yield. The District considers all highly liquid investments<br />
with a maturity of 12 months or less to be cash equivalents.<br />
Water Replenishment Assessments Receivable - The District extends credit to<br />
customers in the normal course of operations. Management closely monitors<br />
outstanding balances and, based on collection experience, has determined an<br />
allowance for doubtful accounts of $0 at June 30, <strong>2017</strong> and 2016.<br />
Grants Receivable - When a grant agreement is approved and eligible expenditures<br />
are incurred, the amount is recorded as a grant receivable on the statement of net<br />
position and as a grant contribution on the statement of revenues, expenses and<br />
changes in net position.<br />
Property Taxes and Assessments - The County Assessor's Office assesses all real<br />
and personal property within the County each year. The County Tax Collector's Office<br />
bills and collects the District's share of property taxes and assessments. The County<br />
Treasurer's Office remits current and delinquent property tax collections to the District<br />
throughout the year. Property tax in California is levied in accordance with Article 13A<br />
of the State Constitution at one percent (1%) of countywide assessed valuations.<br />
Property taxes receivable at year-end are related to property taxes collected by the<br />
County, which have not been credited to the District's cash balance as of June 30.<br />
The property tax calendar is as follows:<br />
Lien date March 1<br />
Levy date July 1<br />
Due dates November 1 and March 1<br />
Collection dates December 10 and April 10<br />
16
Water Replenishment District of Southern California<br />
Notes to Financial Statements<br />
Years ended June 30, <strong>2017</strong> and 2016<br />
NOTE 1 REPORTING ENTITY AND SUMMARY OF SIGNIFICANT ACCOUNTING<br />
POLICIES (CONTINUED)<br />
Prepaid Expenses and Other Deposits - Certain payments to vendors reflect costs or<br />
deposits applicable to future accounting periods and are recorded as prepaid items in<br />
the basic financial statements.<br />
Capital Assets - Capital assets acquired and/or constructed are capitalized at<br />
historical cost. District policy has set the capitalization threshold for reporting capital<br />
assets at $5,000. Donated assets are recorded at acquisition value at the date of<br />
donation. Upon retirement or other disposition of capital assets, the cost and related<br />
accumulated depreciation are removed from the respective balances and any gains<br />
or losses are recognized. A provision for depreciation is computed using the straightline<br />
method over the following estimated useful lives of the assets:<br />
<br />
<br />
<br />
<br />
<br />
Utility plant and equipment and capacity rights - 30 years<br />
Monitoring and injection equipment - 3 to 20 years<br />
Service connections - 50 years<br />
Office furniture and equipment - 5 to 10 years<br />
Building and improvements - 30 to 40 years<br />
In accordance with GASB Statement No. 42, Accounting and Financial Reporting for<br />
Impairment of Capital Assets and for Insurance Recoveries, the District has<br />
evaluated prominent events or changes in circumstances affecting capital assets to<br />
determine whether impairment of a capital asset has occurred. Management<br />
asserted that there were no impairments of capital assets as of June 30, <strong>2017</strong> and<br />
2016.<br />
Bond discount – The Bond discount is being amortized using the effective interest<br />
method.<br />
Compensated Absences - The District's policy is to permit employees to accumulate<br />
a limited amount of earned vacation and sick leave. Normally, an employee cannot<br />
accrue more than thirty days of vacation. Sick leave is payable when an employee is<br />
unable to work because of illness. Upon termination, an employee will be paid for any<br />
unused sick leave. Accumulated vacation time is accrued at year-end to account for<br />
the District's obligation to the employees for the amount owed. It is management's<br />
belief that the majority of the obligation will be utilized during the course of the next<br />
fiscal year. Vacation pay is payable to employees at the time a vacation is taken or<br />
upon termination of employment.<br />
Deferred Outflows and Inflows of Resources<br />
Pursuant to GASB Statement Nos. 63 and 65, the District recognizes deferred<br />
outflows and inflows of resources. A deferred outflow of resources is defined as a<br />
consumption of net position by the government that is applicable to a future reporting<br />
period. A deferred inflow of resources is defined as an acquisition of net position by<br />
the government that is applicable to a future reporting period.<br />
17
Water Replenishment District of Southern California<br />
Notes to Financial Statements<br />
Years ended June 30, <strong>2017</strong> and 2016<br />
NOTE 1 REPORTING ENTITY AND SUMMARY OF SIGNIFICANT ACCOUNTING<br />
POLICIES (CONTINUED)<br />
Net Position - The financial statements utilize a net position presentation. Net position<br />
is categorized as follows:<br />
<br />
<br />
<br />
Net investment in capital assets - This component of net position consists of<br />
capital assets and unexpended proceeds of debt restricted to the financing of<br />
capital assets, net of accumulated depreciation and reduced by any related<br />
debt outstanding against the acquisition, construction or improvement of<br />
those capital assets.<br />
Restricted - This component of net position consists of constraints placed on<br />
net position use through external restrictions imposed by creditors, grantors,<br />
contributors, or laws or regulations of other governments or restrictions<br />
imposed by law through constitutional provisions or enabling legislation. The<br />
District did not have any restricted net position as of June 30, <strong>2017</strong> and 2016.<br />
Unrestricted - This component of net position consists of net position that<br />
does not meet the definition of restricted net position or net investment in<br />
capital assets.<br />
Revenues, Expenses and Changes in Net Position<br />
Water Replenishment Assessments - Water replenishment assessments are billed<br />
on a monthly basis and are recognized in the accounting period in which related<br />
costs or charges associated with the rates assessed are incurred.<br />
Overhead Absorption - Certain operating expenses are allocated to capital assets<br />
using management's allocation of manpower and service estimates that are directly<br />
related to the construction of capital assets.<br />
Capital Contributions - Capital contributions represent cash and capital asset<br />
additions contributed to the District by State granting agencies.<br />
Other<br />
Budgetary Policies - The District adopts an annual non-appropriated budget for<br />
planning, control, and evaluation purposes. Budgetary control and evaluation are<br />
affected by comparisons of actual revenues and expenses with planned revenues<br />
and expenses for the period.<br />
Reclassifications<br />
Certain reclassifications have been made to the prior year financial statement<br />
presentation to conform to the current year’s format. Total net position and change in<br />
net position are unchanged from these reclassifications.<br />
NOTE 2<br />
CASH AND INVESTMENTS<br />
Cash and investments as of June 30 are classified in the accompanying financial<br />
statements as follows:<br />
18
Water Replenishment District of Southern California<br />
Notes to Financial Statements<br />
Years ended June 30, <strong>2017</strong> and 2016<br />
NOTE 2<br />
CASH AND INVESTMENTS (CONTINUED)<br />
<strong>2017</strong> 2016<br />
Cash and cash equivalents $ 57,086,076 $ 47,303,889<br />
Restricted cash and cash equivalents 23,237,165 75,168,581<br />
Total cash and cash equivalents $ 80,323,241 $ 122,472,470<br />
Cash and investments as of June 30 consist of the following:<br />
<strong>2017</strong> 2016<br />
Deposits with financial institutions $ 62,631,845 $ 52,846,336<br />
Cash and cash equivalents with fiscal agent<br />
Total cash and cash equivalents $<br />
17,691,396<br />
80,323,241 $<br />
69,626,134<br />
122,472,470<br />
The District’s cash and cash equivalents balance as of June 30 are presented as<br />
follows:<br />
<strong>2017</strong> 2016<br />
Operating Reserve Fund $ 11,167,048 $ 4,192,471<br />
Reserved cash and cash equivalents:<br />
Water Purchase Fund 17,713,076 30,701,860<br />
Capital Projects 8,014,637 4,879,075<br />
Debt Service Reserve Fund 13,411,553 15,949,262<br />
Total reserved cash and cash equivalents 39,139,266 51,530,197<br />
Restricted cash:<br />
Capital Projects - Bond Trustee 24,469,410 69,626,134<br />
Cal Trans Trust Fund 5,545,769 5,542,446<br />
Debt Service Reserve Fund - Bond Trustee 1,748 1,748<br />
Restricted cash and cash equivalents 30,016,927 75,170,328<br />
Reconciling items:<br />
Capital Projects Reimbursement in Transit - (8,420,526)<br />
Total restricted cash 30,016,927 66,749,802<br />
Total Cash and Cash Equivalents $ 80,323,241 $ 122,472,470<br />
Investments Authorized by the California Government Code and the District's<br />
Investment Policy<br />
The table below identifies the investment types that are authorized for the District by<br />
the California Government Code (or the District's investment policy, where more<br />
restrictive). The table also identifies certain provisions of the California Government<br />
Code (or the District's investment policy, where more restrictive) that addresses<br />
interest rate risk, credit risk, and concentration of credit risk. This table does not<br />
address investments of debt proceeds held by the bond trustee that are governed by<br />
the provisions of debt agreements of the District, rather than the general provisions<br />
of the California Government Code or the District's investment policy.<br />
19
Water Replenishment District of Southern California<br />
Notes to Financial Statements<br />
Years ended June 30, <strong>2017</strong> and 2016<br />
NOTE 2<br />
CASH AND INVESTMENTS (CONTINUED)<br />
Maximum Maximum<br />
Maximum Percentage Investment in<br />
Authorized Investment Type Maturity of Portfolio One Issuer<br />
Local Agency Bonds 5 years None None<br />
U.S. Treasury Obligations 5 years None None<br />
U.S. Agency Securities 5 years None None<br />
Banker's Acceptances 180 days 40% 30%<br />
Commercial Paper 270 days 25% 10%<br />
Negotiable Certificates of Deposit 5 years 30% None<br />
Repurchase Agreements 1 year None None<br />
Reverse Repurchase Agreements 92 days 20% off base value None<br />
Medium-Term Notes 5 years 30% None<br />
Mutual Funds N/A 20% 10%<br />
Money Market Mutual Funds N/A 20% 10%<br />
Mortgage Pass-Through Securities 5 years 20% None<br />
County Pooled Investment Funds N/A None None<br />
Local Agency Investment Fund (LAIF) N/A None None<br />
Investments Authorized by Debt Agreements<br />
Investments of debt proceeds held by the bond trustee are governed by provisions of<br />
the debt agreements, rather than the general provisions of the California Government<br />
Code or the District's investment policy. The table below identifies the investment<br />
types that are authorized for investments held by the bond trustee. The table also<br />
identifies certain provisions of these debt agreements that address interest rate risk,<br />
credit risk, and concentration of credit risk.<br />
Maximum Maximum<br />
Maximum Percentage Investment in<br />
Authorized Investment Type Maturity of Portfolio One Issuer<br />
U.S. Treasury Obligations None None None<br />
U.S. Agency Securities None None None<br />
Banker's Acceptances 180 days None None<br />
Commercial Paper 270 days None None<br />
Money Market Mutual Funds N/A None None<br />
Investment Contracts 30 years None None<br />
Disclosures Relating to Interest Rate Risk<br />
Interest rate risk is the risk that changes in market interest rates will adversely affect<br />
the fair value of an investment. Generally, the longer the maturity of an investment,<br />
the greater the sensitivity of its fair value to changes in market interest rates. One of<br />
the ways that the District manages its exposure to interest rate risk is by purchasing<br />
a combination of shorter-term and longer-term investments and by timing cash flows<br />
from maturities so that a portion of the portfolio is maturing or coming close to<br />
maturity over time as necessary to provide the cash flow and liquidity needed for<br />
operations. As of June 30, <strong>2017</strong> and 2016, the District’s funds are placed in<br />
investments with maturities of 12 months or less.<br />
20
Water Replenishment District of Southern California<br />
Notes to Financial Statements<br />
Years ended June 30, <strong>2017</strong> and 2016<br />
NOTE 2<br />
CASH AND INVESTMENTS (CONTINUED)<br />
Information about the sensitivity of the fair values of the District's investments to<br />
market interest rate fluctuations is provided by the following table that shows the<br />
distribution of the District's investments by maturity:<br />
Maturities of investments at June 30, <strong>2017</strong>, were as follows:<br />
Remaining Maturity (in Months)<br />
12 Months 13 to 24 25+<br />
Investment Type Total or Less Months Months<br />
Cash and investments with fiscal agent:<br />
Money Market Mutual Funds $ 38,150,968 $ 38,150,968 $ - $ -<br />
Maturities of investments at June 30, 2016, were as follows:<br />
Remaining Maturity (in Months)<br />
12 Months 13 to 24 25+<br />
Investment Type Total or Less Months Months<br />
Cash and investments with fiscal agent:<br />
Money Market Mutual Funds $ 86,119,032 $ 86,119,032 $ - $ -<br />
Disclosures Relating to Credit Risk<br />
Generally, credit risk is the risk that an issuer of an investment will not fulfill its<br />
obligation to the holder of the investment. This is measured by the assignment of a<br />
rating by a nationally recognized statistical rating organization. Presented below is<br />
the minimum rating required by (where applicable) the California Government Code,<br />
the District's investment policy, or debt agreements, and the actual rating as of yearend<br />
for each investment type.<br />
Credit ratings of cash equivalents and investments as of June 30, <strong>2017</strong>, were as<br />
follows:<br />
Minimum<br />
Legal Ratings as of Year End<br />
Investment Type Total Rating Unrated AAA AA- BBB+<br />
Cash and investments with fiscal agent:<br />
Money Market Mutual Funds $ 38,150,968 A $ - $ 38,150,968 $ - $ -<br />
Credit ratings of cash equivalents and investments as of June 30, 2016, were as<br />
follows:<br />
Minimum<br />
Legal Ratings as of Year End<br />
Investment Type Total Rating Unrated AAA AA- BBB+<br />
Cash and investments with fiscal agent:<br />
Money Market Mutual Funds $ 86,119,032 A $ - $ 86,119,032 $ - $ -<br />
Concentration of Credit Risk<br />
The District’s investment policy contains no limitations on the amount that can be<br />
invested in any one issuer beyond that stipulated by the California Government<br />
Code. As of June 30, <strong>2017</strong> and 2016, there were no investments in any one issuer<br />
(other than U.S. Treasury securities, mutual funds, and external investment pools)<br />
that represent 5% or more of total District investments.<br />
21
Water Replenishment District of Southern California<br />
Notes to Financial Statements<br />
Years ended June 30, <strong>2017</strong> and 2016<br />
NOTE 2<br />
CASH AND INVESTMENTS (CONTINUED)<br />
Custodial Credit Risk<br />
Custodial credit risk for deposits is the risk that, in the event of the failure of a<br />
depository financial institution, a government will not be able to recover its deposits<br />
or will not be able to recover collateral securities that are in the possession of an<br />
outside party. The custodial credit risk for investments is the risk that, in the event of<br />
the failure of the counterparty (e.g., broker-dealer) to a transaction, a government will<br />
not be able to recover the value of its investment or collateral securities that are in<br />
the possession of another party. The California Government Code and the District's<br />
investment policy do not contain legal or policy requirements that would limit the<br />
exposure to custodial credit risk for deposits or investments, other than the following<br />
provision for deposits: The California Government Code requires that a financial<br />
institution secure deposits made by state or local governmental units by pledging<br />
securities in an undivided collateral pool held by a depository regulated under state<br />
law (unless so waived by the governmental unit). The market value of the pledged<br />
securities in the collateral pool must equal at least 110% of the total amount<br />
deposited by the public agencies. California law also allows financial institutions to<br />
secure District deposits by pledging first trust deed mortgage notes having a value of<br />
150% of the secured public deposits.<br />
As of June 30, <strong>2017</strong>, $46,997,556 of the District's deposits with financial institutions<br />
in excess of federal depository insurance limits was held in collateralized accounts.<br />
Fair Value Measurements<br />
During the fiscal year ended June 30, 2016, the District implemented GASB<br />
Statement No. 72, Fair Value Measurement and Application. GASB Statement No.<br />
72 establishes a fair value hierarchy that prioritizes the inputs to valuation techniques<br />
used to measure fair value. The District categorizes its fair value measurements<br />
within the fair value hierarchy established by generally accepted accounting<br />
principles. The hierarchy is based on the valuation inputs used to measure the fair<br />
value of the asset. Level 1 inputs are quoted prices in active markets for identical<br />
assets; Level 2 inputs are significant other observable inputs; while Level 3 inputs<br />
are significant unobservable inputs.<br />
<br />
<br />
<br />
Level 1 - inputs are quoted prices for identical assets or liabilities in active<br />
markets that government can access at the measurement date.<br />
Level 2 - inputs are other than quoted prices included in Level 1 that are<br />
observable for an asset or liability, either directly or indirectly.<br />
Level 3 - inputs are unobservable inputs for an asset or liability.<br />
The only investments that the District has are money market mutual funds which are<br />
not subject to the fair value measurement requirements of GASB Statement No. 72.<br />
22
Water Replenishment District of Southern California<br />
Notes to Financial Statements<br />
Years ended June 30, <strong>2017</strong> and 2016<br />
NOTE 3<br />
NOTES RECEIVABLE<br />
Notes receivable are presented as follows in the statement of net position as of<br />
June 30:<br />
<strong>2017</strong> 2016<br />
Notes receivable - current portion $ 505,940 $ 308,460<br />
Notes receivable - noncurrent portion 616,881 925,341<br />
$ 1,122,821 $ 1,233,801<br />
City of Lakewood<br />
On November 24, 2008, the District entered into a loan agreement with the City of<br />
Lakewood for a maximum loan amount of $2,200,000 to finance the design,<br />
installation and construction of a wellhead treatment system at the City’s<br />
groundwater well. The loan is payable annually over a 10 year period. The loan is<br />
unsecured and non-interest bearing. The project was completed during the fiscal<br />
year 2010-2011. Annual repayment of the loan in the amount of $220,000 started<br />
upon completion of the project and full disbursement of the loan proceeds to the City.<br />
The balance at June 30, <strong>2017</strong> and 2016 was $789,921.<br />
City of Maywood<br />
On June 19, 2009, the District entered into a loan agreement with the Maywood<br />
Mutual Water Company Number 2 (Water Company) for a maximum loan amount of<br />
$900,000, to finance the design, installation and construction of a wellhead treatment<br />
system at the Water Company’s groundwater well. The loan is payable annually over<br />
a 10 year period. The loan is unsecured and non-interest bearing. The Water<br />
Company has drawn down a total of $1,109,801 as of June 30, <strong>2017</strong>. Annual<br />
repayment of the loan in the amount of $110,000 started in the fiscal year 2010-2011<br />
when the project was completed. The outstanding balance at June 30, <strong>2017</strong> and<br />
2016 was $332,900 and $443,880, respectively.<br />
Future scheduled repayments of notes receivable are as follows:<br />
Year ending June 30<br />
Amount<br />
2018 $ 505,940<br />
2019 308,460<br />
2020 308,421<br />
$ 1,122,821<br />
23
Water Replenishment District of Southern California<br />
Notes to Financial Statements<br />
Years ended June 30, <strong>2017</strong> and 2016<br />
NOTE 4<br />
CAPITAL ASSETS<br />
Changes in capital assets for the year ended June 30, <strong>2017</strong> were as follows:<br />
Balance Additions/ Deletions/ Balance<br />
July 1, 2016 Transfers Transfers June 30, <strong>2017</strong><br />
Non-depreciable assets<br />
Land $ 13,065,694 $ 3,608,049 $ - $ 16,673,743<br />
Construction-in-process 48,439,295 53,800,232 - 102,239,527<br />
Total non-depreciable assets 61,504,989 57,408,281 - 118,913,270<br />
Depreciable assets<br />
Bulding and improvements 10,283,111 - - 10,283,111<br />
Utility plant and equipment 78,358,170 - - 78,358,170<br />
Capacity rights 2,439,604 - - 2,439,604<br />
Monitoring and injection equipment 21,080,200 25,611 (183,591) 20,922,220<br />
Service connections 101,420 - - 101,420<br />
Total depreciable assets 112,262,505 25,611 (183,591) 112,104,525<br />
Accumulated depreciation and amortization<br />
Building and improvements (2,438,665) (275,374) - (2,714,039)<br />
Utility plant and equipment (17,731,453) (2,619,270) - (20,350,723)<br />
Capacity rights (894,729) (81,309) - (976,038)<br />
Monitoring and injection equipment (10,818,586) (1,036,966) 183,591 (11,671,961)<br />
Service connections (88,823) (2,028) - (90,851)<br />
Total accumulated depreciation and amortization (31,972,256) (4,014,947) 183,591 (35,803,612)<br />
Depreciable assets, net 80,290,249 (3,989,336) - 76,300,913<br />
Capital assets, net $ 141,795,238 $ 53,418,945 $ - $ $ 195,214,183<br />
Changes in capital assets for the year ended June 30, 2016 were as follows:<br />
Balance Additions/ Deletions/ Balance<br />
July 1, 2015 Transfers Transfers June 30, 2016<br />
Non-depreciable assets<br />
Land $ 12,893,714 $ 171,980 $ - $ 13,065,694<br />
Construction-in-process 60,007,433 28,715,684 (40,283,822) 48,439,295<br />
Total non-depreciable assets 72,901,147 28,887,664 (40,283,822) 61,504,989<br />
Depreciable assets<br />
Bulding and improvements 10,283,111 - - 10,283,111<br />
Utility plant and equipment 38,074,348 40,283,822 - 78,358,170<br />
Capacity rights 2,439,604 - - 2,439,604<br />
Monitoring and injection equipment 21,120,324 24,710 (64,834) 21,080,200<br />
Service connections 101,420 - - 101,420<br />
Total depreciable assets 72,018,807 40,308,532 (64,834) 112,262,505<br />
Accumulated depreciation and amortization<br />
Building and improvements (2,163,291) (275,374) - (2,438,665)<br />
Utility plant and equipment (15,123,396) (2,608,057) - (17,731,453)<br />
Capacity rights (813,420) (81,309) - (894,729)<br />
Monitoring and injection equipment (9,846,454) (1,036,966) 64,834 (10,818,586)<br />
Service connections (86,795) (2,028) - (88,823)<br />
Total accumulated depreciation and amortization (28,033,356) (4,003,734) 64,834 (31,972,256)<br />
Depreciable assets, net 43,985,451 36,304,798 - 80,290,249<br />
Capital assets, net $ 116,886,598 $ 65,192,462 $ (40,283,822) $ $ 141,795,238<br />
24
Water Replenishment District of Southern California<br />
Notes to Financial Statements<br />
Years ended June 30, <strong>2017</strong> and 2016<br />
NOTE 4<br />
CAPITAL ASSETS (CONTINUED)<br />
Major capital asset additions during the year include work on various stages of<br />
construction projects. A significant portion of these additions related to various<br />
projects that were completed during the current year and transferred out of<br />
construction-in-process and into the related capital assets categories.<br />
The District engaged in various construction projects throughout the year. The<br />
balances of the various construction projects that comprise the construction-inprogress<br />
balances at as of June 30 are as follows:<br />
<strong>2017</strong> 2016<br />
Leo J. Vander Lans Advanced Water Treatment Facility $ 408,696 $ 10,973<br />
(LJVWTF) expansion<br />
Caltans Pipeline 913,182 875,981<br />
Goldworthy Desalter 17,812,248 7,722,714<br />
Regional Groundwater Monitoring Program 51,890 51,890<br />
Safe Drinking Water Program 806,189 798,002<br />
Dominguez Gap Recycled Water Project 808,973 804,698<br />
Replenishment operations (Interconnection Pipeline) 300,000 300,000<br />
Alamitos Physical Barrier Project 549,475 549,441<br />
Groundwater Replenishment Improvement Project (GRIP) 58,521,969 23,139,407<br />
Groundwater Infrastructure Improvements 779,147 596,036<br />
Environmental Monitoring 1,137,318 1,134,234<br />
Bond interest for capital projects 15,978,520 10,826,159<br />
<strong>WRD</strong> New Building 668,159 -<br />
Whittier Narrow Conservation Pool 817,915 477,915<br />
SCADA 1,357,280 419,671<br />
Asset Management 848,248 347,687<br />
Paramount Equipment/Fleet Center 319,279 264,508<br />
ADM 161,039 119,979<br />
Total construction-in-process $ 102,239,527 $ 48,439,295<br />
Capitalized Interest<br />
Interest is capitalized in connection with the construction of major facilities. The<br />
capitalized interest is recorded as part of the asset to which it relates and is<br />
amortized over the asset's estimated useful life. Interest cost of $5,198,150 and<br />
$4,486,520 was capitalized during the years ended June 30, <strong>2017</strong> and 2016,<br />
respectively.<br />
NOTE 5<br />
COMPENSATED ABSENCES<br />
Changes in compensated absences were as follows:<br />
<strong>2017</strong> 2016<br />
Balance at beginning of year $ 394,667 $ 368,168<br />
Earned by employees 200,748 216,903<br />
Payments to employees (166,048) (190,404)<br />
Balance at end of year 429,367 394,667<br />
Less current portion (184,190) (178,201)<br />
Long-term portion $ 245,177 $ 216,466<br />
25
Water Replenishment District of Southern California<br />
Notes to Financial Statements<br />
Years ended June 30, <strong>2017</strong> and 2016<br />
NOTE 6<br />
LONG-TERM DEBT<br />
Changes in long-term debt for the year ended June 30, <strong>2017</strong> were as follows:<br />
Balance Balance<br />
July 1, 2016 Additions Deletions June 30, <strong>2017</strong><br />
Replenishment Assessment<br />
Revenue Bonds (2015) $ 148,345,000 $ - $ (1,655,000) $ 146,690,000<br />
Clean Water State Revolving<br />
Fund Loan - 9,778,138 - 9,778,138<br />
148,345,000 9,778,138 (1,655,000) 156,468,138<br />
Bond premium 23,224,874 - (789,514) 22,435,360<br />
$ 171,569,874 $ 9,778,138 $ (2,444,514) $ 178,903,498<br />
Changes in long-term debt for the year ended June 30, 2016 were as follows:<br />
Balance<br />
Balance<br />
July 1, 2015 Additions Deletions June 30, 2016<br />
Certificates of participation (2004) $ 12,595,000 $ - $ (12,595,000) $ -<br />
Certificates of participation (2008) 16,560,000 - (16,560,000) -<br />
Certificates of participation (2011) 68,135,000 - (68,135,000) -<br />
Replenishment Assessment<br />
Revenue Bonds (2015) - 148,345,000 - 148,345,000<br />
97,290,000 148,345,000 (97,290,000) 148,345,000<br />
Bond discount (390,435) - 390,435 -<br />
Bond premium 1,401,287 23,224,874 (1,401,287) 23,224,874<br />
$ 98,300,852 $ 171,569,874 $ (98,300,852) $ 171,569,874<br />
Certificates of Participation<br />
On November 9, 2004, the District executed and issued certificates of participation in<br />
the amount of $15,410,000 to provide funds for the acquisition, construction and<br />
installation of certain clean water and replenishment projects and the purchase of a<br />
building which serves as the District’s headquarters. In addition, a portion of the<br />
funds were used to pay certain costs incurred in connection with the execution and<br />
delivery of the certificates and to fund a reserve fund for the outstanding certificates.<br />
Interest is payable semiannually on August 1st and February 1st of each year while<br />
principal payments are made on August 1st each year, commencing August 1, 2007,<br />
with interest rates ranging from 2.5% to 5%. The revenue certificates of participation<br />
are collateralized by a pledge of District revenues.<br />
On December 1, 2008, the District issued certificates of participation amounting to<br />
$18,365,000, payable in annual installments from August 1, 2009 through August 1,<br />
2038. Interest rates range from 3.75% to 5.25%, payable beginning February 1,<br />
2009. The agreement is between the District and the Southern California Water<br />
Replenishment Financing Corporation, with US Bank serving as trustee. The<br />
proceeds to be used to finance the acquisition, construction and installation of certain<br />
clean water and replenishment projects and the purchase of a building which serves<br />
as the District’s headquarters. The revenue certificates of participation are<br />
collateralized by a pledge of District revenues.<br />
Following are the five capital improvement projects financed from the certificates of<br />
participation proceeds:<br />
26
Water Replenishment District of Southern California<br />
Notes to Financial Statements<br />
Years ended June 30, <strong>2017</strong> and 2016<br />
NOTE 6<br />
LONG-TERM DEBT (CONTINUED)<br />
<br />
<br />
<br />
<br />
<br />
Upgrades and improvements to the Water Treatment Facility<br />
Construction of safe drinking water wellhead treatment units<br />
Construction of San Gabriel River rubber dams<br />
Construction of trunk line capacity for the Desalter and Water Treatment<br />
Facility<br />
Acquisition and construction of the District's headquarters<br />
On August 19, 2011, the District issued 2011 Water Revenue certificates of<br />
participation amounting to $69,195,000, payable in installments starting from August<br />
1, 2014 through August 1, 2038. Interest rates range from 3% to 5.25% payable<br />
semiannually, beginning February 1, 2012. The proceeds from the sale of the<br />
certificates are to be used to (1) finance the acquisition, construction and installation<br />
of certain clean water and replenishment projects for the District, (2) fund the reserve<br />
fund for the certificates, (3) fund capitalized interest through August 1, 2012, and (4)<br />
pay costs of issuance of the certificates. The projects to be financed by the proceeds<br />
are: (1) the LJVWTF Expansion Project, (2) the GRIP Facility, (3) the Regional<br />
Groundwater Monitoring Program, (4) the Safe Drinking Water Program, and (5) the<br />
Groundwater Infrastructure Improvements.<br />
On December 10, 2015, the principal outstanding on the 2004, 2008 and 2011<br />
certificates of participation were refinanced through the issuance of the District’s<br />
Replenishment Assessment Revenue Bonds, Series 2015.<br />
Replenishment Assessment Revenue Bonds<br />
On December 10, 2015, the District issued $148,345,000 of Replenishment<br />
Assessment Revenue Bonds, Series 2015. The bonds were rated AA+ from both<br />
Standard & Poor’s and Fitch Ratings. The proceeds were used to refinance the<br />
District’s outstanding 2004, 2008 and 2011 certificates of participation and provide<br />
$69,500,000 which will fund the District’s 5-year capital improvement plan, including<br />
projects such as the Groundwater Reliability Improvement Project, the expansion of<br />
the Goldsworthy Desalter, the Groundwater Basin Management Program and the<br />
Safe Drinking Water Program. The bonds call for level debt service payments and<br />
mature in annual installments through the year ended June 30, 2046.<br />
Clean Water State Revolving Fund Loan<br />
In October 2016, the Board of Directors of the District approved an agreement with<br />
California’s State Water Resources Control Board (SWRCB) that will provide $95<br />
million in funding for the construction of the Groundwater Reliability Improvement<br />
Project (GRIP), an advanced water treatment facility currently under construction in<br />
the City of Pico Rivera. Of the $95 million in funding, SWRCB has agreed to provide<br />
$15 million as grant funds while the remaining $80 million will be a loan that is<br />
payable in annual installments starting on December 31, 2019 and matures on<br />
December 31, 2048. The $80 million loan has an interest rate of 1%. During the<br />
year ended June 30, <strong>2017</strong>, the District received $9,778,138 from SWRCB.<br />
27
Water Replenishment District of Southern California<br />
Notes to Financial Statements<br />
Years ended June 30, <strong>2017</strong> and 2016<br />
NOTE 6<br />
LONG-TERM DEBT (CONTINUED)<br />
Future minimum principal and interest payments on all long-term debt noted above<br />
are as follows:<br />
Fiscal Year Principal Interest Total<br />
2018 $ 2,350,000 $ 6,897,700 $ 9,247,700<br />
2019 2,445,000 6,801,800 9,246,800<br />
2020 4,584,039 6,688,900 11,272,939<br />
2021 5,029,265 6,557,650 11,586,915<br />
2022 5,185,264 6,419,650 11,604,914<br />
2023-2027 19,529,570 29,767,750 49,297,320<br />
2028-2032 21,145,000 25,089,375 46,234,375<br />
2033-2037 27,150,000 19,082,500 46,232,500<br />
2038-2042 34,865,000 11,369,125 46,234,125<br />
2043-2046 34,185,000 2,803,100 36,988,100<br />
Total $ 156,468,138 $ 121,477,550 $ 277,945,688<br />
Less current portion 2,350,000<br />
Total non-current $ 154,118,138<br />
Accrued interest payable amounted to approximately $2.9 million and $5.5 million as<br />
of June 30, <strong>2017</strong> and 2016, respectively.<br />
NOTE 7<br />
UNEARNED REVENUE<br />
Cities may prepay their water replenishment assessment per the terms of a<br />
groundwater banking agreement between the District and the respective city. There<br />
was no unearned revenue as of June 30, <strong>2017</strong> and 2016.<br />
NOTE 8<br />
ADVANCES FROM CALTRANS<br />
In April 2004, the District and the California Department of Transportation (Caltrans)<br />
entered into an agreement relating to groundwater in the vicinity of the I-105 freeway.<br />
The agreement calls for $8.0 million to be paid by Caltrans to the District to be used<br />
to pay the costs of the proposed pipeline project described in the agreement, and to<br />
pay the replenishment assessment levied against the Caltrans groundwater<br />
extractions from beneath the I-105 freeway section. Caltrans advanced the $8.0<br />
million to the District to fund the proposed pipeline project. As of June 30, <strong>2017</strong> and<br />
2016, the District has spent $2,801,150 and $2,756,134 on the project, leaving an<br />
unexpended balance on the advance of $5,198,850 and $5,243,866, respectively.<br />
28
Water Replenishment District of Southern California<br />
Notes to Financial Statements<br />
Years ended June 30, <strong>2017</strong> and 2016<br />
NOTE 9<br />
DEFERRED INFLOWS OF RESOURCES<br />
In accordance with GASB Statement No. 62, Codification of Accounting and<br />
Financial Reporting Guidance Contained in Pre-November 30, 1989 FASB and<br />
AICPA Pronouncements, for rate–regulated activities the District defers the<br />
recognition of revenues until the related costs or charges associated with the rates<br />
assessed are incurred. The balance of Deferred Revenue – Replenishment<br />
Assessments of $4.2 million and $16.0 million as of June 30, <strong>2017</strong> and 2016,<br />
respectively, pertains to assessments that were deferred until the related costs of<br />
water supply management are incurred. Pursuant to GASB Statement No. 65, Items<br />
Previously Reported as Assets and Liabilities, these amounts are reported as<br />
deferred inflows of resources in the Statement of Net Position.<br />
NOTE 10<br />
NET POSITION - NET INVESTMENT IN CAPITAL ASSETS<br />
The calculation of net position - balance of net investment in capital assets at June<br />
30 is as follows:<br />
<strong>2017</strong> 2016<br />
Capital assets, net $ 195,214,183 $ 141,795,238<br />
Long-term debt:<br />
Current portion (2,350,000) (1,655,000)<br />
Noncurrent portion (176,553,498) (169,914,874)<br />
Unspent debt proceeds 33,015,303 75,168,581<br />
Net position - net investment in capital assets $ 49,325,988 $ 45,393,945<br />
NOTE 11<br />
DEFERRED COMPENSATION SAVINGS PLAN<br />
For the benefit of its employees, the District participates in IRS Code Section 457<br />
and 401(a) Deferred Compensation Programs (Programs). The purpose of these<br />
Programs is to provide deferred compensation for District employees that elect to<br />
participate in the Programs. Generally, eligible employees may defer receipt of a<br />
portion of their salary until termination, retirement, death or unforeseeable<br />
emergency. Until the funds are paid or otherwise made available to the employee,<br />
the employee is not obligated to report the deferred salary for income tax purposes.<br />
29
Water Replenishment District of Southern California<br />
Notes to Financial Statements<br />
Years ended June 30, <strong>2017</strong> and 2016<br />
NOTE 11<br />
DEFERRED COMPENSATION SAVINGS PLAN (CONTINUED)<br />
Federal law requires deferred compensation assets to be held in trust for the<br />
exclusive benefit of the participants. The District is in compliance with this legislation.<br />
These assets are not the legal property of the District, and are not subject to claims<br />
of the District's general creditors. Unaudited market value of all plan assets held in<br />
trust at June 30, <strong>2017</strong> and 2016 was $4,013,560 and $3,238,805, respectively.<br />
In accordance with GASB Statement No. 32, Accounting and Financial Reporting for<br />
Internal Revenue Code Section 457 Deferred Compensation Plans, the assets and<br />
related liabilities are not shown on the statements of net position. The District has<br />
little administrative involvement and does not perform the investing function for this<br />
plan.<br />
NOTE 12<br />
DEFINED BENEFIT PENSION PLAN<br />
Plan Description<br />
The District’s defined benefit pension plan (the Plan) provides retirement and<br />
disability benefits, annual cost-of-living adjustments, and death benefits to Plan<br />
members and beneficiaries. The Plan is part of the Miscellaneous Risk Pool Public<br />
Agency portion of the California Public Employees’ Retirement System (CalPERS), a<br />
cost-sharing multiple-employer defined benefit pension plan administered by<br />
CalPERS, which acts as a common investment and administrative agent for<br />
participating public employers within the State of California (State).<br />
A menu of benefit provisions, as well as other requirements, is established by State<br />
statutes within the Public Employees’ Retirement Law. The Plan selects optional<br />
benefit provisions from the benefit menu by contract with CalPERS and adopts those<br />
benefits through the District resolution. CalPERS issues a separate comprehensive<br />
annual financial report. Copies of the CalPERS annual financial report may be<br />
obtained from the CalPERS Executive Office – 400 Q Street, Sacramento, California<br />
95811.<br />
Funding Policy<br />
The contribution requirements of the Plan members are established by State statute<br />
and the employer contribution rate is established and may be amended by CalPERS.<br />
Under the Public Employees’ Pension Reform Act (PEPRA) of 2013, the District pays<br />
the member contribution to CalPERS (8% of annual covered salary) for classic<br />
members (defined as eligible participants hired prior to January 1, 2013). New<br />
members hired on or after January 1, 2013 are also required to contribute at least<br />
50% of their normal pension cost rate.<br />
30
Water Replenishment District of Southern California<br />
Notes to Financial Statements<br />
Years ended June 30, <strong>2017</strong> and 2016<br />
NOTE 12<br />
DEFINED BENEFIT PENSION PLAN<br />
The District is required to contribute the actuarially determined remaining amounts<br />
necessary to fund the benefits for its members. The actuarial methods and<br />
assumptions used are those adopted by the CalPERS Board of Administration. The<br />
required employer contribution rate for the fiscal years ended June 30, <strong>2017</strong> and<br />
2016 was 13.50% and 13.00%, for classic members, respectively. Required<br />
employer contribution rate for new members is 7% for the fiscal years ended June<br />
30, <strong>2017</strong> and 2016.<br />
Pension Liability, Pension Expense and Deferred Outflows/Inflows of<br />
Resources Related to Pension<br />
As of June 30, the District reported net pension liability for its proportionate share<br />
of the net pension liability of the Plan as follows:<br />
<strong>2017</strong> 2016<br />
Proportionate share of net pension liability $ 4,188,699 $ 3,190,280<br />
Total net pension liability $ 4,188,699 $ 3,190,280<br />
The District’s net pension liability for the Plan is measured as the proportionate<br />
share of the net pension liability. The net pension liability of the Plan is measured as<br />
of June 30, 2016, and the total pension liability for the Plan used to calculate the net<br />
pension liability was determined by an actuarial valuation as of June 30, 2015 rolled<br />
forward to June 30, 2016 using standard update procedures. The District’s<br />
proportion of the net pension liability was based on a projection of the District’s longterm<br />
share of contributions to the pension plan relative to the projected contributions<br />
of all participating employers, actuarially determined.<br />
Effective for measurement period 2015, CalPERS provides the GASB Statement No.<br />
68 Accounting Valuation Report for the miscellaneous risk pool and allocation<br />
methodology to be used by participants in the risk pool. The schedules of employer<br />
allocation include three ratios. It includes allocation for the Total Pension Liability,<br />
Plan Fiduciary Net Position and all other pension amounts (e.g. deferred<br />
outflows/inflows of resources and pension expense). The Total Pension Liability is<br />
allocated based on the Actuarial Accrued Liability from the most recent Actuarial<br />
Valuation Report as of June 30, 2015 used for funding purposes. The Plan Fiduciary<br />
Net Position is allocated based on the sum of the Plan’s Market Value of Assets from<br />
the most recent Actuarial Valuation as of June 30, 2015 used for funding purposes<br />
plus supplemental payments made by employers during the current measurement<br />
period to reduce their unfunded actuarial accrued liabilities. All other pension<br />
amounts (deferred outflows/inflows of resources and pension expense) are allocated<br />
based on the legally or statutorily required employer contributions for the fiscal year<br />
ended June 30, 2016, including reported contribution adjustments and suspended<br />
payroll information.<br />
31
Water Replenishment District of Southern California<br />
Notes to Financial Statements<br />
Years ended June 30, <strong>2017</strong> and 2016<br />
NOTE 12<br />
DEFINED BENEFIT PENSION PLAN (CONTINUED)<br />
The District’s proportionate share for pension items as provided by CalPERS are as<br />
follows:<br />
<strong>2017</strong><br />
Total pension liability 0.0013196<br />
Plan fiduciary net position 0.0013558<br />
All other pension amounts (deferred outflows/inflows of<br />
resources and and pension expense) 0.0016411<br />
For the years ended June 30, <strong>2017</strong> and 2016, the District recognized pension<br />
expense of $260,296 and $330,804, respectively. At June 30, <strong>2017</strong> and 2016, t he<br />
District reported deferred outflows of resources and deferred inflows of resources<br />
related to pension from the following sources:<br />
<strong>2017</strong> 2016<br />
Deferred Deferred Deferred Deferred<br />
Outflows of Inflows of Outflows of Inflows of<br />
Resources Resources Resources Resources<br />
Pension contributions subsequent to<br />
measurement date $ 830,116 $ - $ 801,773 $ -<br />
Differences between actual and<br />
expected experience 65,602 (4,557) 36,899 -<br />
Changes in assumption - (224,426) - (349,107)<br />
Changes in employer's proportion 105,414 (31,481) 397,640 (175,100)<br />
Differences between the employer's<br />
contribution and the employer's proportionate<br />
share of contributions 182,621 (48,760) 94,232 (119,347)<br />
Net differences between projected and actual<br />
earnings on plan investments 1,205,687 - 894,829 (1,069,841)<br />
Total $ 2,389,440 $ (309,224) $ 2,225,373 $ (1,713,395)<br />
$830,116 reported as deferred outflows of resources as of June 30, <strong>2017</strong> related to<br />
contributions subsequent to the measurement date will be recognized as a reduction<br />
of the net pension liability in the year ended June 30, 2018.<br />
32
Water Replenishment District of Southern California<br />
Notes to Financial Statements<br />
Years ended June 30, <strong>2017</strong> and 2016<br />
NOTE 12<br />
DEFINED BENEFIT PENSION PLAN (CONTINUED)<br />
Other amounts reported as deferred outflows of resources and deferred inflows of<br />
resources related to pension will be recognized as pension expense as follows:<br />
Year ending June 30<br />
Amount<br />
2018 $ 237,078<br />
2019 243,970<br />
2020 515,381<br />
2021 253,671<br />
2022 -<br />
Thereafter -<br />
Actuarial Assumptions<br />
The total pension liability in the June 30, 2015 actuarial valuation was determined<br />
using the following actuarial assumptions:<br />
Valuation Date June 30, 2015<br />
Measurement Date June 30, 2016<br />
Actuarial Cost Method<br />
Entry Age Normal<br />
Actuarial Assumptions<br />
Discount Rate 7.65%<br />
Inflation 2.75%<br />
Payroll Growth 3.00%<br />
Projected Salary Increase (1)<br />
Investment Rate of Return 7.5% (2)<br />
Mortality (3)<br />
Post-Retirement Benefit Increase (4)<br />
(1) Varies by Entry Age and Service<br />
(2) Net of pension plan investment and administrative expenses, including inflation<br />
(3) Derived using CALPERS' Membership data for all funds<br />
(4) Contract COLA up to 2.75% until Purchasing Power Protection<br />
Allowance Floor on Purchasing Power applies, 2.75% thereafter<br />
The underlying mortality assumptions and all other actuarial assumptions used in<br />
the June 30, 2015 valuation were based on the results of an actuarial experience<br />
study for the period 1997 to 2011. Further details of the Experience Study can<br />
be found on the CalPERS website.<br />
33
Water Replenishment District of Southern California<br />
Notes to Financial Statements<br />
Years ended June 30, <strong>2017</strong> and 2016<br />
NOTE 12<br />
DEFINED BENEFIT PENSION PLAN (CONTINUED)<br />
Discount Rate<br />
The discount rate used to measure the total pension liability was 7.65 percent, gross<br />
of administrative expense. To determine whether the municipal bond rate should be<br />
used in the calculation of a discount rate for each plan, CalPERS stress tested<br />
plans that would most likely result in a discount rate that would be different from<br />
the actuarially assumed discount rate. Based on the testing, none of the tested<br />
plans run out of assets. Therefore, the current 7.65 percent discount rate is<br />
appropriate and the use of the municipal bond rate calculation is not deemed<br />
necessary. The long-term expected discount rate of 7.65 percent will be applied to<br />
all plans in the Public Employees Retirement Fund (PERF). The stress test results<br />
are presented in a detailed report that can be obtained from the CalPERS website.<br />
The long-term expected rate of return on pension plan investments was determined<br />
using a building-block method in which best-estimate ranges of expected future real<br />
rates of return (expected returns, net of pension plan investment expense and<br />
inflation) are developed for each major asset class.<br />
In determining the long-term expected rate of return, CalPERS took into account<br />
both short-term and long-term market return expectations as well as the expected<br />
pension fund cash flows. Using historical returns of all the funds’ asset classes,<br />
expected compound returns were calculated over the short-term (first 10 years) and<br />
the long-term (11-60 years) using a building-block approach. Using the expected<br />
nominal returns for both short-term and long-term, the present value of benefits was<br />
calculated for each fund. The expected rate of return was set by calculating the<br />
single equivalent expected return that arrived at the same present value of benefits<br />
for cash flows as the one calculated using both short-term and long-term returns.<br />
The expected rate of return was then set equivalent to the single equivalent rate<br />
calculated above and rounded down to the nearest one quarter of one percent.<br />
The table below reflects the long-term expected real rate of return by asset class.<br />
The rate of return was calculated using the capital market assumptions applied to<br />
determine the discount rate and asset allocation. These rates of return are net of<br />
administrative expenses.<br />
34
Water Replenishment District of Southern California<br />
Notes to Financial Statements<br />
Years ended June 30, <strong>2017</strong> and 2016<br />
NOTE 12<br />
DEFINED BENEFIT PENSION PLAN (CONTINUED)<br />
Current<br />
Target Real Return Real Return<br />
Asset Class Allocation Years 1 - 10 (a) Years 11+ (b)<br />
Global Equity 51.00% 5.25% 5.71%<br />
Global Fixed Income 19.00% 0.99% 2.43%<br />
Inflation Sensitive 6.00% 0.45% 3.36%<br />
Private Equity 10.00% 6.83% 6.95%<br />
Real Estate 10.00% 4.50% 5.13%<br />
Infrastructure and Forestland 2.00% 4.50% 5.09%<br />
Liquidity 2.00% -0.55% -1.05%<br />
100.00%<br />
(a) An expected inflation of 2.5% used for this period.<br />
(b) An expected inflation of 3.0% used for this period.<br />
Sensitivity of the Proportionate Share of the Net Pension Liability to Changes<br />
in the Discount Rate<br />
The following presents the District’s proportionate share of the net pension liability<br />
for the Plan, calculated using the discount rate for the Plan, as well as what the<br />
District’s proportionate share of the net pension liability would be if it were calculated<br />
using a discount rate that is 1-percentage point lower or 1-percentage point higher<br />
than the current rate:<br />
1% Decrease 6.65%<br />
Net Pension Liability $ 6,746,522<br />
Current Discount Rate 7.65%<br />
Net Pension Liability $ 4,188,699<br />
1% Increase 8.65%<br />
Net Pension Liability $ 2,074,785<br />
Pension Plan Fiduciary Net Position<br />
Detailed information about the pension plan’s fiduciary net position is available in the<br />
separately issued CalPERS financial reports.<br />
Payable to the Pension Plan<br />
As of June 30, <strong>2017</strong> and 2016, the District did not have outstanding amounts of<br />
contributions due to the pension plan required for the years ended June 30, <strong>2017</strong><br />
and 2016.<br />
35
Water Replenishment District of Southern California<br />
Notes to Financial Statements<br />
Years ended June 30, <strong>2017</strong> and 2016<br />
NOTE 13<br />
PUBLIC AGENCY RETIREMENT SYSTEM (PARS) PLAN<br />
Plan Description<br />
The District provides retirement benefits to its elected directors who do not<br />
participate in CalPERS through a single-employer defined benefit plan administered<br />
as part of the Public Agency Retirement System (PARS). Directors who retire at age<br />
50 with 5 years of service with the District are eligible to receive pension benefits<br />
under the plan. The plan provides a benefit equal to the “3% at 60” plan factor of final<br />
average compensation for all years of service. The plan provides a benefit equal to<br />
“2% at 62” for Board members of the District hired after December 31, 2012 and are<br />
not participating in the CALPERS plan.<br />
Funding Policy<br />
The District is required to contribute the actuarially determined amounts necessary to<br />
fund the benefits for the participants. Contribution amounts are determined by an<br />
actuarial study performed every two years.<br />
Pension Liability, Pension Expense and Deferred Outflows/Inflows of<br />
Resources Related to Pension<br />
As of June 30, <strong>2017</strong> and 2016, the District reported net pension liability (asset) of<br />
the plan as follows:<br />
Increase (Decrease)<br />
Total Pension Plan Fiduciary Net Pension<br />
Liability Net Position Liability (Asset)<br />
Changes in Net Pension Liability (Asset) (a) (b) (a) - (b)<br />
Balances as of June 30, 2016 $ 278,099 $ 381,440 $ (103,341)<br />
Changes for the year:<br />
Service cost 13,512 - 13,512<br />
Interest on total pension liability 15,988 - 15,988<br />
Effect of plan changes - - -<br />
Effect of economic/demographic gains or losses 59,815 - 59,815<br />
Effect of assumptions changes or inputs - - -<br />
Benefit payments (1,850) (1,850) -<br />
Employer contributions - 13,308 (13,308)<br />
Member contributions - 6,406 (6,406)<br />
Net investment income - 14,356 (14,356)<br />
Administrative expenses - (1,979) 1,979<br />
Balances as of June 30, <strong>2017</strong> $ 365,564 $ 411,681 $ (46,117)<br />
The net pension liability (asset) of the Plan is measured as of June 30, <strong>2017</strong>, and the<br />
total pension liability (asset) for the Plan used to calculate the net pension liability<br />
(asset) was determined by an actuarial valuation as of June 30, 2016 rolled forward<br />
to June 30, <strong>2017</strong> using standard update procedures.<br />
For the years ended June 30, <strong>2017</strong> and 2016, the District recognized pension<br />
expense of $25,414 and $17,143, respectively. At June 30, <strong>2017</strong> and 2016, the<br />
District reported deferred outflows of resources and deferred inflows of resources<br />
related to pension from the following sources:<br />
36
Water Replenishment District of Southern California<br />
Notes to Financial Statements<br />
Years ended June 30, <strong>2017</strong> and 2016<br />
NOTE 13<br />
PUBLIC AGENCY RETIREMENT SYSTEM (PARS) PLAN (CONTINUED)<br />
<strong>2017</strong> 2016<br />
Deferred Deferred<br />
Outflows of Outflows of<br />
Resources Resources<br />
Differences between actual and<br />
expected experience $ 44,478 $ -<br />
Net difference between projected and actual<br />
earnings on investments 17,712 17,072<br />
Total $ 62,190 $ 17,072<br />
Other amounts reported as deferred outflows of resources and deferred inflows of<br />
resources related to pension will be recognized as pension expense as follows:<br />
Year ending June 30<br />
Amount<br />
2018 $ 21,751<br />
2019 21,750<br />
2020 17,279<br />
2021 1,410<br />
2022 -<br />
Thereafter* -<br />
*Note that additional future deferred inflows and outflows of resources may impact<br />
these amounts.<br />
Actuarial Assumptions<br />
The total pension liability (asset) in the June 30, 2016 actuarial valuation was<br />
determined using the following actuarial assumptions:<br />
Valuation Date June 30, 2016<br />
Measurement Date June 30, <strong>2017</strong><br />
Actuarial Cost Method<br />
Entry Age Normal<br />
Actuarial Assumptions<br />
Discount Rate 5.50%<br />
Inflation 3.00%<br />
Payroll Growth 3.00%<br />
Projected Salary Increase 3.00%<br />
Investment Rate of Return 5.50%<br />
Cost of Living Adjustments 2.00%<br />
Mortality (1)<br />
Post-Retirement Benefit Increase 3.00%<br />
(1) Consistent with the rates used to value the CalPERS plan<br />
37
Water Replenishment District of Southern California<br />
Notes to Financial Statements<br />
Years ended June 30, <strong>2017</strong> and 2016<br />
NOTE 13<br />
PUBLIC AGENCY RETIREMENT SYSTEM (PARS) PLAN (CONTINUED)<br />
The underlying mortality assumptions and all other actuarial assumptions used in<br />
the June 30, 2016 valuation were based on the results of an actuarial experience<br />
study for the period 1997 to 2011 with an assumed base year of 2008 and full<br />
generational improvements using Scale AA.<br />
The table below reflects the long-term expected real rate of return by asset class.<br />
The rate of return was calculated using the capital market assumptions applied to<br />
determine the discount rate and asset allocation. These rates of return are net of<br />
administrative expenses.<br />
Asset Class<br />
Target Real Return Real Return<br />
Allocation Years 1 - 10 (a) Years 11+ (b)<br />
Cash 7.04% 0.36% 0.35%<br />
Core Fixed Income 78.12% 2.17% 2.04%<br />
Equity Market 10.69% 4.83% 3.57%<br />
Foreign Developed Equity 2.64% 5.76% 4.15%<br />
Emerging Markets Equity 0.77% 8.06% 4.84%<br />
Real Estate 0.74% 5.04% 3.27%<br />
100.00%<br />
(a) An expected inflation of 2.49% used for this period.<br />
(b) An expected inflation of 2.37% used for this period.<br />
Sensitivity of the Proportionate Share of the Net Pension Liability (Asset) to<br />
Changes in the Discount Rate<br />
The following presents the District’s proportionate share of the net pension liability for<br />
the Plan, calculated using the discount rate for the Plan, as well as what the District’s<br />
proportionate share of the net pension liability would be if it were calculated using a<br />
discount rate that is 1-percentage point lower or 1-percentage point higher than the<br />
current rate.<br />
1% Decrease 4.50%<br />
Net Pension Liability (Asset) $ (1,315)<br />
Current Discount Rate 5.50%<br />
Net Pension Liability (Asset) $ (46,117)<br />
1% Increase 6.50%<br />
Net Pension Liability (Asset) $ (82,286)<br />
38
Water Replenishment District of Southern California<br />
Notes to Financial Statements<br />
Years ended June 30, <strong>2017</strong> and 2016<br />
NOTE 13<br />
PUBLIC AGENCY RETIREMENT SYSTEM (PARS) PLAN (CONTINUED)<br />
Pension Plan Fiduciary Net Position<br />
Detailed information about the pension plan’s fiduciary net position is available in the<br />
separately issued PARS financial reports.<br />
Payable to the Pension Plan<br />
As of June 30, <strong>2017</strong> and 2016, the District did not have outstanding amount of<br />
contributions to the plan required for the years ended June 30, <strong>2017</strong> and 2016.<br />
NOTE 14<br />
OTHER POSTEMPLOYMENT BENEFITS (OPEB)<br />
In addition to pension benefits described in Notes 12 and 13, the District provides<br />
single-employer postemployment healthcare benefits to qualified employees who<br />
meet the District's Public Employees Retirement System (PERS) current plan<br />
requirements. The following requirements outline the criteria that must be met by<br />
District employees in order to be eligible for these benefits:<br />
a. Employees hired prior to December 20, 2001 qualify for postemployment<br />
healthcare benefits if they retire with 12 or more years of service at the District.<br />
b. Employees hired on or after December 20, 2001 qualify for postemployment<br />
benefits if they retire at age 55 or older with 12 or more years of service.<br />
The District's contribution is currently based on a projected pay-as-you-go funding<br />
method, that is, benefits are payable when due. For the years ended June 30, <strong>2017</strong><br />
and 2016, the District had 13 eligible employees in each year.<br />
Eligible participants in the plan at July 1, 2015, the date of the latest actuarial<br />
valuation are as follows:<br />
Retirees and surviving spouses 13<br />
Active/full-time employees 35<br />
Total 48<br />
The actuarial method used in estimating the liability is the entry age normal actuarial<br />
cost method. Under the entry age normal actuarial cost method, the actuarial present<br />
value of projected benefits is allocated on a level basis over the earnings or service<br />
of individuals between entry age and the assumed exit age(s). The portion of the<br />
Actuarial Present Value (APV) of the postemployment benefits attributed to past<br />
service is called the Actuarial Accrued Liability (AAL). The significant assumptions in<br />
the computation include a discount rate of 6.73% (formerly 7.06%) , healthcare cost<br />
trend rate of 8.25% for January 1, 2016 decreasing by 0.25% through 2028 and 5.0%<br />
thereafter, an inflation rate of 8.25% for participants under 65 and 5.75% for those<br />
over 65 years of age, and an annual increase in payroll of 3.25%.<br />
39
Water Replenishment District of Southern California<br />
Notes to Financial Statements<br />
Years ended June 30, <strong>2017</strong> and 2016<br />
NOTE 14<br />
OTHER POSTEMPLOYMENT BENEFITS (CONTINUED)<br />
The following table shows the components of the District’s annual Other<br />
Postemployment Benefits (OPEB) cost for the year (based on 30-year amortization<br />
using the level percentage of projected payroll), the amount of contribution and<br />
benefits and/or insurance premiums actually paid and the District's Net OPEB<br />
obligation (prepayment) as of June 30:<br />
<strong>2017</strong> 2016<br />
Annual required contribution $ 627,990 $ 606,782<br />
Interest on net OPEB obligation (20,208) (20,208)<br />
Adjustment to ARC 20,182 19,587<br />
Annual OPEB cost 627,964 606,161<br />
Contribution (including benefit payments) (808,000) -<br />
Increase (decrease) in net OPEB obligation (180,036) 606,161<br />
Net OPEB obligation (prepayment) - beginning of year 305,895 (300,266)<br />
Net OPEB obligation (prepayment) - end of year $ 125,859 $ 305,895<br />
The Annual Required Contribution (ARC) is an amount actuarially determined in<br />
accordance with GASB Statement 45. The ARC represents a level of funding that, if<br />
paid on an ongoing basis, is projected to cover normal costs each year and amortize<br />
any unfunded actuarial liabilities (or funding excess) over a period not to exceed a<br />
closed 30-year period. The amortization method used in the valuation is the level<br />
percentage of projected payroll method.<br />
The District's annual OPEB cost, the percentage of annual OPEB cost contributed to<br />
the plan, and the net OPEB obligation for fiscal year 2016, 2015 and 2014 was:<br />
Percentage of<br />
Annual OPEB<br />
Cost Contributed<br />
Net OPEB<br />
Obligation<br />
(Prepayment)<br />
Fiscal Year<br />
End<br />
Annual<br />
OPEB Cost Contribution<br />
6/30/2015 $ 612,271 $ 608,583 99% $ (300,266)<br />
6/30/2016 606,161 - 0% 305,895<br />
6/30/<strong>2017</strong> 627,964 808,000 129% 125,859<br />
Based on the latest Actuarial Study of the District’s Postemployment Healthcare<br />
Program, as of July 1, 2015, the Unfunded Actuarial Accrued Liability (UAAL) ratio to<br />
covered payroll was 109%. During the year ended June 30, 2014 the District opened<br />
an irrevocable trust. The District contributed $808,000 and $0 to the plan for the<br />
years ended June 30, <strong>2017</strong> and 2016, respectively.<br />
Refer to Required Supplementary Information on page 47 for the plan’s Schedule of<br />
Funding Progress.<br />
40
Water Replenishment District of Southern California<br />
Notes to Financial Statements<br />
Years ended June 30, <strong>2017</strong> and 2016<br />
NOTE 15<br />
RISK MANAGEMENT<br />
The District is exposed to various risks of loss related to torts, theft of, damage to<br />
and destruction of assets; errors and omissions; injuries to employees; and natural<br />
disasters. The District is a member of the Association of California Water<br />
Agencies/Joint Powers Insurance Authority (ACWA/JPIA), an intergovernmental risk<br />
sharing joint powers authority created to provide self-insurance programs for<br />
California water agencies. The purpose of the ACWA/JPIA is to arrange and<br />
administer programs of self-insured losses and to purchase excess insurance<br />
coverage. At June 30, <strong>2017</strong>, the District participated in the liability and property<br />
programs of the ACWA/JPIA as follows:<br />
<br />
General and auto liability, public officials and employees' errors and<br />
omissions: Total risk financing self-insurance limits of $5,000,000, combined<br />
single limit at $5,000,000 per occurrence. The District purchased additional<br />
excess coverage layers: $55 million for general, auto and public officials<br />
liability, which increases the limits on the insurance coverage noted above.<br />
In addition to the above, the District also has the following insurance coverage:<br />
<br />
<br />
<br />
<br />
<br />
Employee dishonesty coverage up to $100,000 per loss includes public<br />
employee dishonesty, forgery or alteration and theft, disappearance and<br />
destruction coverages. The District purchased additional coverage of<br />
$1,000,000, which increases the limit on the insurance coverage noted<br />
above.<br />
Property loss is paid based on the replacement cost for the property on file. If<br />
the property is replaced within two years after the loss or otherwise paid on<br />
an actual cash value basis, to a combined total of $150 million per<br />
occurrence it is subject to a $2,500 deductible per occurrence. The District<br />
has a total insurable value of $71,007,363.<br />
Boiler and machinery coverage for the replacement cost up to $150 million<br />
per occurrence, subject to various deductibles depending on the type of<br />
equipment.<br />
Public officials’ personal liability coverage up to $100,000 for each<br />
occurrence, with an annual aggregate of $100,000 per each<br />
elected/appointed official to which this coverage applies is subject to the<br />
terms, with a deductible of $1,000 per claim.<br />
Workers' compensation insurance provides coverage up to California<br />
statutory limits for all work related injuries/illnesses covered by California law.<br />
Settled claims have not exceeded any of the coverage amounts in any of the last<br />
three fiscal years and there were no reductions in the District's insurance coverage<br />
during the years ended June 30, <strong>2017</strong> and 2016. Liabilities are recorded when it is<br />
probable that a loss has been incurred and the amount of the loss can be reasonably<br />
estimated net of the respective insurance coverage. Liabilities include an amount for<br />
claims that have been incurred but not reported (IBNR).<br />
41
Water Replenishment District of Southern California<br />
Notes to Financial Statements<br />
Years ended June 30, <strong>2017</strong> and 2016<br />
NOTE 16<br />
COMMITMENTS<br />
Recycled Water Agreement<br />
In January 2004, the District entered into a twenty-year agreement with the West<br />
Basin Municipal Water District (WBMWD) to purchase certain amounts of recycled<br />
water from WBMWD on an annual basis. Until completion of WBMWD's recycling<br />
facility expansion project, the District will purchase 7,500 AF of recycled water on an<br />
annual basis, or a lesser amount that is authorized by WBMWD's Regional Board<br />
Permit, at $430 per AF. After the expanded facility is completed and operable, the<br />
District will purchase 12,500 AF on an annual basis at $470 per AF of recycled water.<br />
The agreement also provides for annual increases in price.<br />
Basin Improvement Project Funding Agreement<br />
On May 1, 2015, the District approved a settlement agreement with the cities of<br />
Bellflower, Cerritos, Downey and Signal Hill. This settlement was due to litigation<br />
related to claims that the District failed to comply with the requirements under<br />
Proposition 218 when imposing its annual replenishment assessments. As part of the<br />
agreement, the District shall fund $5,000,000 in basin improvement projects of these<br />
cities within seven years from the effective date of the agreement.<br />
Construction Contracts<br />
The District has a variety of agreements with private parties relating to the<br />
installation, improvement or modification of water facilities and distribution systems<br />
and other District activities. The financing of such contracts is provided primarily from<br />
the proceeds of bonds issued by the District. The District has committed to<br />
approximately $87.3 million of open construction contracts as of June 30, <strong>2017</strong>.<br />
The contracts outstanding include:<br />
Total Approved Construction Balance to<br />
Project Name Contract Costs to-date Complete<br />
LJVWTF expansion $ 37,998,533 $ 37,863,877 $ 134,656<br />
Goldsworthy Desalter 18,769,848 17,410,799 1,359,049<br />
Caltrans Pipeline 745,698 745,698 -<br />
Regional Groundwater Monitoring Program 9,727,708 9,727,708 -<br />
Groundwater Infrastructure 1,696,399 1,438,846 257,553<br />
Safe Drinking Water Program 830,000 779,491 50,509<br />
Dominguez Gap Recycled Water Project 477,944 477,944 -<br />
Interconnection Pipeline 3,800,000 3,800,000 -<br />
Alamitos Physical Barrier Project 385,517 385,517 -<br />
<strong>WRD</strong> Building 1,563,054 1,354,109 208,945<br />
Groundwater Replenishment Improvement Project 136,517,728 53,632,826 82,884,902<br />
Environmental Monitoring 1,122,670 1,122,670 -<br />
Whittier Narrow Conservation Pool 1,475,000 815,000 660,000<br />
SCADA System Master 2,081,098 1,284,888 796,210<br />
Asset Management 1,206,695 402,799 803,896<br />
Paramount Equip/Fleet Center 178,000 - 178,000<br />
Administrative 140,909 140,909 -<br />
$ 218,716,801 $ 131,383,081 $ 87,333,720<br />
42
Water Replenishment District of Southern California<br />
Notes to Financial Statements<br />
Years ended June 30, <strong>2017</strong> and 2016<br />
NOTE 16<br />
COMMITMENTS (CONTINUED)<br />
Operating Leases<br />
The District has entered into an operating lease for land which does not contain a<br />
purchase option. Rental expense was $139,260 and $511,423 for the years ended<br />
June 30, <strong>2017</strong> and 2016, respectively.<br />
Future minimum annual fixed rentals required during the fiscal years 2018 through<br />
2022 under this lease are:<br />
Year ending June 30<br />
Amount<br />
2018 $ 98,965<br />
2019 54,613<br />
2020 32,396<br />
2021 6,938<br />
2022 6,938<br />
$ 199,850<br />
NOTE 17<br />
PROPOSITION (PROP) 218 CASE<br />
The District is currently defending a case in Los Angeles Superior Court based on<br />
claims that it failed to comply with the requirements under Prop 218 when imposing<br />
its annual replenishment assessments (RAs). This case seeks refund of the RAs<br />
paid. The District denies that Prop 218 is applicable to its adoption of an annual RA<br />
and intends to vigorously defend against this case. A brief description of the status of<br />
the case is as follows:<br />
<br />
Tesoro Refining v. Water Replenishment District of Southern California, Case<br />
No. BA134239, and Tesoro Refining and Marketing Company v. Water<br />
Replenishment District of Southern California, Case No. BS139830. Tesoro<br />
challenges the RAs imposed from 2006-2007 to 20-11-2012 based on Prop 218<br />
and non-Prop 218 theories. At the Writ stage, the court ruled for the plaintiff<br />
indicating that the District was required to comply with Prop 218, but withheld the<br />
issuance of the Writ and judgment thereon until the remaining claims are<br />
adjudicated by the trial court.<br />
Pursuant to a joint request of the parties, the February 2, 2015 trial date was<br />
vacated. A trial date is scheduled for June 4, 2018, but the Parties are currently<br />
engaged in efforts to resolve the litigation through a negotiated settlement.<br />
NOTE 18<br />
CONTINGENCIES<br />
Litigation<br />
The District is a defendant in other various lawsuits. Although the outcome of these<br />
lawsuits is not presently determinable, in the opinion of the District, the resolution of<br />
these matters will not have a material adverse effect on the District’s financial<br />
condition.<br />
43
Water Replenishment District of Southern California<br />
Notes to Financial Statements<br />
Years ended June 30, <strong>2017</strong> and 2016<br />
NOTE 18<br />
CONTINGENCIES (CONTINUED)<br />
Grant Awards<br />
Grant funds received by the District are subject to audit by the grantor agencies.<br />
Such audits could lead to requests for reimbursements by the grantor agencies for<br />
expenditures disallowed under the terms of the grant. District management believes<br />
that such disallowances, if any, would not be significant.<br />
NOTE 19<br />
SUBSEQUENT EVENTS<br />
The District has evaluated events or transactions through December 20, <strong>2017</strong>, the<br />
date on which the financial statements were available to be issued, for potential<br />
recognition or disclosure in the financial statements and determined no other<br />
subsequent matters require disclosure or adjustment to the accompanying financial<br />
statements.<br />
NOTE 20<br />
GOVERNMENTAL ACCOUNTING STANDARDS BOARD (GASB) STATEMENTS<br />
ISSUED, NOT YET EFFECTIVE<br />
The Governmental Accounting Standards Board (GASB) has issued several<br />
pronouncements prior to June 30, <strong>2017</strong>, that have effective dates that may impact<br />
future financial presentations. Management has not yet determined any impact the<br />
implementation of the following statements may have on the financial statements of<br />
the District.<br />
GASB Statement No. 75 - Accounting and Financial Reporting for<br />
Postemployment Benefits Other Than Pensions. The requirements of this<br />
Statement will improve the decision-usefulness of information in employer and<br />
governmental nonemployer contributing entity financial reports and will enhance its<br />
value for assessing accountability and interperiod equity by requiring recognition of<br />
the entire OPEB liability and a more comprehensive measure of OPEB expense.<br />
Decision-usefulness and accountability also will be enhanced through new note<br />
disclosures and required supplementary information, as follows:<br />
<br />
<br />
<br />
<br />
More robust disclosures of assumptions will allow for better informed<br />
assessments of the reasonableness of OPEB measurements.<br />
Explanations of how and why the OPEB liability changed from year to year<br />
will improve transparency.<br />
The summary OPEB liability information, including ratios, will offer an<br />
indication of the extent to which the total OPEB liability is covered by<br />
resources held by the OPEB plan, if any.<br />
For employers that provide benefits through OPEB plans that are<br />
administered through trusts that meet the specified criteria, the contribution<br />
schedules will provide measures to evaluate decisions related to<br />
contributions.<br />
44
Water Replenishment District of Southern California<br />
Notes to Financial Statements<br />
Years ended June 30, <strong>2017</strong> and 2016<br />
NOTE 20<br />
GOVERNMENTAL ACCOUNTING STANDARDS BOARD (GASB) STATEMENTS<br />
ISSUED, NOT YET EFFECTIVE (CONTINUED)<br />
The consistency, comparability, and transparency of the information reported by<br />
employers and governmental nonemployer contributing entities OPEB transactions<br />
will be improved by requiring:<br />
• The use of a discount rate that considers the availability of the OPEB<br />
plan’s fiduciary net position associated with the OPEB of current active<br />
and inactive employees and the investment horizon of those resources,<br />
rather than utilizing only the long-term expected rate of return regardless<br />
of whether the OPEB plan’s fiduciary net position is projected to be<br />
sufficient to make projected benefit payments and is expected to be<br />
invested using a strategy to achieve that return.<br />
• A single method of attributing the actuarial present value of projected<br />
benefit payments to periods of employee service, rather than allowing a<br />
choice among six methods with additional variations.<br />
• Immediate recognition in OPEB expense, rather than a choice of<br />
recognition periods, of the effects of changes of benefit terms.<br />
• Recognition of OPEB expense that incorporates deferred outflows of<br />
resources and deferred inflows of resources related to OPEB over<br />
defined, closed period, rather than a choice between an open or closed<br />
period.<br />
The provision of this Statement are effective for financial statements for periods<br />
beginning after June 15, <strong>2017</strong>.<br />
GASB Statement No. 81 – Irrevocable Split-Interest Agreements. This<br />
Statement enhances the comparability of financial statements by providing<br />
accounting and financial reporting guidance for irrevocable split-interest agreements<br />
in which a government is a beneficiary. This Statement also enhances the decisionusefulness<br />
of general purpose external financial reports, and their value for<br />
assessing accountability, by more clearly identifying the resources that are available<br />
for the government to carry out its mission. The provisions of this Statement are<br />
effective for financial statements for period beginning after December 15, 2016.<br />
GASB Statement No. 83 – Certain Asset Retirement Obligations. This Statement<br />
will enhance comparability of financial statements among governments by<br />
establishing uniform criteria for governments to recognize and measure certain asset<br />
retirement obligations (AROs), including obligations that may not have been<br />
previously reported. This Statement also will enhance the decision-usefulness of the<br />
information provided to financial statement users by requiring disclosures related to<br />
those AROs. The provisions of this Statement are effective for financial statements<br />
for periods beginning after June 15, 2018.<br />
45
Water Replenishment District of Southern California<br />
Notes to Financial Statements<br />
Years ended June 30, <strong>2017</strong> and 2016<br />
NOTE 20<br />
GOVERNMENTAL ACCOUNTING STANDARDS BOARD (GASB) STATEMENTS<br />
ISSUED, NOT YET EFFECTIVE (CONTINUED)<br />
GASB Statement No. 84 – Fiduciary Activities. The requirements of this<br />
Statement will enhance consistency and comparability by (1) establishing specific<br />
criteria for identifying activities that should be reported as fiduciary activities and (2)<br />
clarifying whether and how business-type activities should report their fiduciary<br />
activities. Greater consistency and comparability enhances the value provided by the<br />
information reported in financial statements for assessing government accountability<br />
and stewardship. The provisions of this Statement are effective for financial<br />
statements for periods beginning after December 15, 2018.<br />
GASB Statement No. 85 – Omnibus <strong>2017</strong>. The requirements of this Statement will<br />
enhance consistency in the application of accounting and financial reporting<br />
requirements. Consistent reporting will improve the usefulness of information for<br />
users of state and local government financial statements. The provisions of this<br />
Statement are effective for financial statements for periods beginning after June 15,<br />
<strong>2017</strong>.<br />
GASB Statement No. 86 – Certain Debt Extinguishment Issues. The<br />
requirements of this Statement will increase consistency in accounting and financial<br />
reporting for debt extinguishments by establishing uniform guidance for<br />
derecognizing debt that is defeased in substance, regardless of how cash and other<br />
monetary assets placed in an irrevocable trust for the purpose of extinguishing that<br />
debt were acquired. The requirements of this Statement also will enhance<br />
consistency in financial reporting of prepaid insurance related to debt that has been<br />
extinguished. In addition, this Statement will enhance the decision-usefulness of<br />
information in notes to financial statements regarding debt that has been defeased in<br />
substance. The provisions of this Statement are effective for financial statements for<br />
periods beginning after June 15, <strong>2017</strong>.<br />
GASB Statement No. 87 – Leases. This Statement will increase the usefulness of<br />
governments’ financial statements by requiring reporting of certain lease liabilities<br />
that currently are not reported. It will enhance comparability of financial statements<br />
among governments by requiring lessees and lessors to report leases under a single<br />
model. This Statement also will enhance the decision-usefulness of the information<br />
provided to financial statement users by requiring notes to financial statements<br />
related to the timing, significance, and purpose of a government’s leasing<br />
arrangements. The provisions of this Statement are effective for financial statements<br />
for periods beginning after December 15, 2019.<br />
46
Required Supplementary Information
Water Replenishment District of Southern California<br />
Schedule of Funding Progress - OPEB<br />
Year ended June 30, <strong>2017</strong><br />
Actuarial Actuarial Actuarial Accrued Liability UAAL as<br />
Valuation Value of Accrued Liability [(B) – (A)] Funded Ratio Covered Percentage of<br />
Date Assets (AAL) (UAAL) [(A) / (B)] Payroll Covered Payroll<br />
(A) (B) (C )<br />
7/1/2011 $ - $ 5,508,234 $ 5,508,234 0% $ 3,100,000 178%<br />
7/1/2013 3,582,005 7,136,080 3,554,075 50% 3,200,000 111%<br />
7/1/2015 4,927,094 8,516,179 3,589,085 58% 3,300,000 109%<br />
47
Water Replenishment District of Southern California<br />
Schedule of Proportionate Share of the Net Pension Liability - CalPERS<br />
Last 10 years*<br />
June 30, 2016 June 30, 2015 June 30, 2014<br />
Proportion of the net pension liability (asset) 0.12058% 0.11629% 0.04592%<br />
Proportionate Share of the net pension liability (asset) $ 4,188,699 $ 3,190,280 $ 2,857,450<br />
Covered - employee payroll (1) $ 3,851,724 $ 3,642,112 $ 3,679,116<br />
Proportionate Share of the net pension liability (asset)<br />
as a percentage of covered-employee payroll 108.75% 87.59% 77.67%<br />
Plan's Proportionate Share of the Fiduciary Net Position<br />
as a percentage of the Plan's Total Pension Liability 81.25% 81.98% 83.03%<br />
Plan's Proportionate Share of Aggregate Employer Contributions (2) $ 556,581 $ 185,357 $ 378,030<br />
Notes to Schedule<br />
1<br />
2<br />
Covered-Employee Payroll represented above is based on pensionable earnings provided by the<br />
employer. However, GASB Statement No. 68 defines covered-employee payroll as the total<br />
payroll of employees that are provided pensions through the pension plan. Accordingly, if<br />
pensionable earnings are different than total earnings for covered-employees, the employer<br />
should display in the disclosure footnotes the payroll based on total earnings for the covered<br />
group and recalculate the required payroll-related ratios.<br />
The Plan’s proportionate share of aggregate employer contributions may not match the actual<br />
contributions made by the employer during the measurement period. The Plan’s proportionate<br />
share of aggregate employer contributions is based on the Plan’s proportion of fiduciary net<br />
position shown on line 5 of the table above as well as any additional side fund (or unfunded<br />
liability) contributions made by the employer during the measurement period.<br />
* Fiscal year 2015 was the 1st year of implementation, therefore only three years are shown.<br />
48
Water Replenishment District of Southern California<br />
Schedule of Proportionate Share of the Net Pension Liability - PARS<br />
Last 10 years*<br />
June 30, 2016 June 30, 2015 June 30, 2014<br />
Proportionate Share of the net pension liability (asset) $ (46,116) $ (103,340) $ (104,534)<br />
Covered - employee payroll (1) $ 100,642 $ 88,771 $ 88,771<br />
Proportionate Share of the net pension liability (asset)<br />
as a percentage of covered-employee payroll (45.82%) (116.41%) (117.76%)<br />
Plan's Proportionate Share of the Fiduciary Net Position<br />
as a percentage of the Plan's Total Pension Liability 112.62% 137.16% 141.71%<br />
Plan's Proportionate Share of Aggregate Employer Contributions (2) $ 25,414 $ 17,143 $ 13,748<br />
Notes to Schedule<br />
1<br />
2<br />
Covered-Employee Payroll represented above is based on pensionable earnings provided by the<br />
employer. However, GASB Statement No. 68 defines covered-employee payroll as the total<br />
payroll of employees that are provided pensions through the pension plan. Accordingly, if<br />
pensionable earnings are different than total earnings for covered-employees, the employer<br />
should display in the disclosure footnotes the payroll based on total earnings for the covered<br />
group and recalculate the required payroll-related ratios.<br />
The Plan’s proportionate share of aggregate employer contributions may not match the actual<br />
contributions made by the employer during the measurement period. The Plan’s proportionate<br />
share of aggregate employer contributions is based on the Plan’s proportion of fiduciary net<br />
position shown on line 5 of the table above as well as any additional side fund (or unfunded<br />
liability) contributions made by the employer during the measurement period.<br />
* Fiscal year 2015 was the 1st year of implementation, therefore only three years are shown.<br />
49
Water Replenishment District of Southern California<br />
Schedule of Contributions – CalPERS<br />
Last 10 years*<br />
June 30, 2016 June 30, 2015 June 30, 2014<br />
Contractually required contribution<br />
(actuarially determined) $ 801,773 $ 904,036 $ 576,966<br />
Contributions in relation to the actuarially<br />
determined contributions (801,773) (904,036) (576,966)<br />
Contribution deficiency (excess) $ - $ - $ -<br />
Covered-employee payroll $ 3,851,724 $ 3,642,112 $ 3,679,116<br />
Contributions as a percentage of<br />
covered-employee payroll 20.82% 24.82% 15.68%<br />
Notes to Schedule<br />
Valuation date<br />
June 30, 2015<br />
Methods and assumptions used to determine contribution rates:<br />
Actuarial Cost Method<br />
Entry Age Normal Cost Method<br />
Amortization method<br />
Level percentage of payroll, closed<br />
Remaining amortization period<br />
15 years as of valuation date<br />
Asset valuation method<br />
5-year smoothed market<br />
Inflation 2.75%<br />
Salary increases<br />
Varies by entry age and service<br />
Investment rate of return<br />
7.50%, net of pension plan investment and<br />
administrative expenses: includes inflation<br />
Retirement age<br />
57 yrs.<br />
Mortality Rate Table<br />
Derived using CalPERS' membership<br />
data for all funds<br />
*Fiscal year 2015 was the 1 st year of implementation, therefore only three years are shown.<br />
50
Water Replenishment District of Southern California<br />
Schedule of Contributions – PARS<br />
Last 10 years*<br />
June 30, 2016<br />
June 30, 2015<br />
June 30, 2014<br />
Contractually required contribution<br />
(actuarially determined) $ 13,512 $ 14,757 $ 3,257<br />
Contributions in relation to the actuarially<br />
determined contributions (13,308) (21,266) (17,390)<br />
Contribution deficiency (excess) $ 204 $ (6,509) $ (14,133)<br />
Covered-employee payroll $ 100,642 $ 88,771 $ 88,771<br />
Contributions as a percentage of<br />
covered-employee payroll 13.22% 23.96% 19.59%<br />
Notes to Schedule<br />
Valuation date<br />
June 30, 2016<br />
Methods and assumptions used to determine contribution rates:<br />
Actuarial Cost Method<br />
Amortization method<br />
Remaining amortization period<br />
Asset valuation method<br />
Inflation<br />
Salary increases<br />
Investment rate of return<br />
Retirement age<br />
Mortality Rate Table<br />
Entry Age Normal<br />
Level dollar, closed<br />
8.5 years as of valuation<br />
None<br />
3.00%<br />
3.00%<br />
5.50%<br />
All TIER 1 participants assumed to retire upon<br />
attaining retirement eligibility and age 60.<br />
All TIER 2 participants: 67 years<br />
Consistent with the Non-Industrial rates used to<br />
value the CalPERS plans.<br />
*Fiscal year 2015 was the 1 st year of implementation, therefore only three years are shown.<br />
51
Statistical Section<br />
(Unaudited)
(This page intentionally left blank.)
Water Replenishment District of Southern California<br />
Statistical Section<br />
June 30, <strong>2017</strong><br />
This part of the District's comprehensive annual financial report presents detailed information as a<br />
context for understanding what the information in the financial statements, note disclosures, and<br />
required supplementary information says about the District's overall financial health.<br />
Table of Contents<br />
Page<br />
Financial Trends<br />
These schedules contain information to help the reader understand how<br />
the District's financial performance and financial condition have<br />
changed over time. 53<br />
Revenue Capacity<br />
These schedules contain information to help the reader assess the<br />
District's most significant own-source revenue, water sales. 57<br />
Debt Capacity<br />
These schedules present information to help the reader assess the<br />
affordability of the District's current levels of outstanding debt and the<br />
District's ability to issue additional debt. 61<br />
Demographic and Economic Statistics<br />
These schedules offer demographic indicators to help the reader<br />
understand the environment within which the District's financial activities<br />
take place. 63<br />
Operating and Capacity Indicators<br />
This schedule contains service and infrastructure data to help the<br />
reader understand how the information in the District's financial report<br />
relates to the service the District provides. 65<br />
52
Water Replenishment District of Southern California<br />
Financial Trends - Changes in Net Position by Component (Unaudited)<br />
Last Ten Fiscal Years<br />
2008 2009 2010 2011<br />
Changes in net assets:<br />
Operating revenues (see Schedule 2) $ 39,132,053 39,335,102 45,601,400 56,284,385<br />
Operating expenses (see Schedule 3) (24,576,237) (28,362,636) (46,705,411) (52,788,111)<br />
Overhead absorption - - - -<br />
Depreciation and amortization (2,304,366) (2,256,077) (2,324,791) (2,394,968)<br />
Operating income(loss) 12,251,450 8,716,389 (3,428,802) 1,101,306<br />
Non-operating revenues(expenses)<br />
Property taxes, net of collection expenses 456,702 493,625 446,160 481,874<br />
Investment income/(loss) 692,431 521,171 234,908 128,575<br />
Interest Expense - (1,013,099) (1,183,999) (1,170,199)<br />
Election costs (570,547) (511,638) (450,000) (1,008,030)<br />
Gain/(Loss) on sale/disposition of assets - - - -<br />
Other revenue/(expense), net 182,611 180,482 131,199 100,761<br />
Net non-operating revenues (expenses) 761,197 (329,459) (821,732) (1,467,019)<br />
Net income before capital contributions 13,012,647 8,386,930 (4,250,534) (365,713)<br />
Capital contributions 97,516 9,284 60,577 348,943<br />
Changes in net assets $ 13,110,163 8,396,214 (4,189,957) (16,770)<br />
Net assets by component:<br />
Invested in capital assets, net of related debt $ 41,757,258 37,305,026 34,945,659 35,110,097<br />
Restricted 1,447,030 - - -<br />
Unrestricted 20,378,297 34,673,773 32,843,183 18,952,155<br />
Total net assets $ 63,582,585 71,978,799 67,788,842 54,062,252<br />
$20,000,000<br />
$15,000,000<br />
Change in Net Assets<br />
$10,000,000<br />
$5,000,000<br />
$0<br />
($5,000,000)<br />
($10,000,000)<br />
($15,000,000)<br />
2008 2009 2010 2011 2012 2013 2014 2015 2016 <strong>2017</strong><br />
Fiscal Year<br />
Source: Water Replenishment District Accounting Department<br />
53
Water Replenishment District of Southern California<br />
Financial Trends - Changes in Net Position by Component (Unaudited)<br />
Last Ten Fiscal Years<br />
Fiscal Year<br />
2012 2013 2014 2015 2016 <strong>2017</strong><br />
48,121,854 46,003,068 60,386,705 80,154,123 59,852,856 74,573,333<br />
(44,170,360) (38,868,302) (44,086,875) (69,991,319) (51,786,834) (62,347,174)<br />
- - - -<br />
(2,446,962) (2,495,964) (2,537,023) (2,629,444) (4,003,734) (4,014,947)<br />
1,504,532 4,638,802 13,762,807 7,533,360 4,062,288 8,211,212<br />
476,937 606,562 544,319 581,180 585,957 613,015<br />
121,351 259,644 244,961 163,704 562,438 864,242<br />
(3,802,841) (3,935,225) (3,130,364) (2,144,351) (2,148,520) (2,875,746)<br />
- - - (1,397,597) - (1,374,823)<br />
- - - -<br />
144,530 170,406 45,682 4,102,881 4,192,116 3,270,421<br />
(3,060,023) (2,898,613) (2,295,401) 1,305,817 3,191,991 497,109<br />
(1,555,491) 1,740,189 11,467,406 8,839,177 7,254,279 8,708,321<br />
752,468 2,107,865 6,207,226 1,109,714 450,878 7,550,656<br />
(803,023) 3,848,054 17,674,632 9,948,891 7,705,157 16,258,977<br />
29,781,357 29,824,873 46,797,969 47,030,300 45,393,945 49,325,988<br />
- - - - - -<br />
21,979,302 25,783,840 26,485,376 32,987,244 42,328,756 54,655,690<br />
51,760,659 55,608,713 73,283,345 80,017,544 87,722,701 103,981,678<br />
$120,000,000<br />
$100,000,000<br />
$80,000,000<br />
Net Assets<br />
$60,000,000<br />
$40,000,000<br />
$20,000,000<br />
$0<br />
2008 2009 2010 2011 2012 2013 2014 2015 2016 <strong>2017</strong><br />
Fiscal Year<br />
54
Water Replenishment District of Southern California<br />
Financial Trends - Operating Revenues by Source (Unaudited)<br />
Last Ten Fiscal Years<br />
Fiscal Water Replenishment Desalter Water Treatment Other Operating Total Operating<br />
Year Assessment Assessments Subsidies Revenue Revenue<br />
2008 $ 36,482,271 $ 606,380 $ 476,491 $ 1,566,911 $ 39,132,053<br />
2009 36,877,706 316,986 598,110 1,542,300 39,335,102<br />
2010 43,452,025 554,734 726,375 868,266 45,601,400<br />
2011 54,470,197 621,099 695,293 497,796 56,284,385<br />
2012 45,571,109 913,204 894,411 743,130 48,121,854<br />
2013 43,710,697 868,531 591,292 832,548 46,003,068<br />
2014 58,665,579 840,559 377,650 502,917 60,386,704<br />
2015 79,085,428 517,963 182,649 368,083 80,154,123<br />
2016 58,128,626 619,806 412,706 691,718 59,852,856<br />
<strong>2017</strong> 73,822,097 - 355,914 395,322 74,573,333<br />
Revenue<br />
$85,000,000<br />
$82,500,000<br />
$80,000,000<br />
$77,500,000<br />
$75,000,000<br />
$72,500,000<br />
$70,000,000<br />
$67,500,000<br />
$65,000,000<br />
$62,500,000<br />
$60,000,000<br />
$57,500,000<br />
$55,000,000<br />
$52,500,000<br />
$50,000,000<br />
$47,500,000<br />
$45,000,000<br />
$42,500,000<br />
$40,000,000<br />
$37,500,000<br />
$35,000,000<br />
$32,500,000<br />
$30,000,000<br />
$27,500,000<br />
$25,000,000<br />
$22,500,000<br />
$20,000,000<br />
$17,500,000<br />
$15,000,000<br />
2008 2009 2010 2011 2012 2013 2014 2015 2016 <strong>2017</strong><br />
Fiscal Year<br />
Source: Water Replenishment District Accounting Department<br />
55
Water Replenishment District of Southern California<br />
Financial Trends - Operating Expenses by Activity (Unaudited)<br />
Last Ten Fiscal Years<br />
Fiscal Water Purchases Water Purchases In-lieu General and Total Operating<br />
Year Injecting Spreading Connection Fees Replenishment Administrative Expenses<br />
2008 $ 10,819,502 $ 720,160 $ 1,379,127 $ - $ 11,657,448 $ 24,576,237<br />
2009 13,623,824 601,706 536,011 - 13,601,095 28,362,636<br />
2010 17,406,851 15,808,953 796,787 - 12,692,820 46,705,411<br />
2011 18,552,696 15,405,518 911,745 1,937,484 15,980,668 52,788,111<br />
2012 13,466,495 8,285,830 1,146,511 1,314,384 19,957,140 44,170,360<br />
2013 18,599,786 2,021,060 1,187,540 888,692 16,171,224 38,868,302<br />
2014 24,496,761 1,780,435 1,285,550 2,028,005 14,496,122 44,086,874<br />
2015 23,385,697 14,325,715 2,586,820 6,241,887 23,451,200 69,991,319<br />
2016 17,798,133 16,290,901 2,824,490 - 14,873,310 51,786,834<br />
<strong>2017</strong> 21,344,615 22,333,722 4,010,063 - 14,658,774 62,347,174<br />
$80,000,000<br />
$70,000,000<br />
$60,000,000<br />
Expenses<br />
$50,000,000<br />
$40,000,000<br />
$30,000,000<br />
$20,000,000<br />
$10,000,000<br />
$0<br />
2008 2009 2010 2011 2012 2013 2014 2015 2016 <strong>2017</strong><br />
Fiscal Year<br />
Source: Water Replenishment District Accounting Department<br />
56
Water Replenishment District of Southern California<br />
Revenue Capacity - Revenue Base (Unaudited)<br />
Last Ten Fiscal Years<br />
Fiscal<br />
Year<br />
Water Pumped<br />
(Acre Feet)<br />
2008 249,873<br />
2009 243,251<br />
2010 241,198<br />
2011 224,158<br />
2012 231,815<br />
2013 239,691<br />
2014 242,545<br />
2015 219,068<br />
2016 214,489<br />
<strong>2017</strong> 210,530<br />
260,000<br />
250,000<br />
240,000<br />
Acre Feet<br />
230,000<br />
220,000<br />
210,000<br />
200,000<br />
190,000<br />
2008 2009 2010 2011 2012 2013 2014 2015 2016 <strong>2017</strong><br />
Fiscal Year<br />
Note: See Schedule 2 "Operating Revenue by Source" for information regarding water revenues.<br />
Source: Water Replenishment District Accounting Department<br />
57
Water Replenishment District of Southern California<br />
Revenue Capacity - Revenue Rates (Unaudited)<br />
Last Ten Fiscal Years<br />
Fiscal<br />
Year<br />
Rate<br />
per AF<br />
2008 149<br />
2009 153<br />
2010 182<br />
2011 205<br />
2012 244<br />
2013 244<br />
2014 268<br />
2015 268<br />
2016 283<br />
<strong>2017</strong> 297<br />
350<br />
300<br />
250<br />
Rate per AF<br />
200<br />
150<br />
100<br />
50<br />
-<br />
2008 2009 2010 2011 2012 2013 2014 2015 2016 <strong>2017</strong><br />
Fiscal Year<br />
Notes:<br />
Rates as of June 30 of each fiscal year.<br />
Source: Water Replenishment District Accounting Department<br />
58
Water Replenishment District of Southern California<br />
Revenue Capacity - Customers by Type (Unaudited)<br />
Last Ten Fiscal Years<br />
Fiscal<br />
Year<br />
Number of<br />
Pumpers<br />
2008 99<br />
2009 100<br />
2010 100<br />
2011 100<br />
2012 103<br />
2013 101<br />
2014 104<br />
2015 101<br />
2016 101<br />
<strong>2017</strong> 101<br />
120<br />
Number of Customers<br />
100<br />
80<br />
60<br />
40<br />
20<br />
0<br />
2008 2009 2010 2011 2012 2013 2014 2015 2016 <strong>2017</strong><br />
Fiscal Year<br />
Source: Water Replenishment District Accounting Department<br />
Note: Number of customers as of June 30 of fiscal year.<br />
Number of Customers<br />
In previous years, the reported number of customers varied based on different methods<br />
of counting individual pumpers and/or water rights holders.<br />
For example, in some years, California Water Service Company was counted only once,<br />
while in other years, they were counted multiple times for each of their divisions in<br />
the Central and West Coast Basins.<br />
In order to eliminate the variability in the number of customers and provide a more<br />
consistent count, we performed a review of our historical pumping table and<br />
identified all unique account numbers (aka Alpha Numbers) that had production<br />
greater than zero during each Fiscal Year.<br />
A revised summary of this count is provided above.<br />
59
Water Replenishment District of Southern California<br />
Revenue Capacity - Principal Customers (Unaudited)<br />
Current Fiscal Year and Ten Years Ago<br />
<strong>2017</strong> 2008<br />
Water Percentage Water Percentage<br />
Customer Pumped (AF) of Total Pumped (AF) of Total<br />
Long Beach, City of 31,749 15% 35,816 14%<br />
Golden State Water Company 24,516 12% 33,101 13%<br />
California Water Service Company 16,836 8% 15,301 6%<br />
Downey, City of 13,605 6% 17,660 7%<br />
Cerritos, City of 7,916 4% 11,415 5%<br />
South Gate, City of 7,441 4% 9,976 4%<br />
Compton, City of 7,034 3% 7,453 3%<br />
Lakewood, City of 6,967 3% 9,472 4%<br />
Tesoro Refining & Marketing Company 6,662 3% 5,184 2%<br />
Vernon, City of 6,485 3% 8,870 4%<br />
Total 129,211 61% 154,248 62%<br />
Total Water Consumed (Acre Feet) 210,530 100% 249,873 100%<br />
Source: Water Replenishment District Accounting Department<br />
60
Water Replenishment District of Southern California<br />
Debt Capacity - Ratio of Outstanding Debt (Unaudited)<br />
Last Ten Fiscal Years<br />
Total<br />
Fiscal Certificates of Per As a Share of<br />
Year Participation Debt Capita Personal Income<br />
2008 $ 15,100,000 $ 15,100,000 1.55 0.003617%<br />
2009 32,658,447 32,658,447 3.33 0.008319%<br />
2010 32,175,300 32,175,300 3.27 0.007981%<br />
2011 31,552,153 31,552,153 3.19 0.007496%<br />
2012 101,632,500 101,632,500 10.20 0.023458%<br />
2013 100,920,284 100,920,284 10.13 0.022784%<br />
2014 100,148,068 100,148,068 10.00 0.021954%<br />
2015 98,300,852 98,300,852 9.66 0.019656%<br />
2016 171,569,874 171,569,874 16.70 0.033312%<br />
<strong>2017</strong> 169,125,360 178,903,498 17.26 0.033798%<br />
$200,000,000<br />
$180,000,000<br />
$160,000,000<br />
$140,000,000<br />
$120,000,000<br />
Dollars<br />
$100,000,000<br />
$80,000,000<br />
$60,000,000<br />
$40,000,000<br />
$20,000,000<br />
$0<br />
2008 2009 2010 2011 2012 2013 2014 2015 2016 <strong>2017</strong><br />
Fiscal Year<br />
Source: Water Replenishment District Accounting Department<br />
61
Water Replenishment District of Southern California<br />
Debt Capacity - Debt Coverage (Unaudited)<br />
Last Ten Fiscal Years<br />
Fiscal Net Operating Net Available Debt Service<br />
Coverage<br />
Year Revenues (2) Expenses (1) Revenues Principal Interest Total Ratio<br />
2008 $ 39,990,766 $ (24,576,237) $ 15,414,529 $ 310,000 $ 647,827 $ 957,827 (16.64)<br />
2009 39,014,927 (28,362,636) 10,652,291 315,000 764,408 1,079,408 9.87<br />
2010 44,840,245 (46,705,411) (1,865,166) 500,000 1,642,081 2,142,081 (0.87)<br />
2011 55,166,309 (52,788,111) 2,378,198 640,000 1,616,331 2,256,331 1.05<br />
2012 45,814,299 (44,170,360) 1,643,939 695,000 3,648,519 4,343,519 0.38<br />
2013 45,212,320 (38,868,302) 6,344,018 675,000 4,815,932 5,490,932 1.16<br />
2014 64,298,529 (44,086,875) 20,211,654 735,000 4,788,544 5,523,544 3.66<br />
2015 82,569,654 (69,991,319) 12,578,335 1,810,000 4,743,381 6,553,381 1.92<br />
2016 63,495,725 (51,786,834) 11,708,891 1,655,000 4,118,895 5,773,895 2.03<br />
<strong>2017</strong> 82,621,098 (62,347,174) 20,273,924 2,350,000 6,897,700 9,247,700 2.19<br />
Notes:<br />
(1) Operating expenses exclude depreciation expense<br />
(2) Net revenues is made up of total operating revenues, net nonoperating revenue (expense) and total capital contributions from the statements of<br />
revenue, expenses, and changes in net position.<br />
Source: Water Replenishment District Accounting Department<br />
62
Water Replenishment District of Southern California<br />
Demographics and Economic Statistics – County of Los Angeles (Unaudited)<br />
Last Ten Fiscal Years<br />
Year<br />
Personal<br />
Income<br />
Personal<br />
Unemployment (thousands of Income<br />
Rate<br />
Population<br />
dollars) per Capita<br />
(1)<br />
(2)<br />
(2)<br />
(2)<br />
2008 7.2% 9,735,147 417,454,378 42,881<br />
2009 11.7% 9,797,400 392,579,855 40,111<br />
2010 12.4% 9,826,773 403,144,483 41,025<br />
2011 12.5% 9,889,056 420,913,463 42,564<br />
2012 11.1% 9,962,563 433,261,902 43,489<br />
2013 9.6% 9,962,789 442,935,636 44,459<br />
2014 8.2% 10,017,068 456,177,277 45,540<br />
2015 7.3% 10,181,140 500,117,959 49,122<br />
2016 4.9% 10,274,040 515,037,625 50,130<br />
<strong>2017</strong> 4.4% 10,365,720 529,335,857 51,066<br />
11,000,000<br />
10,750,000<br />
10,500,000<br />
Population<br />
10,250,000<br />
10,000,000<br />
9,750,000<br />
9,500,000<br />
9,250,000<br />
9,000,000<br />
2008 2009 2010 2011 2012 2013 2014 2015 2016 <strong>2017</strong><br />
Fiscal Year<br />
Personal Income per Capita<br />
$55,000<br />
$50,000<br />
$45,000<br />
$40,000<br />
$35,000<br />
$30,000<br />
$25,000<br />
2008 2009 2010 2011 2012 2013 2014 2015 2016 <strong>2017</strong><br />
Fiscal Year<br />
Notes:<br />
(1) Only County data is updated annually. Therefore, the District has chosen to use<br />
its data since the District believes that the County data is representative of the<br />
conditions and experience of the District.<br />
Sources: California Department of Finance and CaliforniaLaborMarketInfo, Los Angeles<br />
Business Journal, FRED Economic Data - St. Louis Fed<br />
(2) Per capita personal income was computed using Census Bureau midyear population<br />
estimates and Real Per Capita Income estimates from CalGov's Los Angeles County<br />
Economic Forecast.<br />
All state and local area dollar estimates are in current dollars (not adjusted for inflation).<br />
Sources: Regional Economic Information System, Bureau of Economic Analysis,<br />
U.S. Department of Commerce, CalGov.com/Los Angeles County Economic Forecast<br />
63
Water Replenishment District of Southern California<br />
Demographics and Economic Statistics – Largest Employers - County of Los Angeles<br />
(Unaudited)<br />
June 30, <strong>2017</strong><br />
Largest Public Companies (1)<br />
The Walt Disney Company<br />
Molina Healthcare, Inc<br />
AECOM Technology Corp.<br />
CBRE Group, Inc<br />
Farmers Insurance Exchange<br />
Edison International<br />
Reliance Steel & Aluminum Company<br />
Live Nation Entertainment, Inc.<br />
A-Mark Precious Metals, Inc.<br />
Activision Blizzard, Inc.<br />
(1) Ranked by 2016 sales volume<br />
Source: Los Angeles Almananc<br />
Largest Private Companies (2)<br />
Capital Group of Companies, Inc.<br />
Consolidated Electrical Distributors, Inc.<br />
Forever 21 Inc.<br />
Parsons Corporation<br />
The Wonderful Company<br />
Panda Restaurant Group<br />
Newegg, Inc.<br />
Guitar Center, Inc.<br />
(2) Ranked by 2016 sales volume<br />
Source: Los Angeles Almanac<br />
Largest Employers (3)<br />
County of Los Angeles<br />
Los Angeles Unified School District<br />
City of Los Angeles (Including DWP)<br />
University of California, Los Angeles<br />
Federal Government (non-Defense Dept.)<br />
Kaiser Permanente<br />
State of California (non-education)<br />
University of Southern California<br />
Northrop Grumman Corp.<br />
Target Corp.<br />
Kroger Co. (Ralphs, Food 4 Less)<br />
Bank of America<br />
Providence Health & Services<br />
Long Beach Unified School District<br />
Metropolitan Transportation Authority (Los Angeles County)<br />
(3) Ranked by 2016 number of employees in Los Angeles County<br />
Source: California Employment Development Department,<br />
the Los Angeles Business Journal, and Almanac research<br />
64
Water Replenishment District of Southern California<br />
Operating and Capacity Indicators (Unaudited)<br />
Last Ten Fiscal Years<br />
Employees<br />
Department 2008 2009 2010 2011 2012 2013 2014 2015 2016 <strong>2017</strong><br />
Administration 4 4 4 4 5 5 5 5 5 5<br />
Finance 4 4 5 5 5 5 5 4 4 5<br />
Engineering 8 9 9 8 9 9 9 11 12 13<br />
Hydrogeology 6 8 8 7 8 8 8 8 8 8<br />
External Affairs 4 6 7 7 7 7 5 6 5 6<br />
Total 26 31 33 31 34 34 32 34 34 37<br />
Employees<br />
40<br />
35<br />
30<br />
25<br />
20<br />
15<br />
10<br />
5<br />
0<br />
Fiscal Year<br />
Other Operating and Capacity Indicators<br />
Fiscal<br />
Year<br />
Number of<br />
Groundwater Pumps<br />
Acre Feet<br />
Injected<br />
2008<br />
2009<br />
2010<br />
2011<br />
2012<br />
2013<br />
2014<br />
2015<br />
2016<br />
<strong>2017</strong><br />
367 26,287<br />
370 25,996<br />
366 28,400<br />
372 27,408<br />
373 19,023<br />
361 23,277<br />
365 30,075<br />
353 28,881<br />
357 25,667<br />
360 25,906<br />
Sources: Water Replenishment District Engineering and Accounting Departments<br />
Note:<br />
Number of Wells<br />
In previous years, the count of the number of production wells was based on wells labeled as “Active” in our wells database table,<br />
regardless of whether they had production in the current Fiscal Year.<br />
In order to provide a more accurate summary of active wells, we performed a review of the historical pumping table and identified<br />
all wells that had production greater than zero during each Fiscal Year. A summary of this count is provided above.<br />
65
Report of Independent Auditors on<br />
Internal Controls and Compliance
(This page intentionally left blank.)
Report of Independent Auditors on Internal Control Over Financial Reporting<br />
and on Compliance and Other Matters Based on an Audit of Financial Statements<br />
Performed in Accordance with Government Auditing Standards<br />
The Honorable Members of the Board of Directors<br />
Water Replenishment District of Southern California<br />
We have audited, in accordance with the auditing standards generally accepted in the United States<br />
of America and the standards applicable to financial audits contained in Government Auditing<br />
Standards issued by the Comptroller General of the United States, the financial statements of the<br />
Water Replenishment District of Southern California (the District), as of and for the year ended June<br />
30, <strong>2017</strong>, and the related notes to the financial statements, which collectively comprise the District’s<br />
basic financial statements, and have issued our report thereon dated December 20, <strong>2017</strong>.<br />
Internal Control Over Financial Reporting<br />
In planning and performing our audit of the financial statements, we considered the District's internal<br />
control over financial reporting (internal control) to determine the audit procedures that are<br />
appropriate in the circumstances for the purpose of expressing our opinion on the financial<br />
statements, but not for the purpose of expressing an opinion on the effectiveness of the District’s<br />
internal control. Accordingly, we do not express an opinion on the effectiveness of the District’s<br />
internal control.<br />
A deficiency in internal control exists when the design or operation of a control does not allow<br />
management or employees, in the normal course of performing their assigned functions, to prevent,<br />
or detect and correct, misstatements on a timely basis. A material weakness is a deficiency, or a<br />
combination of deficiencies, in internal control, such that there is a reasonable possibility that a<br />
material misstatement of the entity’s financial statements will not be prevented, or detected and<br />
corrected on a timely basis. A significant deficiency is a deficiency, or a combination of deficiencies,<br />
in internal control that is less severe than a material weakness, yet important enough to merit<br />
attention by those charged with governance.<br />
Our consideration of internal control was for the limited purpose described in the first paragraph of<br />
this section and was not designed to identify all deficiencies in internal control that might be material<br />
weaknesses or significant deficiencies. Given these limitations, during our audit we did not identify<br />
any deficiencies in internal control that we consider to be material weaknesses. However, material<br />
weaknesses may exist that have not been identified.<br />
66
Compliance and Other Matters<br />
As part of obtaining reasonable assurance about whether the District's financial statements are free<br />
from material misstatement, we performed tests of its compliance with certain provisions of laws,<br />
regulations, contracts, and grant agreements, noncompliance with which could have a direct and<br />
material effect on the determination of financial statement amounts. However, providing an opinion<br />
on compliance with those provisions was not an objective of our audit, and accordingly, we do not<br />
express such an opinion. The results of our tests disclosed no instances of noncompliance or other<br />
matters that are required to be reported under Government Auditing Standards.<br />
Purpose of this Report<br />
The purpose of this report is solely to describe the scope of our testing of internal control and<br />
compliance and the results of that testing, and not to provide an opinion on the effectiveness of the<br />
entity’s internal control or on compliance. This report is an integral part of an audit performed in<br />
accordance with Government Auditing Standards in considering the entity’s internal control and<br />
compliance. Accordingly, this communication is not suitable for any other purpose.<br />
Los Angeles, California<br />
December 20, <strong>2017</strong><br />
67
www.vasquezcpa.com<br />
Vasquez & Company LLP has over 45 years of experience in performing audit, accounting & consulting services for all types of<br />
nonprofit organizations, for-profit companies, governmental entities and publicly traded companies. Vasquez is a member of the<br />
RSM US Alliance. RSM US Alliance provides its members with access to resources of RSM US LLP. RSM US Alliance member<br />
firms are separate and independent businesses and legal entities that are responsible for their own acts and omissions, and each<br />
are separate and independent from RSM US LLP. RSM US LLP is the U.S. member firm of RSM International, a global network of<br />
independent audit, tax, and consulting firms. Members of RSM US Alliance have access to RSM International resources through<br />
RSM US LLP but are not member firms of RSM International. Visit rsmus.com/about us for more information regarding RSM US LLP<br />
and RSM International. The RSM logo is used under license by RSM US LLP. RSM US Alliance products and services are<br />
proprietary to RSM US LLP.<br />
801 South Grand Avenue, Suite 400 • Los Angeles, California 90017-4646 • Ph. (213) 873-1700 • Fax (213) 873-1777