Water Quality Trading in the Lower Delaware River Basin: A ...
Water Quality Trading in the Lower Delaware River Basin: A ...
Water Quality Trading in the Lower Delaware River Basin: A ...

You also want an ePaper? Increase the reach of your titles
YUMPU automatically turns print PDFs into web optimized ePapers that Google loves.
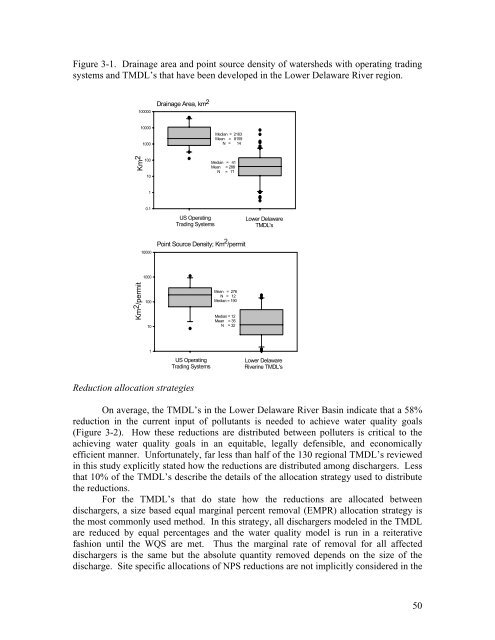
Figure 3-1. Dra<strong>in</strong>age area and po<strong>in</strong>t source density of watersheds with operat<strong>in</strong>g trad<strong>in</strong>g<br />
systems and TMDL’s that have been developed <strong>in</strong> <strong>the</strong> <strong>Lower</strong> <strong>Delaware</strong> <strong>River</strong> region.<br />
Km 2 /permit<br />
100000<br />
Km 2<br />
10000<br />
1000<br />
100<br />
10<br />
1<br />
0.1<br />
10000<br />
1000<br />
100<br />
10<br />
1<br />
Dra<strong>in</strong>age Area, km 2<br />
US Operat<strong>in</strong>g<br />
<strong>Trad<strong>in</strong>g</strong> Systems<br />
Po<strong>in</strong>t Source Density; Km 2 /permit<br />
US Operat<strong>in</strong>g<br />
<strong>Trad<strong>in</strong>g</strong> Systems<br />
Reduction allocation strategies<br />
Median = 2163<br />
Mean = 8159<br />
N = 14<br />
Median = 41<br />
Mean = 288<br />
N = 71<br />
Mean = 276<br />
N = 12<br />
Median = 190<br />
Median = 12<br />
Mean = 35<br />
N = 32<br />
<strong>Lower</strong> <strong>Delaware</strong><br />
TMDL's<br />
<strong>Lower</strong> <strong>Delaware</strong><br />
<strong>River</strong><strong>in</strong>e TMDL's<br />
On average, <strong>the</strong> TMDL’s <strong>in</strong> <strong>the</strong> <strong>Lower</strong> <strong>Delaware</strong> <strong>River</strong> Bas<strong>in</strong> <strong>in</strong>dicate that a 58%<br />
reduction <strong>in</strong> <strong>the</strong> current <strong>in</strong>put of pollutants is needed to achieve water quality goals<br />
(Figure 3-2). How <strong>the</strong>se reductions are distributed between polluters is critical to <strong>the</strong><br />
achiev<strong>in</strong>g water quality goals <strong>in</strong> an equitable, legally defensible, and economically<br />
efficient manner. Unfortunately, far less than half of <strong>the</strong> 130 regional TMDL’s reviewed<br />
<strong>in</strong> this study explicitly stated how <strong>the</strong> reductions are distributed among dischargers. Less<br />
that 10% of <strong>the</strong> TMDL’s describe <strong>the</strong> details of <strong>the</strong> allocation strategy used to distribute<br />
<strong>the</strong> reductions.<br />
For <strong>the</strong> TMDL’s that do state how <strong>the</strong> reductions are allocated between<br />
dischargers, a size based equal marg<strong>in</strong>al percent removal (EMPR) allocation strategy is<br />
<strong>the</strong> most commonly used method. In this strategy, all dischargers modeled <strong>in</strong> <strong>the</strong> TMDL<br />
are reduced by equal percentages and <strong>the</strong> water quality model is run <strong>in</strong> a reiterative<br />
fashion until <strong>the</strong> WQS are met. Thus <strong>the</strong> marg<strong>in</strong>al rate of removal for all affected<br />
dischargers is <strong>the</strong> same but <strong>the</strong> absolute quantity removed depends on <strong>the</strong> size of <strong>the</strong><br />
discharge. Site specific allocations of NPS reductions are not implicitly considered <strong>in</strong> <strong>the</strong><br />
50