Development of offenders - DCS-Home
Development of offenders - DCS-Home
Development of offenders - DCS-Home

You also want an ePaper? Increase the reach of your titles
YUMPU automatically turns print PDFs into web optimized ePapers that Google loves.
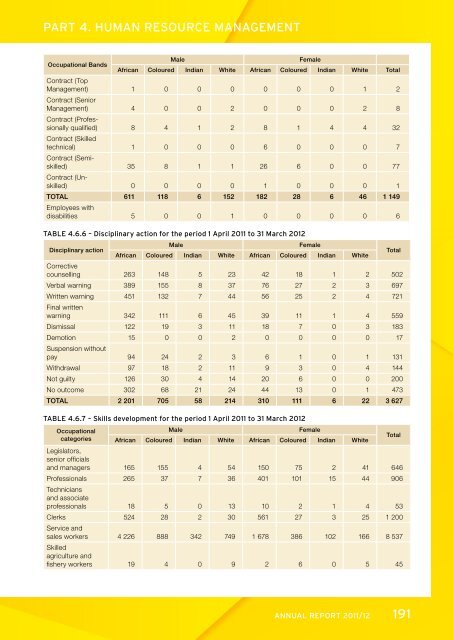
PART 4. HUMAN RESOURCE MANAGEMENT<br />
Occupational Bands<br />
Male Female<br />
African Coloured Indian White African Coloured Indian White Total<br />
Contract (Top<br />
Management)<br />
Contract (Senior<br />
1 0 0 0 0 0 0 1 2<br />
Management)<br />
Contract (Pr<strong>of</strong>es-<br />
4 0 0 2 0 0 0 2 8<br />
sionally qualified)<br />
Contract (Skilled<br />
8 4 1 2 8 1 4 4 32<br />
technical)<br />
Contract (Semi-<br />
1 0 0 0 6 0 0 0 7<br />
skilled)<br />
Contract (Un-<br />
35 8 1 1 26 6 0 0 77<br />
skilled) 0 0 0 0 1 0 0 0 1<br />
TOTAL<br />
Employees with<br />
611 118 6 152 182 28 6 46 1 149<br />
disabilities 5 0 0 1 0 0 0 0 6<br />
TABLE 4.6.6 – Disciplinary action for the period 1 April 2011 to 31 March 2012<br />
Disciplinary action<br />
Corrective<br />
African<br />
Male<br />
Coloured Indian White African<br />
Female<br />
Coloured Indian White<br />
Total<br />
counselling 263 148 5 23 42 18 1 2 502<br />
Verbal warning 389 155 8 37 76 27 2 3 697<br />
Written warning<br />
Final written<br />
451 132 7 44 56 25 2 4 721<br />
warning 342 111 6 45 39 11 1 4 559<br />
Dismissal 122 19 3 11 18 7 0 3 183<br />
Demotion<br />
Suspension without<br />
15 0 0 2 0 0 0 0 17<br />
pay 94 24 2 3 6 1 0 1 131<br />
Withdrawal 97 18 2 11 9 3 0 4 144<br />
Not guilty 126 30 4 14 20 6 0 0 200<br />
No outcome 302 68 21 24 44 13 0 1 473<br />
TOTAL 2 201 705 58 214 310 111 6 22 3 627<br />
TABLE 4.6.7 – Skills development for the period 1 April 2011 to 31 March 2012<br />
Occupational<br />
categories<br />
Legislators,<br />
senior <strong>of</strong>ficials<br />
African<br />
Male<br />
Coloured Indian White African<br />
Female<br />
Coloured Indian White<br />
Total<br />
and managers 165 155 4 54 150 75 2 41 646<br />
Pr<strong>of</strong>essionals<br />
Technicians<br />
and associate<br />
265 37 7 36 401 101 15 44 906<br />
pr<strong>of</strong>essionals 18 5 0 13 10 2 1 4 53<br />
Clerks<br />
Service and<br />
524 28 2 30 561 27 3 25 1 200<br />
sales workers<br />
Skilled<br />
agriculture and<br />
4 226 888 342 749 1 678 386 102 166 8 537<br />
fishery workers 19 4 0 9 2 6 0 5 45<br />
ANNUAL REPORT 2011/12 191