Portable Imaging Solutions Market Analysis
The diagnostic imaging technology sector is facing significant changes in its market dynamics as new methodologies, technologies, and practices are currently being introduced in the market. This sector is going through a period of amendments, driven by increasing combined demand for emerging technologies and its adoption in the healthcare sector. Several factors ranging from its demand and rising aging population to secure economic development in the emerging nations are driving the growth of the portable imaging solutions market.
The diagnostic imaging technology sector is facing significant changes in its market dynamics as new methodologies, technologies, and practices are currently being introduced in the market. This sector is going through a period of amendments, driven by increasing combined demand for emerging technologies and its adoption in the healthcare sector. Several factors ranging from its demand and rising aging population to secure economic development in the emerging nations are driving the growth of the portable imaging solutions market.
- TAGS
- portable-ct-scanners-market
- diagnostic-imaging-report
- diagnostic-imaging-industry
- diagnostic-imaging-market
- radiology-market-size
- radiology-industry
- radiology-market
- medical-imaging-market-size
- imaging-market-trends
- mobile-imaging-industry
- mobile-imaging-market
- mobile-x-ray-systems-report
- mobile-x-ray-systems-industry
- mobile-x-ray-systems-market
- ultrasound-systems-market
- ultrasound-imaging-report
- ultrasound-imaging-industry
- ultrasound-imaging-market
- medical-imaging-report
- medical-imaging-industry

You also want an ePaper? Increase the reach of your titles
YUMPU automatically turns print PDFs into web optimized ePapers that Google loves.
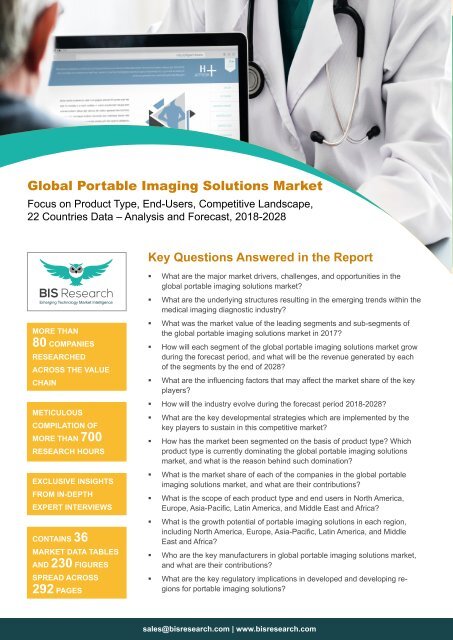
Global <strong>Portable</strong> <strong>Imaging</strong> <strong>Solutions</strong> <strong>Market</strong><br />
Focus on Product Type, End-Users, Competitive Landscape,<br />
22 Countries Data – <strong>Analysis</strong> and Forecast, 2018-2028<br />
Key Questions Answered in the Report<br />
MORE THAN<br />
80 COMPANIES<br />
RESEARCHED<br />
ACROSS THE VALUE<br />
CHAIN<br />
METICULOUS<br />
COMPILATION OF<br />
MORE THAN 700<br />
RESEARCH HOURS<br />
EXCLUSIVE INSIGHTS<br />
FROM IN-DEPTH<br />
EXPERT INTERVIEWS<br />
CONTAINS 36<br />
MARKET DATA TABLES<br />
AND 230 FIGURES<br />
SPREAD ACROSS<br />
292 PAGES<br />
• What are the major market drivers, challenges, and opportunities in the<br />
global portable imaging solutions market?<br />
• What are the underlying structures resulting in the emerging trends within the<br />
medical imaging diagnostic industry?<br />
• What was the market value of the leading segments and sub-segments of<br />
the global portable imaging solutions market in 2017?<br />
• How will each segment of the global portable imaging solutions market grow<br />
during the forecast period, and what will be the revenue generated by each<br />
of the segments by the end of 2028?<br />
• What are the influencing factors that may affect the market share of the key<br />
players?<br />
• How will the industry evolve during the forecast period 2018-2028?<br />
• What are the key developmental strategies which are implemented by the<br />
key players to sustain in this competitive market?<br />
• How has the market been segmented on the basis of product type? Which<br />
product type is currently dominating the global portable imaging solutions<br />
market, and what is the reason behind such domination?<br />
• What is the market share of each of the companies in the global portable<br />
imaging solutions market, and what are their contributions?<br />
• What is the scope of each product type and end users in North America,<br />
Europe, Asia-Pacific, Latin America, and Middle East and Africa?<br />
• What is the growth potential of portable imaging solutions in each region,<br />
including North America, Europe, Asia-Pacific, Latin America, and Middle<br />
East and Africa?<br />
• Who are the key manufacturers in global portable imaging solutions market,<br />
and what are their contributions?<br />
• What are the key regulatory implications in developed and developing regions<br />
for portable imaging solutions?<br />
sales@bisresearch.com | www.bisresearch.com
Table of Contents<br />
MARKET OVERVIEW<br />
MARKET DYNAMICS<br />
COMPETITIVE LANDSCAPE<br />
INDUSTRY INSIGHTS<br />
GLOBAL PORTABLE IMAGING<br />
SOLUTIONS MARKET<br />
(BY PRODUCT TYPE)<br />
GLOBAL PORTABLE IMAGING<br />
SOLUTIONS MARKET<br />
(BY END-USER)<br />
GLOBAL PORTABLE IMAGING<br />
SOLUTIONS MARKET (BY REGION)<br />
• Medical <strong>Imaging</strong> Modalities in a<br />
Historical Perspective<br />
• Digitalization in Radiology: A New<br />
Revolution<br />
• Classification of <strong>Portable</strong> <strong>Imaging</strong><br />
<strong>Solutions</strong><br />
• Potential Benefits and Risks of<br />
Diagnostic <strong>Imaging</strong> Systems<br />
• Global <strong>Portable</strong> <strong>Imaging</strong> <strong>Solutions</strong><br />
<strong>Market</strong> Scenario<br />
• Impact <strong>Analysis</strong><br />
• <strong>Market</strong> Drivers<br />
• <strong>Market</strong> Restraints<br />
• <strong>Market</strong> Opportunities<br />
• <strong>Market</strong> Trends<br />
• Key Strategies and Developments<br />
• <strong>Market</strong> Share <strong>Analysis</strong><br />
• Growth Share <strong>Analysis</strong><br />
• Industry Attractiveness (Porter’s Five<br />
Force <strong>Analysis</strong>)<br />
• Regulatory Scenario<br />
• Reimbursement Scenario<br />
• Global <strong>Portable</strong> <strong>Imaging</strong> <strong>Solutions</strong><br />
<strong>Market</strong> (by Product Type) (<strong>Market</strong><br />
Attractiveness <strong>Analysis</strong>)<br />
• Ultrasound Systems<br />
• Mobile X-Ray Systems<br />
• <strong>Portable</strong> CT Scanners<br />
• Global <strong>Portable</strong> <strong>Imaging</strong> <strong>Solutions</strong><br />
<strong>Market</strong> (by End-User) (<strong>Market</strong><br />
Attractiveness <strong>Analysis</strong>)<br />
• Hospitals and Ambulatory Surgical<br />
Centers<br />
• Diagnostic Centers<br />
• Other End-Users<br />
• North America<br />
• Europe<br />
• Asia-Pacific<br />
• Latin America<br />
• Middle East & Africa<br />
SCOPE & RESEARCH<br />
METHODOLOGY<br />
• Report Scope<br />
• Global <strong>Portable</strong> <strong>Imaging</strong><br />
<strong>Solutions</strong> <strong>Market</strong>:<br />
Research Methodology<br />
• Data and Prediction<br />
Modelling<br />
COMPANY PROFILES<br />
• Analogic Corporation<br />
• Canon Inc.<br />
• Fujifilm Holdings<br />
Corporation<br />
• General Electric<br />
Company<br />
• Hitachi, Ltd.<br />
• Konica Minolta, Inc.<br />
• Koninklijke Philips N.V.<br />
• Samsung Electronics<br />
Co., Ltd.<br />
• Shimadzu Corporation<br />
• Siemens Healthineers,<br />
Inc.<br />
• Butterfly Network, Inc.<br />
• Carestream Health, Inc.<br />
• Clarius Mobile Health<br />
Corp.<br />
• EchoNous, Inc.<br />
• Esaote SpA<br />
• Healcerion, Inc.<br />
• Mindray Medical<br />
International Limited<br />
• Teratech Corporation<br />
• Whale <strong>Imaging</strong>, Inc.<br />
• Xoran Technologies, LLC<br />
VIEW COMPLETE TABLE OF CONTENT<br />
sales@bisresearch.com | www.bisresearch.com
List of Tables<br />
1. Impact of <strong>Market</strong> Drivers, 2018-2028<br />
2. Impact of <strong>Market</strong> Restraint, 2018-2028<br />
3. <strong>Imaging</strong> Procedures and Their Approximate<br />
Effective Radiation Doses<br />
4. Impact <strong>Analysis</strong>: <strong>Market</strong> Drivers<br />
5. Impact <strong>Analysis</strong>: <strong>Market</strong> Restraints<br />
6. Number and Distribution of Persons Aged 60 Years<br />
or Over by Region (2017 and 2050)<br />
7. Ionizing Radiation Modalities<br />
8. Medical Device Classification and Pre-<strong>Market</strong>ing<br />
Procedures in Japan<br />
9. Japan Reimbursement System: Reimbursement<br />
Codes<br />
10. Multi-Departmental Use of <strong>Portable</strong> CT Scanners<br />
(Samsung Electronics Co., Ltd.)<br />
11. Total Number of Outpatient Diagnostic <strong>Imaging</strong><br />
Centers (U.S.)<br />
12. Macro-Economic Factors Driving the <strong>Market</strong> Growth<br />
of <strong>Portable</strong> <strong>Imaging</strong> <strong>Solutions</strong> in North America<br />
(2016-2022)<br />
13. Macro-Economic Factors Driving the <strong>Market</strong> Growth<br />
of <strong>Portable</strong> <strong>Imaging</strong> <strong>Solutions</strong> in the U.S.<br />
(2016-2022)<br />
14. Macro-Economic Factors Driving the <strong>Market</strong> Growth<br />
of <strong>Portable</strong> <strong>Imaging</strong> <strong>Solutions</strong> in Canada<br />
(2016-2022)<br />
15. Macro-Economic Factors Driving the <strong>Market</strong> Growth<br />
of <strong>Portable</strong> <strong>Imaging</strong> <strong>Solutions</strong> in Europe<br />
(2016-2022)<br />
16. Macro-Economic Factors Driving the <strong>Market</strong> Growth<br />
of <strong>Portable</strong> <strong>Imaging</strong> <strong>Solutions</strong> in Germany<br />
(2016-2022)<br />
17. Macro-Economic Factors Driving the <strong>Market</strong> Growth<br />
of <strong>Portable</strong> <strong>Imaging</strong> <strong>Solutions</strong> in the U.K.<br />
(2016-2022)<br />
18. Macro-Economic Factors Driving the <strong>Market</strong> Growth<br />
of <strong>Portable</strong> <strong>Imaging</strong> <strong>Solutions</strong> in France<br />
(2016-2022)<br />
19. Macro-Economic Factors Driving the <strong>Market</strong> Growth<br />
of <strong>Portable</strong> <strong>Imaging</strong> <strong>Solutions</strong> in Italy (2016-2022)<br />
20. Macro-Economic Factors Driving the <strong>Market</strong> Growth<br />
of <strong>Portable</strong> <strong>Imaging</strong> <strong>Solutions</strong> in Spain (2016-2022)<br />
21. Macro-Economic Factors Driving the <strong>Market</strong> Growth<br />
of <strong>Portable</strong> <strong>Imaging</strong> <strong>Solutions</strong> in Russia (2016-2022)<br />
22. Macro-Economic Factors Driving the <strong>Market</strong> Growth<br />
of <strong>Portable</strong> <strong>Imaging</strong> <strong>Solutions</strong> in Asia-Pacific<br />
(2016-2022)<br />
23. Macro-Economic Factors Driving the <strong>Market</strong> Growth<br />
of <strong>Portable</strong> <strong>Imaging</strong> <strong>Solutions</strong> in China (2016-2022)<br />
24. Macro-Economic Factors Driving the <strong>Market</strong> Growth<br />
of <strong>Portable</strong> <strong>Imaging</strong> <strong>Solutions</strong> in Japan (2016-2022)<br />
25. Macro-Economic Factors Driving the <strong>Market</strong> Growth<br />
of <strong>Portable</strong> <strong>Imaging</strong> <strong>Solutions</strong> in South Korea<br />
(2016-2022)<br />
26. Macro-Economic Factors Driving the <strong>Market</strong> Growth<br />
of <strong>Portable</strong> <strong>Imaging</strong> <strong>Solutions</strong> in India (2016-2022)<br />
27. Macro-Economic Factors Driving the <strong>Market</strong> Growth<br />
of <strong>Portable</strong> <strong>Imaging</strong> <strong>Solutions</strong> in Australia and New<br />
Zealand (2016-2022)<br />
28. Macro-Economic Factors Driving the <strong>Market</strong> Growth<br />
of <strong>Portable</strong> <strong>Imaging</strong> <strong>Solutions</strong> in Latin America<br />
(2016-2022)<br />
29. Macro-Economic Factors Driving the <strong>Market</strong> Growth<br />
of <strong>Portable</strong> <strong>Imaging</strong> <strong>Solutions</strong> in Brazil (2016-2022)<br />
30. Macro-Economic Factors Driving the <strong>Market</strong> Growth<br />
of <strong>Portable</strong> <strong>Imaging</strong> <strong>Solutions</strong> in Mexico<br />
(2016-2022)<br />
31. Macro-Economic Factors Driving the <strong>Market</strong> Growth<br />
of <strong>Portable</strong> <strong>Imaging</strong> <strong>Solutions</strong> in Argentina<br />
(2016-2022)<br />
32. Macro-Economic Factors Driving the <strong>Market</strong> Growth<br />
of <strong>Portable</strong> <strong>Imaging</strong> <strong>Solutions</strong> in Colombia<br />
(2016-2022)<br />
33. Macro-Economic Factors Driving the <strong>Market</strong> Growth<br />
of <strong>Portable</strong> <strong>Imaging</strong> <strong>Solutions</strong> in Middle East &<br />
Africa (2016-2022)<br />
34. Macro-Economic Factors Driving the <strong>Market</strong> Growth<br />
of <strong>Portable</strong> <strong>Imaging</strong> <strong>Solutions</strong> in KSA (2016-2022)<br />
35. Macro-Economic Factors Driving the <strong>Market</strong> Growth<br />
of <strong>Portable</strong> <strong>Imaging</strong> <strong>Solutions</strong> in U.A.E. (2016-2022)<br />
36. Macro-Economic Factors Driving the <strong>Market</strong> Growth<br />
of <strong>Portable</strong> <strong>Imaging</strong> <strong>Solutions</strong> in South Africa<br />
(2016-2022)<br />
sales@bisresearch.com | www.bisresearch.com
List of Figures<br />
1. Relationship between Diagnostic <strong>Imaging</strong> Units to<br />
other areas of Hospitals<br />
2. Global <strong>Portable</strong> <strong>Imaging</strong> <strong>Solutions</strong> <strong>Market</strong> Snapshot<br />
3. Dominating Segments of Global <strong>Portable</strong> <strong>Imaging</strong><br />
<strong>Solutions</strong> <strong>Market</strong>, 2017 and 2028<br />
4. Global <strong>Portable</strong> <strong>Imaging</strong> <strong>Solutions</strong> <strong>Market</strong> (by Product<br />
Type), 2017, 2025, and 2028<br />
5. Global <strong>Portable</strong> <strong>Imaging</strong> <strong>Solutions</strong> <strong>Market</strong> (by End<br />
User), 2017, 2025, and 2028<br />
6. Global <strong>Portable</strong> <strong>Imaging</strong> <strong>Solutions</strong> <strong>Market</strong> (by<br />
Region), 2017 and 2028<br />
7. Key Strategies Incorporated by the Key Players in the<br />
Global <strong>Portable</strong> <strong>Imaging</strong> <strong>Solutions</strong> <strong>Market</strong> (January<br />
2015-September-2018)<br />
8. <strong>Market</strong> Share <strong>Analysis</strong> for the Global <strong>Portable</strong><br />
<strong>Imaging</strong> <strong>Solutions</strong> <strong>Market</strong> (by Company), 2017<br />
9. Major Applications of <strong>Portable</strong> <strong>Imaging</strong> Modalities<br />
10. Discovery of Diagnostic <strong>Imaging</strong> Systems<br />
11. Classification of <strong>Portable</strong> <strong>Imaging</strong> <strong>Solutions</strong> <strong>Market</strong><br />
12. Potential Benefits & Risks of Medical <strong>Imaging</strong><br />
Systems<br />
13. Global <strong>Portable</strong> <strong>Imaging</strong> <strong>Solutions</strong> <strong>Market</strong>, 2017-2028<br />
14. <strong>Portable</strong> <strong>Imaging</strong> <strong>Solutions</strong> <strong>Market</strong> Sizing Factors and<br />
Assumptions<br />
15. Overview of <strong>Market</strong> Dynamics<br />
16. Change in Annual Growth Rate in Total Healthcare<br />
Expenditure<br />
17. Future Potential of Diagnostic <strong>Imaging</strong> <strong>Market</strong><br />
18. Standardization of Image Acquisition and Storage:<br />
Steps<br />
19. Integration of Computational Applications to Medical<br />
<strong>Imaging</strong>: Steps<br />
20. Accelerating the Development of High-Value <strong>Imaging</strong><br />
Technologies: Steps<br />
21. Percent Share of Key Developments and Strategies<br />
(January-2015 to September-2018)<br />
22. Percent Share of Product Approvals and Launches by<br />
Key Players (January-2015 to September-2018)<br />
23. Percent Share of Product Approvals and Launches<br />
(January-2015 to September-2018)<br />
24. Percent Share of Product Approvals and Launches by<br />
Key Players (January-2015 to September-2018)<br />
25. Percent Share of Strategic Agreements by Key<br />
Players (Januar-2015 to September 2018)<br />
26. Percent Share of Awards and Recognitions by Key<br />
players (January 2014-September-2018)<br />
27. <strong>Market</strong> Share <strong>Analysis</strong> for the Global <strong>Portable</strong><br />
<strong>Imaging</strong> <strong>Solutions</strong> <strong>Market</strong>, by Company (2016)<br />
28. <strong>Market</strong> Share <strong>Analysis</strong> for the Global <strong>Portable</strong><br />
<strong>Imaging</strong> <strong>Solutions</strong> <strong>Market</strong>, by Company (2017)<br />
29. <strong>Market</strong> Share <strong>Analysis</strong> for the Global <strong>Portable</strong><br />
<strong>Imaging</strong> <strong>Solutions</strong> <strong>Market</strong>, by <strong>Portable</strong> Ultrasound<br />
Scanners (2016)<br />
30. <strong>Market</strong> Share <strong>Analysis</strong> for the Global <strong>Portable</strong><br />
<strong>Imaging</strong> <strong>Solutions</strong> <strong>Market</strong>, by <strong>Portable</strong> Ultrasound<br />
Scanners (2017)<br />
31. <strong>Market</strong> Share <strong>Analysis</strong> for the Global <strong>Portable</strong><br />
<strong>Imaging</strong> <strong>Solutions</strong> <strong>Market</strong>, by Mobile X-Ray Systems<br />
(2016)<br />
32. <strong>Market</strong> Share <strong>Analysis</strong> for the Global <strong>Portable</strong><br />
<strong>Imaging</strong> <strong>Solutions</strong> <strong>Market</strong>, by Mobile X-Ray Systems<br />
(2017)<br />
33. <strong>Market</strong> Share <strong>Analysis</strong> for the Global <strong>Portable</strong><br />
<strong>Imaging</strong> <strong>Solutions</strong> <strong>Market</strong>, by Handheld Ultrasound<br />
Scanners (2016)<br />
34. <strong>Market</strong> Share <strong>Analysis</strong> for the Global <strong>Portable</strong><br />
<strong>Imaging</strong> <strong>Solutions</strong> <strong>Market</strong>, by Handheld Ultrasound<br />
Scanners (2017)<br />
35. <strong>Market</strong> Share <strong>Analysis</strong> for the Global <strong>Portable</strong><br />
<strong>Imaging</strong> <strong>Solutions</strong> <strong>Market</strong>, by <strong>Portable</strong> CT Scanners<br />
(2016 and 2017)<br />
36. Growth Share Matrix for Global <strong>Portable</strong> <strong>Imaging</strong><br />
<strong>Solutions</strong> <strong>Market</strong>, by Company (2017)<br />
37. Industry Attractiveness (Porter’s Five Forces <strong>Analysis</strong><br />
38. Bargaining Power of Suppliers: Overall Impact<br />
39. Bargaining Power of Buyers: Overall Impact<br />
40. Threat of New Entrants: Overall Impact<br />
41. Threat of Substitutes: Overall Impact<br />
42. Intensity of Competitive Rivalry: Overall Impact<br />
43. Regulatory Pathway for Diagnostic <strong>Imaging</strong> Systems<br />
in Europe<br />
44. U.S. Reimbursement System<br />
45. U.S. Payor Mix Ratio (2014 and 2017<br />
46. Germany Reimbursement System<br />
47. The U.K. Reimbursement System<br />
48. France Reimbursement System<br />
49. Global <strong>Portable</strong> <strong>Imaging</strong> <strong>Solutions</strong> <strong>Market</strong><br />
(by Product Type<br />
sales@bisresearch.com | www.bisresearch.com
List of Figures<br />
50. Global <strong>Portable</strong> <strong>Imaging</strong> <strong>Solutions</strong> <strong>Market</strong><br />
(by Product Type), 2017-2028<br />
51. <strong>Market</strong> Attractiveness <strong>Analysis</strong> (by Product Type)<br />
(2018-2028<br />
52. Growth Potential of Ultrasound Systems in Different<br />
Applications<br />
53. Global <strong>Portable</strong> <strong>Imaging</strong> <strong>Solutions</strong> <strong>Market</strong><br />
(by Ultrasound Systems), 2017-2028<br />
54. Global <strong>Portable</strong> <strong>Imaging</strong> <strong>Solutions</strong> <strong>Market</strong><br />
(by <strong>Portable</strong> Ultrasound Systems and Handheld<br />
Ultrasound Systems), 2017-2028<br />
55. Global <strong>Portable</strong> <strong>Imaging</strong> <strong>Solutions</strong> <strong>Market</strong> (by Mobile<br />
X-Ray Systems), 2017-2028<br />
56. Global <strong>Portable</strong> <strong>Imaging</strong> <strong>Solutions</strong> <strong>Market</strong><br />
(by Analog Mobile X-Ray Systems and Digital Mobile<br />
X-Ray Systems), 2017-2028<br />
57. Global <strong>Portable</strong> <strong>Imaging</strong> <strong>Solutions</strong> <strong>Market</strong><br />
(by <strong>Portable</strong> CT Scanners), 2017-2028<br />
58. Global <strong>Portable</strong> <strong>Imaging</strong> <strong>Solutions</strong> <strong>Market</strong><br />
(by End-User<br />
59. Global <strong>Portable</strong> <strong>Imaging</strong> <strong>Solutions</strong> <strong>Market</strong><br />
(by End-User), 2017-2028<br />
60. <strong>Market</strong> Attractiveness <strong>Analysis</strong> (by End-User)<br />
(2018-2028<br />
61. Global <strong>Portable</strong> <strong>Imaging</strong> <strong>Solutions</strong> <strong>Market</strong><br />
(by Hospitals and Ambulatory Surgical Centers),<br />
2017-2028<br />
62. Global <strong>Portable</strong> <strong>Imaging</strong> <strong>Solutions</strong> <strong>Market</strong> (by<br />
Diagnostic Centers), 2017-2028<br />
63. Global <strong>Portable</strong> <strong>Imaging</strong> <strong>Solutions</strong> <strong>Market</strong> (by Other<br />
End-Users), 2017-2028<br />
64. Global <strong>Portable</strong> <strong>Imaging</strong> <strong>Solutions</strong> <strong>Market</strong> Scenario,<br />
2017 and 2028<br />
65. Global <strong>Portable</strong> <strong>Imaging</strong> <strong>Solutions</strong> <strong>Market</strong> (by<br />
Region), 2017 and 2028<br />
66. <strong>Market</strong> Snapshot: North America <strong>Portable</strong> <strong>Imaging</strong><br />
<strong>Solutions</strong> <strong>Market</strong><br />
67. North America: <strong>Market</strong> Attractiveness <strong>Analysis</strong> (by<br />
Product Type) (2018-2028<br />
68. North America <strong>Portable</strong> <strong>Imaging</strong> <strong>Solutions</strong> <strong>Market</strong> (by<br />
Product Type), 2017-2028<br />
69. North America <strong>Portable</strong> <strong>Imaging</strong> <strong>Solutions</strong> <strong>Market</strong> (by<br />
Ultrasound Systems), 2017-2028<br />
70. North America <strong>Portable</strong> <strong>Imaging</strong> <strong>Solutions</strong> <strong>Market</strong><br />
(by <strong>Portable</strong> Ultrasound Systems and Handheld<br />
Ultrasound Systems), 2017-2028<br />
71. North America <strong>Portable</strong> <strong>Imaging</strong> <strong>Solutions</strong> <strong>Market</strong> (by<br />
Mobile X-Ray Systems), 2017-2028<br />
72. North America <strong>Portable</strong> <strong>Imaging</strong> <strong>Solutions</strong> <strong>Market</strong><br />
(by Analog Mobile X-Ray Systems and Digital Mobile<br />
X-Ray Systems), 2017-2028<br />
73. North America <strong>Portable</strong> <strong>Imaging</strong> <strong>Solutions</strong> <strong>Market</strong><br />
(by <strong>Portable</strong> CT Scanners), 2017-2028<br />
74. North America: <strong>Market</strong> Attractiveness <strong>Analysis</strong><br />
(by End-User) (2018-2028)<br />
75. North America <strong>Portable</strong> <strong>Imaging</strong> <strong>Solutions</strong> <strong>Market</strong><br />
(by End-Users), 2017-2028<br />
76. North America: <strong>Market</strong> Attractiveness <strong>Analysis</strong><br />
(by Country) (2018-2028)<br />
77. The U.S. <strong>Portable</strong> <strong>Imaging</strong> <strong>Solutions</strong> <strong>Market</strong>,<br />
2017-2028<br />
78. Patient Data by Cancer Type in the U.S. (2016)<br />
79. The Canada <strong>Portable</strong> <strong>Imaging</strong> <strong>Solutions</strong> <strong>Market</strong>,<br />
2017-2028<br />
80. Patient Data by Cancers Type in the Canada (2016)<br />
81. <strong>Market</strong> Snapshot: Europe <strong>Portable</strong> <strong>Imaging</strong> <strong>Solutions</strong><br />
<strong>Market</strong><br />
82. Europe: <strong>Market</strong> Attractiveness <strong>Analysis</strong> (by Product<br />
Type) (2018-2028)<br />
83. Europe <strong>Portable</strong> <strong>Imaging</strong> <strong>Solutions</strong> <strong>Market</strong><br />
(by Product Type), 2017-2028<br />
84. Europe <strong>Portable</strong> <strong>Imaging</strong> <strong>Solutions</strong> <strong>Market</strong><br />
(by Ultrasound Systems), 2017-2028<br />
85. Europe <strong>Portable</strong> <strong>Imaging</strong> <strong>Solutions</strong> <strong>Market</strong><br />
(by <strong>Portable</strong> Ultrasound Systems and Handheld<br />
Ultrasound Systems), 2017-2028<br />
86. Europe <strong>Portable</strong> <strong>Imaging</strong> <strong>Solutions</strong> <strong>Market</strong><br />
(by Mobile X-Ray Systems), 2017-2028<br />
87. Europe <strong>Portable</strong> <strong>Imaging</strong> <strong>Solutions</strong> <strong>Market</strong><br />
(by Analog Mobile X-Ray Systems and Digital Mobile<br />
X-Ray Systems), 2017-2028<br />
88. Europe <strong>Portable</strong> <strong>Imaging</strong> <strong>Solutions</strong> <strong>Market</strong><br />
(by <strong>Portable</strong> CT Scanners), 2017-2028<br />
89. Europe: <strong>Market</strong> Attractiveness <strong>Analysis</strong> (by End-User)<br />
(2018-2028)<br />
90. Europe <strong>Portable</strong> <strong>Imaging</strong> <strong>Solutions</strong> <strong>Market</strong> (by End-<br />
User), 2017-2028<br />
91. Europe: <strong>Market</strong> Attractiveness <strong>Analysis</strong> (by Country)<br />
(2018-2028)<br />
92. Germany <strong>Portable</strong> <strong>Imaging</strong> <strong>Solutions</strong> <strong>Market</strong>,<br />
2017-2028<br />
sales@bisresearch.com | www.bisresearch.com
List of Figures<br />
93. The U.K. <strong>Portable</strong> <strong>Imaging</strong> <strong>Solutions</strong> <strong>Market</strong>,<br />
2017-2028<br />
94. France <strong>Portable</strong> <strong>Imaging</strong> <strong>Solutions</strong> <strong>Market</strong>,<br />
2017-2028<br />
95. Italy <strong>Portable</strong> <strong>Imaging</strong> <strong>Solutions</strong> <strong>Market</strong>, 2017-2028<br />
96. Spain <strong>Portable</strong> <strong>Imaging</strong> <strong>Solutions</strong> <strong>Market</strong>, 2017-2028<br />
97. Russia <strong>Portable</strong> <strong>Imaging</strong> <strong>Solutions</strong> <strong>Market</strong>,<br />
2017-2028<br />
98. Nordic Countries <strong>Portable</strong> <strong>Imaging</strong> <strong>Solutions</strong> <strong>Market</strong>,<br />
2017-2028<br />
99. BENELUX Countries <strong>Portable</strong> <strong>Imaging</strong> <strong>Solutions</strong><br />
<strong>Market</strong>, 2017-2028<br />
100. Rest-of-Europe <strong>Portable</strong> <strong>Imaging</strong> <strong>Solutions</strong> <strong>Market</strong>,<br />
2017-2028<br />
101. <strong>Market</strong> Snapshot: Asia-Pacific <strong>Portable</strong> <strong>Imaging</strong><br />
<strong>Solutions</strong> <strong>Market</strong><br />
102. Asia-Pacific: <strong>Market</strong> Attractiveness <strong>Analysis</strong><br />
(by Product Type) (2018-2028)<br />
103. Asia-Pacific <strong>Portable</strong> <strong>Imaging</strong> <strong>Solutions</strong> <strong>Market</strong><br />
(by Product Type), 2017-2028<br />
104. Asia-Pacific <strong>Portable</strong> <strong>Imaging</strong> <strong>Solutions</strong> <strong>Market</strong><br />
(by Ultrasound Systems), 2017-2028<br />
105. Asia-Pacific <strong>Portable</strong> <strong>Imaging</strong> <strong>Solutions</strong> <strong>Market</strong><br />
(by <strong>Portable</strong> Ultrasound Systems and Handheld<br />
Ultrasound Systems), 2017-2028<br />
106. Asia-Pacific <strong>Portable</strong> <strong>Imaging</strong> <strong>Solutions</strong> <strong>Market</strong><br />
(by Mobile X-Ray Systems), 2017-2028<br />
107. Asia-Pacific <strong>Portable</strong> <strong>Imaging</strong> <strong>Solutions</strong> <strong>Market</strong><br />
(by Analog Mobile X-Ray and Digital Mobile X-Ray<br />
Systems), 2017-2028<br />
108. Asia-Pacific <strong>Portable</strong> <strong>Imaging</strong> <strong>Solutions</strong> <strong>Market</strong><br />
(by <strong>Portable</strong> CT Scanners), 2017-2028<br />
109. Asia-Pacific: <strong>Market</strong> Attractiveness <strong>Analysis</strong><br />
(by End-Users) (2018-2028)<br />
110. Asia-Pacific <strong>Portable</strong> <strong>Imaging</strong> <strong>Solutions</strong> <strong>Market</strong><br />
(by End-User), 2017-2028<br />
111. Asia-Pacific: <strong>Market</strong> Attractiveness <strong>Analysis</strong><br />
(by Country) (2018-2028)<br />
112. China <strong>Portable</strong> <strong>Imaging</strong> <strong>Solutions</strong> <strong>Market</strong>,<br />
2017-2028<br />
113. Japan <strong>Portable</strong> <strong>Imaging</strong> <strong>Solutions</strong> <strong>Market</strong>,<br />
2017-2028<br />
114. South Korea <strong>Portable</strong> <strong>Imaging</strong> <strong>Solutions</strong> <strong>Market</strong>,<br />
2017-2028<br />
115. India <strong>Portable</strong> <strong>Imaging</strong> <strong>Solutions</strong> <strong>Market</strong>, 2017-2028<br />
116. Australia and New Zealand <strong>Portable</strong> <strong>Imaging</strong><br />
<strong>Solutions</strong> <strong>Market</strong>, 2017-2028<br />
117. Rest-of-Asia-Pacific <strong>Portable</strong> <strong>Imaging</strong> <strong>Solutions</strong><br />
<strong>Market</strong>, 2017-2028<br />
118. <strong>Market</strong> Snapshot: Latin America <strong>Portable</strong> <strong>Imaging</strong><br />
<strong>Solutions</strong> <strong>Market</strong><br />
119. Latin America: <strong>Market</strong> Attractiveness <strong>Analysis</strong><br />
(by Product Type) (2018-2028)<br />
120. Latin America <strong>Portable</strong> <strong>Imaging</strong> <strong>Solutions</strong> <strong>Market</strong><br />
(by Product Type), 2017-2028<br />
121. Latin America <strong>Portable</strong> <strong>Imaging</strong> <strong>Solutions</strong> <strong>Market</strong><br />
(by Ultrasound Systems), 2017-2028<br />
122. Latin America <strong>Portable</strong> <strong>Imaging</strong> <strong>Solutions</strong> <strong>Market</strong><br />
(by <strong>Portable</strong> Ultrasound Systems and Handheld<br />
Ultrasound Systems), 2017-2028<br />
123. Latin America <strong>Portable</strong> <strong>Imaging</strong> <strong>Solutions</strong> <strong>Market</strong><br />
(by Mobile X-Ray Systems), 2017-2028<br />
124. Latin America <strong>Portable</strong> <strong>Imaging</strong> <strong>Solutions</strong> <strong>Market</strong><br />
(by Analog Mobile X-Ray and Digital Mobile X-Ray<br />
Systems), 2017-2028<br />
125. Latin America <strong>Portable</strong> <strong>Imaging</strong> <strong>Solutions</strong> <strong>Market</strong><br />
(by <strong>Portable</strong> CT Scanners), 2017-2028<br />
126. Latin America: <strong>Market</strong> Attractiveness <strong>Analysis</strong><br />
(by End-Users) (2018-2028)<br />
127. Latin America <strong>Portable</strong> <strong>Imaging</strong> <strong>Solutions</strong> <strong>Market</strong><br />
(by End-User), 2017-2028<br />
128. Latin America: <strong>Market</strong> Attractiveness <strong>Analysis</strong><br />
(by Country) (2018-2028)<br />
129. Brazil <strong>Portable</strong> <strong>Imaging</strong> <strong>Solutions</strong> <strong>Market</strong>, 2017-2028<br />
130. Mexico <strong>Portable</strong> <strong>Imaging</strong> <strong>Solutions</strong> <strong>Market</strong>,<br />
2017-2028<br />
131. Argentina <strong>Portable</strong> <strong>Imaging</strong> <strong>Solutions</strong> <strong>Market</strong>,<br />
2017-2028<br />
132. Colombia <strong>Portable</strong> <strong>Imaging</strong> <strong>Solutions</strong> <strong>Market</strong>,<br />
2017-2028<br />
133. Rest-of-Latin America <strong>Portable</strong> <strong>Imaging</strong> <strong>Solutions</strong><br />
<strong>Market</strong>, 2017-2028<br />
134. <strong>Market</strong> Snapshot: Middle East & Africa <strong>Portable</strong><br />
<strong>Imaging</strong> <strong>Solutions</strong> <strong>Market</strong><br />
135. Middle East & Africa: <strong>Market</strong> Attractiveness <strong>Analysis</strong><br />
(by Product Type) (2018-2028)<br />
136. Middle East & Africa <strong>Portable</strong> <strong>Imaging</strong> <strong>Solutions</strong><br />
<strong>Market</strong> (by Product Type), 2017-2028<br />
sales@bisresearch.com | www.bisresearch.com
List of Figures<br />
137. Middle East & Africa <strong>Portable</strong> <strong>Imaging</strong> <strong>Solutions</strong><br />
<strong>Market</strong> (by Ultrasound Systems), 2017-2028<br />
138. Middle East & Africa <strong>Portable</strong> <strong>Imaging</strong> <strong>Solutions</strong><br />
<strong>Market</strong> (by <strong>Portable</strong> Ultrasound Systems and<br />
Handheld Ultrasound Systems), 2017-2028<br />
139. Middle East & Africa <strong>Portable</strong> <strong>Imaging</strong> <strong>Solutions</strong><br />
<strong>Market</strong> (by Mobile X-Ray Systems), 2017-2028<br />
140. Middle East & Africa <strong>Portable</strong> <strong>Imaging</strong> <strong>Solutions</strong><br />
<strong>Market</strong> (by Analog Mobile X-Ray and Digital Mobile<br />
X-Ray Systems), 2017-2028<br />
141. Middle East & Africa <strong>Portable</strong> <strong>Imaging</strong> <strong>Solutions</strong><br />
<strong>Market</strong> (by <strong>Portable</strong> CT Scanners), 2017-2028<br />
142. Middle East & Africa: <strong>Market</strong> Attractiveness <strong>Analysis</strong><br />
(by End-Users) (2018-2028)<br />
143. Middle East & Africa <strong>Portable</strong> <strong>Imaging</strong> <strong>Solutions</strong><br />
<strong>Market</strong> (by End-User), 2017-2028<br />
144. Middle East & Africa: <strong>Market</strong> Attractiveness <strong>Analysis</strong><br />
(by Country) (2018-2028)<br />
145. KSA <strong>Portable</strong> <strong>Imaging</strong> <strong>Solutions</strong> <strong>Market</strong>, 2017-2028<br />
146. U.A.E. <strong>Portable</strong> <strong>Imaging</strong> <strong>Solutions</strong> <strong>Market</strong>, 2017-2028<br />
147. South Africa <strong>Portable</strong> <strong>Imaging</strong> <strong>Solutions</strong> <strong>Market</strong>,<br />
2017-2028<br />
148. Rest-of- Middle East & Africa <strong>Portable</strong> <strong>Imaging</strong><br />
<strong>Solutions</strong> <strong>Market</strong>, 2017-2028<br />
149. Analogic Corporation - Product Portfolio for <strong>Portable</strong><br />
<strong>Imaging</strong> <strong>Solutions</strong> <strong>Market</strong><br />
150. Analogic Corporation - Overall Financials, 2015-2017<br />
151. Analogic Corporation - Revenue (by Segment), 2015-<br />
2017<br />
152. Analogic Corporation - Revenue (by Region), 2015-<br />
2017<br />
153. Analogic Corporation - R&D Expenditure, 2015-2017<br />
154. SWOT <strong>Analysis</strong> - Analogic Corporation<br />
155. Canon Inc. - Product Portfolio for <strong>Portable</strong> <strong>Imaging</strong><br />
<strong>Solutions</strong> <strong>Market</strong><br />
156. Canon Inc. - Overall Financials, 2015-2017<br />
157. Canon Inc. - Revenue (by Segment), 2015-2017<br />
158. Canon Inc. - Revenue (by Region), 2015-2017<br />
159. Canon Inc. - R&D Expenditure, 2015-2017<br />
160. SWOT <strong>Analysis</strong> - Canon Inc<br />
161. Fujifilm Holdings Corporation - Product Portfolio for<br />
<strong>Portable</strong> <strong>Imaging</strong> <strong>Solutions</strong> <strong>Market</strong><br />
162. Fujifilm Holdings Corporation - Overall Financials,<br />
2015-2017<br />
163. Fujifilm Holdings Corporation - Revenue (by<br />
Segment), 2015-2017<br />
164. Fujifilm Holdings Corporation - Revenue (by Region),<br />
2015-2017<br />
165. Fujifilm Holdings Corporation - R&D Expenditure,<br />
2015-2017<br />
166. SWOT <strong>Analysis</strong> - Fujifilm Holdings Corporation<br />
167. General Electric Company - Product Portfolio for<br />
<strong>Portable</strong> <strong>Imaging</strong> <strong>Solutions</strong> <strong>Market</strong><br />
168. General Electric Company - Overall Financials, 2015-<br />
2017<br />
169. General Electric Company - Revenue (by Segment),<br />
2015-2017<br />
170. General Electric Company (GE Healthcare) -<br />
Revenue (by Segment), 2015-2017<br />
171. General Electric Company- Revenue (by Region),<br />
2015-2017<br />
172. General Electric Company (GE Healthcare) -<br />
Revenue (by Region), 2015-2017<br />
173. General Electric Company - R&D Expenditure,<br />
2015-2017<br />
174. SWOT <strong>Analysis</strong> - General Electric Company<br />
175. Hitachi, Ltd. - Product Portfolio for <strong>Portable</strong> <strong>Imaging</strong><br />
<strong>Solutions</strong> <strong>Market</strong><br />
176. Hitachi, Ltd. - Overall Financials, 2015-2017<br />
177. Hitachi, Ltd. - Revenue (by Segment), 2015-2017<br />
178. Hitachi, Ltd. - Revenue (by Region), 2015-2017<br />
179. Hitachi, Ltd. - R&D Expenditure, 2015-2017<br />
180. SWOT <strong>Analysis</strong> - Hitachi, Ltd<br />
181. Konica Minolta, Inc. - Product Portfolio for <strong>Portable</strong><br />
<strong>Imaging</strong> <strong>Solutions</strong> <strong>Market</strong><br />
182. Konica Minolta, Inc. - Overall Financials, 2015-2017<br />
183. Konica Minolta, Inc. - Revenue (by Segment),<br />
2015-2017<br />
184. Konica Minolta, Inc. - Revenue (by Region),<br />
2015-2017<br />
185. Konica Minolta, Inc. - R&D Expenditure, 2015-2017<br />
186. SWOT <strong>Analysis</strong> - Konica Minolta, Inc<br />
187. Koninklijke Philips N.V. - Product Portfolio for <strong>Portable</strong><br />
<strong>Imaging</strong> <strong>Solutions</strong> <strong>Market</strong><br />
sales@bisresearch.com | www.bisresearch.com
List of Figures<br />
188. Koninklijke Philips N.V. - Overall Financials, 2015-<br />
2017<br />
189. Koninklijke Philips N.V. - Revenue (by Segment),<br />
2015-2017<br />
190. Koninklijke Philips N.V. - Revenue (by Region), 2015-<br />
2017<br />
191. Koninklijke Philips N.V. - R&D Expenditure, 2015-<br />
2017<br />
192. SWOT <strong>Analysis</strong> - Koninklijke Philips N.V<br />
193. Samsung Electronics Co., Ltd. - Product Portfolio for<br />
<strong>Portable</strong> <strong>Imaging</strong> <strong>Solutions</strong> <strong>Market</strong><br />
194. Samsung Electronics Co., Ltd. - Overall Financials,<br />
2015-2017<br />
195. Samsung Electronics Co., Ltd. - Revenue (by<br />
Segment), 2015-2017<br />
196. Samsung Electronics Co., Ltd. - Revenue (by<br />
Region), 2015-2017<br />
197. Samsung Electronics Co., Ltd. - R&D Expenditure,<br />
2015-2017<br />
198. SWOT <strong>Analysis</strong> - Samsung Electronics Co., Ltd<br />
199. Shimadzu Corporation - Product Portfolio for <strong>Portable</strong><br />
<strong>Imaging</strong> <strong>Solutions</strong> <strong>Market</strong><br />
200. Shimadzu Corporation - Overall Financials, 2015-<br />
2017<br />
201. Shimadzu Corporation - Revenue (by Segment),<br />
2015-2017<br />
202. Shimadzu Corporation - Revenue (by Region), 2015-<br />
2017<br />
203. Shimadzu Corporation - R&D Expenditure, 2015-<br />
2017<br />
204. SWOT <strong>Analysis</strong> - Shimadzu Corporation<br />
205. Siemens Healthineers, Inc. - Product Portfolio for<br />
<strong>Portable</strong> <strong>Imaging</strong> <strong>Solutions</strong> <strong>Market</strong><br />
206. Siemens Healthineers, Inc. - Overall Financials,<br />
2016-2018<br />
207. Siemens Healthineers, Inc. - Revenue (by Segment),<br />
2016-2018<br />
208. Siemens Healthineers, Inc. - Revenue (by Region),<br />
2015-2017<br />
209. Siemens Healthineers, Inc. - R&D Expenditure, 2015-<br />
2017<br />
210. SWOT <strong>Analysis</strong> - Siemens Healthineers, Inc<br />
211. Carestream Health, Inc. - Product Portfolio for<br />
<strong>Portable</strong> <strong>Imaging</strong> <strong>Solutions</strong> <strong>Market</strong><br />
212. SWOT <strong>Analysis</strong> - Carestream Health, Inc<br />
213. Clarius Mobile Health Corp. - Product Portfolio for<br />
<strong>Portable</strong> <strong>Imaging</strong> <strong>Solutions</strong> <strong>Market</strong><br />
214. EchoNous, Inc. - Product Portfolio for <strong>Portable</strong><br />
<strong>Imaging</strong> <strong>Solutions</strong> <strong>Market</strong><br />
215. Esaote SpA - Product Portfolio for <strong>Portable</strong> <strong>Imaging</strong><br />
<strong>Solutions</strong> <strong>Market</strong><br />
216. SWOT <strong>Analysis</strong> - Esaote SpA<br />
217. Healcerion, Inc. - Product Portfolio for <strong>Portable</strong><br />
<strong>Imaging</strong> <strong>Solutions</strong> <strong>Market</strong><br />
218. Mindray Medical International Limited - Product<br />
Portfolio for <strong>Portable</strong> <strong>Imaging</strong> <strong>Solutions</strong> <strong>Market</strong><br />
219. SWOT <strong>Analysis</strong> - Mindray Medical International<br />
Limited<br />
220. Teratech Corporation - Product Portfolio for <strong>Portable</strong><br />
<strong>Imaging</strong> <strong>Solutions</strong> <strong>Market</strong><br />
221. Whale <strong>Imaging</strong>, Inc. - Product Portfolio for <strong>Portable</strong><br />
<strong>Imaging</strong> <strong>Solutions</strong> <strong>Market</strong><br />
222. Xoran Technologies, LLC - Product Portfolio for<br />
<strong>Portable</strong> <strong>Imaging</strong> <strong>Solutions</strong> <strong>Market</strong><br />
223. Global <strong>Portable</strong> <strong>Imaging</strong> <strong>Solutions</strong> <strong>Market</strong><br />
224. Global <strong>Portable</strong> <strong>Imaging</strong> <strong>Solutions</strong> <strong>Market</strong>: Research<br />
Methodology<br />
225. Primary Research<br />
226. Secondary Research<br />
227. Data Triangulation<br />
228. Bottom-Up Approach<br />
229. Top-Down Approach<br />
230. Considered Factors for Data Prediction and Modelling<br />
sales@bisresearch.com | www.bisresearch.com
Research Scope & BIS Methodology<br />
1. Scope of the Report<br />
The report constitutes of an in-depth study of the global potable imaging solutions market, including a thorough analysis<br />
of the types of products. The study also presents a detailed analysis of the market dynamics and the estimation of the<br />
market size over the forecast period 2018-2028. The scope of this report is focused on the potable imaging solutions<br />
products and their country-wise analysis. The report does not take into consideration stand-alone diagnostic imaging<br />
modalities and interventional diagnostic systems. Furthermore, the report considers ultrasound systems, X-ray systems,<br />
and CT scanners that are portable.<br />
The market analysis includes an in-depth examination of the key ecosystem players and key strategies and developments<br />
taking place in this market. However, the market estimation only includes the potable imaging solutions manufacturers<br />
across the globe. Further, it includes the market dynamics (market drivers, opportunities, and challenges) and industry<br />
analysis. The purpose of the study is to gain a holistic view of the global potable imaging solutions market in terms of<br />
various factors influencing the market, including regulatory reforms and technological advancements. The market has<br />
been segmented into ‘product type’, ‘end users’, and ‘regions’. The scope of this report is centered upon conducting a<br />
detailed study of the products allied with the potable imaging solutions market. The report also comprises opportunity<br />
analysis of potable imaging solutions in North America, Europe, Asia-Pacific, Latin America, and Middle East and Africa<br />
regions. Furthermore, the study also includes the exhaustive information on the unmet needs, perception on the new<br />
products, competitive landscape, market share of leading manufacturers, growth potential of each product type, end<br />
user, and region, as well as other vital information with respect to the potable imaging solutions market.<br />
Products for which no real-time data was available in the public domain, personnel from the respective companies were<br />
contacted in order to gain valuable information pertaining to the product in different regions and their corresponding<br />
prices. This information was then used to estimate the global number for a particular product which was later validated<br />
by the industry experts.<br />
2. <strong>Market</strong> Research Methodology<br />
The research methodology design adopted for this specific study includes a mix of data collected from primary and<br />
secondary sources. Both primary sources (in-house experts, industry leaders, and market players) and secondary<br />
sources (a host of paid and unpaid databases) along with analytical tools have been used exhaustively to build the<br />
forecast and predictive models.<br />
sales@bisresearch.com | www.bisresearch.com
Research Scope & BIS Methodology<br />
Figure 1: Research Methodology<br />
Scope Definition<br />
Research Design<br />
<strong>Market</strong> Study<br />
Qualitative<br />
Quantitative<br />
Primary Interviews/<br />
Secondary Research<br />
Top Down and<br />
Bottom Up<br />
Primary &<br />
Secondary Data<br />
Report<br />
Writing<br />
Data Validation<br />
Data <strong>Analysis</strong><br />
Data Collection<br />
Primary Data Sources<br />
The key data points taken from the primary sources include:<br />
• Validation and triangulation of all the numbers and graphs<br />
• Validation of report segmentation and key qualitative findings<br />
• Understanding the competitive landscape<br />
• Understanding and considering the factors for market dynamics of various market segments and subsegments<br />
• Validation of impact analysis of macro and micro factors in different countries<br />
• Percentage split of individual markets for geographical analysis<br />
sales@bisresearch.com | www.bisresearch.com
Research Scope & BIS Methodology<br />
Secondary Data Sources<br />
The research study involves the usage of extensive secondary sources such as databases, company websites, and<br />
annual reports, among others.<br />
The following figure exhibits key secondary data sources considered in this report:<br />
Figure 2: Secondary Data Sources<br />
Stock Analyst Websites<br />
• Seeking Alpha<br />
• Yahoo Finance<br />
• Wiki Finance<br />
• The Wall Street Journal<br />
Company Sources<br />
• Annual Reports<br />
• Press Releases<br />
• Sec Filings<br />
• Investor Presentations<br />
• Financial Disclosures<br />
SECONDARY<br />
DATA SOURCES<br />
Government and Regulatory Sources<br />
Centers for Disease Control and<br />
Prevention (CDC)<br />
The World Health Organization (WHO)<br />
The National Health Services (NHS)<br />
The National Center for Biotechnology<br />
Infromation (NCBI)The Food & Drug<br />
Administration of United States<br />
(U.S. FDA)<br />
Public and Private Database<br />
• Medline<br />
• PubMed<br />
• National Library of Medicine<br />
• ProQuest<br />
• CMS Database<br />
• Medicare Beneficiary Database<br />
• Oxon Epidemiology<br />
The key data points taken from the secondary sources include:<br />
• Segmentation breakups, split-ups, and percentage shares<br />
• Data for market value<br />
• Key industry trends of the top players of the market<br />
• Qualitative insights into various aspects of the market, key trends, and emerging areas of innovation<br />
• Quantitative data for mathematical and statistical calculations<br />
sales@bisresearch.com | www.bisresearch.com
Research Scope & BIS Methodology<br />
Figure 3: Data Triangulation<br />
List of Tables<br />
The following figure exhibits data triangulation considered:<br />
Data <strong>Analysis</strong><br />
The data collected from primary and Secondary<br />
resources is validated and analyzed to arrive at<br />
a market size through a top-down or a bottom-up<br />
approach<br />
Data <strong>Analysis</strong><br />
Primary Sources<br />
DATA<br />
TRIANGULATION<br />
Secondary Sources<br />
Primary Sources<br />
Secondary Sources<br />
Qualitative and Quantitative dada collected<br />
from interviews conducted with senior<br />
management personnel from renowned<br />
companies and industry experts.<br />
Qualitative data collected from reliable<br />
resources, white papers, e-magazines,<br />
government records, and trade data.<br />
REQUEST FOR SAMPLE<br />
sales@bisresearch.com | www.bisresearch.com
BIS Research<br />
39111 Paseo Padre PKWY STE 313,<br />
Fremont CA 94538-1686,<br />
Tel: +1-510-404-8135<br />
Global Delivery Centre<br />
Tapasya Corp Heights, Subarea,<br />
Sector 126, Noida, NCR-201303 India<br />
Tel: +91 120 4261540 / +91 120 4261544<br />
To know more about us, please visit our website:<br />
bisresearch.com<br />
For other queries contact:<br />
sales@bisresearch.com<br />
sales@bisresearch.com<br />
sales@bisresearch.com |<br />
|<br />
www.bisresearch.com<br />
www.bisresearch.com