

WIO bleaching alert-19-03-15

Create successful ePaper yourself
Turn your PDF publications into a flip-book with our unique Google optimized e-Paper software.
WESTERN INDIAN OCEAN – Regional coral <strong>bleaching</strong> <strong>alert</strong><br />
Bleaching Alert Level<br />
‘warning’ – indications of warmer<br />
conditions that may result in some<br />
<strong>bleaching</strong><br />
‘level 1’ – moderate <strong>bleaching</strong><br />
possible<br />
‘level 2’ – severe <strong>bleaching</strong> likely<br />
Letters in the brackets under the<br />
‘region’ column refer to the <strong>WIO</strong><br />
climatology regions, depicted in the<br />
map in the top right corner.<br />
DATE OF THIS ALERT: <strong>15</strong> March 20<strong>19</strong><br />
http://www.cordioea.net/<strong>bleaching</strong><strong>alert</strong>/<br />
Contact: <strong>bleaching</strong>@cordioea.net<br />
<strong>15</strong> March 20<strong>19</strong> – Coral <strong>bleaching</strong> forecast – Western Indian Ocean<br />
Area Region Alert Bleaching observations/comments<br />
S Moz/S Africa Cool, south (D1) none Bleaching risk likely over<br />
S<strong>WIO</strong>/E Madag Cool, south (D2) moderate Moderate <strong>bleaching</strong> but likely to cool<br />
soon<br />
SW Madagascar Hot, south (A1) warning Bleaching risk likely over<br />
South Equat Curr Moderate, central (C) warning Bleaching risk likely over<br />
East Moz Cha/Comoros Hot, central (A2) moderate none<br />
NW Moz Cha /C Tanz Warm, central (B) moderate none<br />
NW Seychelles Hot, north (A3) moderate Paling reported in Mahe<br />
Kenya-Somalia Variable, north (E) moderate Paling in southern Kenya<br />
With significant cooling in the Mozambique Channel, the risk of <strong>bleaching</strong> has likely dissipated for the remainder of the season in the<br />
Southern Mozambique Channel (both sides), and perhaps off East Madagascar. Mauritius and Reunion may still experience moderate<br />
<strong>bleaching</strong>. The risk of <strong>bleaching</strong> in Seychelles, Tanzania, southern Kenya and parts of the Northern Mozambique Channel continues.<br />
Greater Horn of Africa Climate Outlook<br />
The regional consensus climate outlook for the MAM 20<strong>19</strong> season has been published<br />
(http://icpac.net/wp-content/uploads/GHACOF51_Statement.pdf), indicating normal<br />
rainfall and warmer than normal temperatures over much of the coastal belts of the<br />
Greater Horn of Africa.<br />
NOAA Products – <strong>15</strong> March 20<strong>19</strong><br />
SST Anomaly SST Trends DHW<br />
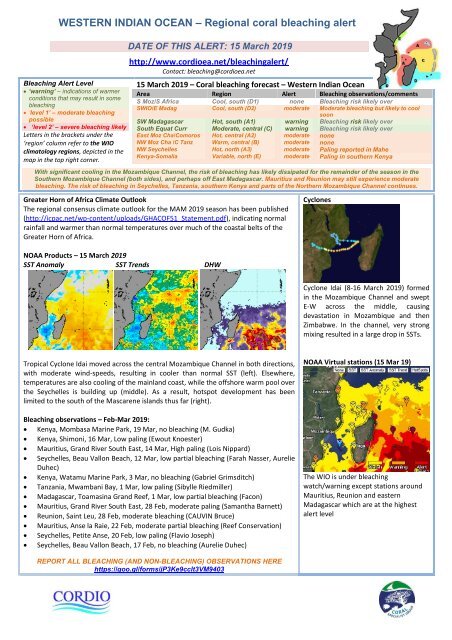
Cyclones<br />
Cyclone Idai (8-16 March 20<strong>19</strong>) formed<br />
in the Mozambique Channel and swept<br />
E-W across the middle, causing<br />
devastation in Mozambique and then<br />
Zimbabwe. In the channel, very strong<br />
mixing resulted in a large drop in SSTs.<br />
Tropical Cyclone Idai moved across the central Mozambique Channel in both directions,<br />
with moderate wind-speeds, resulting in cooler than normal SST (left). Elsewhere,<br />
temperatures are also cooling of the mainland coast, while the offshore warm pool over<br />
the Seychelles is building up (middle). As a result, hotspot development has been<br />
limited to the south of the Mascarene islands thus far (right).<br />
Bleaching observations – Feb-Mar 20<strong>19</strong>:<br />
Kenya, Mombasa Marine Park, <strong>19</strong> Mar, no <strong>bleaching</strong> (M. Gudka)<br />
Kenya, Shimoni, 16 Mar, Low paling (Ewout Knoester)<br />
Mauritius, Grand River South East, 14 Mar, High paling (Lois Nippard)<br />
Seychelles, Beau Vallon Beach, 12 Mar, low partial <strong>bleaching</strong> (Farah Nasser, Aurelie<br />
Duhec)<br />
Kenya, Watamu Marine Park, 3 Mar, no <strong>bleaching</strong> (Gabriel Grimsditch)<br />
Tanzania, Mwambani Bay, 1 Mar, low paling (Sibylle Riedmiller)<br />
Madagascar, Toamasina Grand Reef, 1 Mar, low partial <strong>bleaching</strong> (Facon)<br />
Mauritius, Grand River South East, 28 Feb, moderate paling (Samantha Barnett)<br />
Reunion, Saint Leu, 28 Feb, moderate <strong>bleaching</strong> (CAUVIN Bruce)<br />
Mauritius, Anse la Raie, 22 Feb, moderate partial <strong>bleaching</strong> (Reef Conservation)<br />
Seychelles, Petite Anse, 20 Feb, low paling (Flavio Joseph)<br />
Seychelles, Beau Vallon Beach, 17 Feb, no <strong>bleaching</strong> (Aurelie Duhec)<br />
NOAA Virtual stations (<strong>15</strong> Mar <strong>19</strong>)<br />
The <strong>WIO</strong> is under <strong>bleaching</strong><br />
watch/warning except stations around<br />
Mauritius, Reunion and eastern<br />
Madagascar which are at the highest<br />
<strong>alert</strong> level<br />
REPORT ALL BLEACHING (AND NON-BLEACHING) OBSERVATIONS HERE<br />
https://goo.gl/forms/jP3Ke9cclt3VM94<strong>03</strong>
WESTERN INDIAN OCEAN – Regional coral <strong>bleaching</strong> <strong>alert</strong><br />
Explanations<br />
<strong>WIO</strong> climatology regions<br />
DATE OF THIS ALERT: <strong>15</strong> March 20<strong>19</strong><br />
Since 2014, <strong>bleaching</strong><br />
reporting regions are used<br />
as defined by SST analysis<br />
from the last decade (20<strong>03</strong>-<br />
2009 as ‘background’ years,<br />
and 2010 as a year of high<br />
<strong>bleaching</strong>), rather than a<br />
longer historical record that<br />
includes pre-<strong>19</strong>98 SSTs.<br />
Five SST zones were<br />
identified:<br />
A – the hottest region; the East Mozambique Channel<br />
and Comoros (reported as SW Madagascar and<br />
the NE Madagascar Channel) and the NW<br />
Seychelles islands. Split into 3 sub-regions.<br />
B – the second hottest region; East African mainland<br />
coast from 7-18 o S (Zanzibar/Dar es Salaam to<br />
Primeiras/Segundas islands), and including the<br />
Northwest Mozambique Channel<br />
C – a moderate/intermediate region; the South<br />
Equatorial Current region, comprising the<br />
Mascarene Banks, southern Seychelles islands<br />
and NE Madagascar<br />
D – the southern cooler regions; SW Indian Ocean<br />
islands, E and S Madagascar and S Mozambique<br />
and South Africa. Split into 2 sub-regions.<br />
E – the cooler northern but highly variable region; the<br />
Kenya-Somali coast, including Pemba island and<br />
N Tanzania coast (Tanga).<br />
Because of latitudinal variation (e.g. in A) and<br />
geographic splitting (e.g. A and D), we report in 8<br />
sub-regions.<br />
Alert levels<br />
Statistical analysis of <strong>alert</strong>s from 2007-13 indicated<br />
that low confidence is attached to an <strong>alert</strong> of ‘low’<br />
<strong>bleaching</strong> risk (i.e. not zero risk, but not severe). By<br />
contrast, predictions of ‘mid’ and ‘high’ risk of<br />
<strong>bleaching</strong> were more reliable. Accordingly, the <strong>alert</strong> is<br />
being presented as:<br />
‘warning’ – indications of warmer conditions that<br />
may result in some <strong>bleaching</strong><br />
‘level 1’ – moderate <strong>bleaching</strong> possible<br />
<br />
‘level 2’ – severe <strong>bleaching</strong> likely<br />
These findings match the categories used by NOAA,<br />
with ‘watch’, ‘<strong>bleaching</strong> level 1’ and <strong>bleaching</strong> level 2’<br />
categories.<br />
Sea Surface Temperatures (SST)<br />
The surface of the sea heats up by direct insolation,<br />
causing stress to corals and other shallow water<br />
organisms. Satellites directly measure the skintemperature<br />
of the sea, providing these maps and<br />
coral <strong>bleaching</strong> products for early warning.<br />
Predicted Bleaching<br />
The Bleaching Thermal Stress Outlook is based on<br />
sea surface temperature (SST) forecasts generated<br />
by the Linear Inverse Model from the NOAA Earth<br />
System Research Laboratory. In a normal year, the<br />
Outlook forecasts no potential for <strong>bleaching</strong>. The<br />
baseline years for calculations (i.e. the climatology)<br />
are <strong>19</strong>85-93, excluding <strong>19</strong>91<br />
and <strong>19</strong>92 due to high atmosphere<br />
volcanic dust from Mt. Pinatubo.<br />
Wind-driven mixing<br />
Wind is an important physical factor influencing<br />
conditions conducive to coral <strong>bleaching</strong>. Wind-driven<br />
mixing reduces temperature stress and wind<br />
generated waves can scatter harmful levels of<br />
incoming solar radiation.<br />
<br />
<br />
Cyclones - cause strong mixing, reducing SST.<br />
Doldrums - periods of sustained low wind<br />
promote stratification, and heating of the upper<br />
layers of water. They therefore promote<br />
environmental conditions adverse to corals<br />
experiencing thermal and/or light stress.<br />
El Niño/Southern Oscillation (ENSO)<br />
The El Niño/Southern Oscillation (ENSO) is the most<br />
important coupled ocean-atmosphere phenomenon to<br />
cause global climate variability on interannual time<br />
scales.<br />
Multivariate ENSO Index (MEI) - Negative values of<br />
the MEI represent the cold ENSO phase (La<br />
Niña), while positive MEI values represent the<br />
warm ENSO phase (El Niño).<br />
The Southern Oscillation Index (SOI) is calculated<br />
from the monthly or seasonal fluctuations in the<br />
air pressure difference between Tahiti and Darwin<br />
(Note, negative SOI is equivalent to positive MEI).<br />
The Nino 3.4 index is similar to the SOI, but focused<br />
on the central Pacific Niño region, straddling the<br />
equator and from 170-120 o W. It has been found<br />
to be most strongly associated with climatic<br />
consequences in the African region, so is used<br />
here.<br />
Indian Ocean Dipole<br />
The Indian Ocean Dipole is analogous to the ENSO,<br />
but for the Indian Ocean. It is calculated using the<br />
Dipole Mode Index (DMI), which calculates the<br />
gradient between the western equatorial Indian<br />
Ocean (50E-70E and 10S-10N) and the south<br />
eastern equatorial Indian Ocean (90E-110E and 10S-<br />
0N).<br />
Global indicators<br />
Local temperatures are affected by global and<br />
regional trends. With global warming, temperatures<br />
are expected to rise over longer periods (decades),<br />
but significant variation can occur between years, and<br />
under the influence of regional and multi-year factors<br />
such as ocean-atmosphere interactions across the<br />
Pacific and Indian Ocean.<br />
Data sources<br />
http://www.metoffice.gov.uk/news/releases/archive/2014/20<br />
<strong>15</strong>-global-temp-forecast<br />
http://www.jamstec.go.jp/frsgc/research/d1/iod/e/seasonal/o<br />
utlook.html<br />
http://coralreefwatch.noaa.gov/<br />
http://australiasevereweather.com/cyclones/index.html<br />
http://www.mtotec.com/<br />
http://www.ioc-goosoopc.org/state_of_the_ocean/sur/ind/dmi.php<br />
http://www2.cnrs.fr/en/3148.htm<br />
https://en.wikipedia.org/wiki/2018%E2%80%931<br />
9_South-West_Indian_Ocean_cyclone_season


