FINAL_PlaceMatters-ChildrensHealth_District_3

You also want an ePaper? Increase the reach of your titles
YUMPU automatically turns print PDFs into web optimized ePapers that Google loves.
COUNCIL<br />
DISTRICT<br />
3<br />
RANKING: *<br />
2<br />
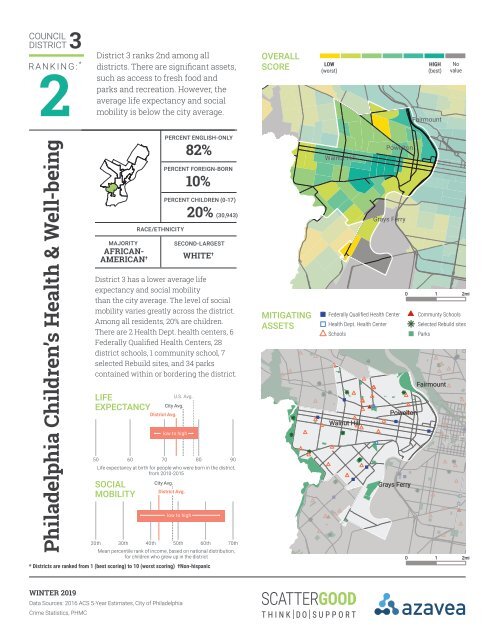
istrict ranks nd among all<br />
districts. here are significant assets<br />
such as access to fresh food and<br />
parks and recreation. owever the<br />
average life epectancy and social<br />
mobility is below the city average.<br />
OVERALL<br />
SCORE<br />
LOW<br />
(worst)<br />
HIGH<br />
(best)<br />
Fairmount<br />
No<br />
value<br />
Philadelphia Children’s Health & Well-being<br />
MAJORITY<br />
AFRICAN-<br />
AMERICAN †<br />
RACE/ETHNICITY<br />
PERCENT ENGLISH-ONLY<br />
82%<br />
PERCENT FOREIGN-BORN<br />
10%<br />
PERCENT CHILDREN (0-17)<br />
20% (30,943)<br />
SECOND-LARGEST<br />
WHITE †<br />
istrict has a lower average life<br />
epectancy and social mobility<br />
than the city average. he level of social<br />
mobility varies greatly across the district.<br />
mong all residents are children.<br />
here are ealth ept. health centers <br />
ederally ualified ealth enters <br />
district schools community school <br />
selected ebuild sites and parks<br />
contained within or bordering the district.<br />
LIFE<br />
EXPECTANCY<br />
City Avg.<br />
<strong>District</strong> Avg.<br />
U.S. Avg.<br />
low to high<br />
50 60 70 80 90<br />
Life expectancy at birth for people who were born in the district,<br />
from 2010-2015<br />
SOCIAL<br />
MOBILITY<br />
City Avg.<br />
<strong>District</strong> Avg.<br />
low to high<br />
20th 30th 40th 50th 60th 70th<br />
Mean percentile rank of income, based on national distribution,<br />
for children who grew up in the district<br />
* <strong>District</strong>s are ranked from 1 (best scoring) to 10 (worst scoring) †Non-hispanic<br />
MITIGATING<br />
ASSETS<br />
Powelton<br />
Walnut Hill<br />
Grays Ferry<br />
0 1 2mi<br />
Federally Qualified Health Center Communty Schools<br />
Health Dept. Health Center<br />
Schools<br />
Selected Rebuild sites<br />
Parks<br />
Fairmount<br />
Powelton<br />
Walnut Hill<br />
Grays Ferry<br />
0 1 2mi<br />
WINTER 2019<br />
Data Sources: 2016 ACS 5-Year Estimates, City of Philadelphia<br />
Crime Statistics, PHMC
Philadelphia Children’s Health & Well-being<br />
RISK SCORE<br />
hooting incidents are in the rd percentile.<br />
dults eperiencing an dverse hildhood<br />
perience is in the th percentile.<br />
nemployment is in the th percentile.<br />
ASSET SCORE<br />
here is relatively high access to parks<br />
and recreation food access and behavioral<br />
health utiliation. chool quality is in the<br />
th percentile.<br />
COUNCIL<br />
DISTRICT<br />
3<br />
RANKING:<br />
2<br />
100<br />
100<br />
PERCENTILE<br />
80<br />
60<br />
40<br />
AVG.<br />
SCORE<br />
52.7<br />
PERCENTILE<br />
80<br />
60<br />
40<br />
AVG.<br />
SCORE<br />
58.3<br />
20<br />
20<br />
0<br />
Crime<br />
Educational<br />
Attainment<br />
Poverty Unemployment<br />
ACEs<br />
0<br />
School<br />
Quality<br />
Parks &<br />
Recreation<br />
Food<br />
Access<br />
SNAP<br />
Utilization<br />
Behavioral<br />
Health<br />
Utilization<br />
Risk Score<br />
Asset Score<br />
Lowest Highest Lowest Highest<br />
No<br />
Value<br />
No<br />
Value<br />
MITIGATING ASSETS<br />
<strong>District</strong> 3 Best Score Comparison<br />
Score (<strong>District</strong> #)<br />
School Quality 49.9 82.3 (10)<br />
Park and Recreation Access 62.6 72.9 (5)<br />
Fresh Food Access 61.4 73.4 (1)<br />
SNAP Utilization 55.4 77.9 (7)<br />
Children’s Behavioral Health Services Utilization 61.9 78.4 (7)<br />
KEY TAKEAWAY<br />
0 25 50 75 100<br />
istrict has significant assets to build upon particularly access to parks and recreation and behavioral health<br />
utiliation. hat said risks remain in the district that should be addressed including eposure to crime and<br />
unemployment. sing the high level of behavioral health utiliation to mitigate these risks may be a helpful strategy.<br />
WINTER 2019<br />
Data Sources: 2016 ACS 5-Year Estimates, City of Philadelphia Crime Statistics, PHMC<br />
For full report, see scattergoodfoundation.org