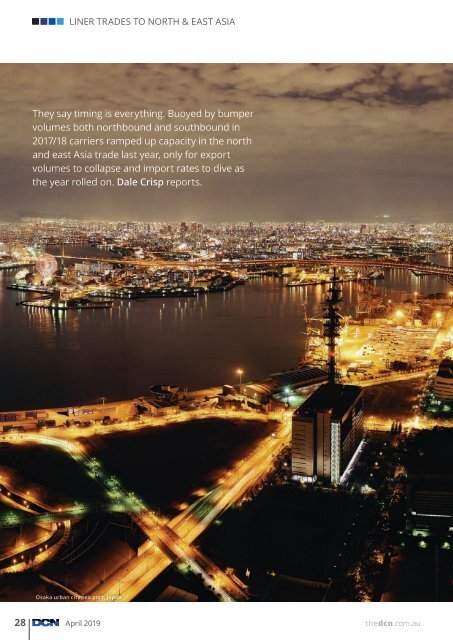
LINER TRADES TO NORTH & EAST ASIA They say timing is everything. Buoyed by bumper volumes both northbound and southbound in 2017/18 carriers ramped up capacity in the north and east Asia trade last year, only for export volumes to collapse and import rates to dive as the year rolled on. Dale Crisp reports. Osaka urban city sea port, Japan Xxxxxxxxx Image supplied 28 <strong>April</strong> <strong>2019</strong> thedcn.com.au
Reality bites Who’d be in liner shipping? Container trade analysts say history suggests that if carriers have two good years in 10, they’re doing well – and even that may be optimistic. The trade between north and east Asia and Australia is the nation’s biggest and most important, which is why over time it has attracted players like the proverbial moths to the flame. But when the flame flickers … AS ALWAYS, STATISTICS TELL A LOT OF THE STORY In calendar year 2018 the southbound trade produced one of its strongest growth years, at 7%, helping to explain why some carriers thought an extra service and bigger ships could be justified. Volumes from China grew 8%, while Japan receded 4%, Korea grew 1%, Taiwan slipped 1% and Hong Kong dropped 6%, although it’s hard to know how much of the latter was simply business shipping directly from South China instead of, as previously, moving via HK transhipment. All in all the southbound N&EA trade hit 1.684m TEU, of which China accounted for 1.45m. “This does not mean North Asia services will end,” a carrier executive was quick to assure, despite the huge importance of China continuing to grow year on year. Japan still provided 62,000 TEU of southbound cargo, Korea 75,000 and Taiwan 63,000 – although liftings from Japan and Korea were hit by the demise of car manufacturing in Australia. Despite instinct suggesting otherwise, northbound trade from Australia to N&EA actually grew in 2018, by 1.8% - but this growth was almost entirely thanks to reefer cargoes which shot up by 9.7% on the back of strong demand for citrus, grapes and meat. Dry cargo liftings were hit, with, most notably, grain, cotton and wastes all in sharp reverse. Total northbound trade grew around 12,000 TEU in 2018 but still only reached 807,000 TEU – and that growth went to China where liftings reached 484,000 TEU while Japan (125,000), Korea (101,000), Taiwan (62,000) and Hong Kong (32,000) were stable or slipping. That reefer growth also went mostly to China, with Japan and Korea stable. Xxxxxxxxx Songquan Image Deng supplied CHINA AND FINE WINE One of the bright spots for carriers in recent years has been the increasing Chinese demand for Australian wine but that looks to have plateaued in 2018, with the N&EA total reaching 19,000 TEU in 2018, just 500 TEU up on 2017. However, this compares with just 8500 TEU in 2015. The big year was 2016, when shipments doubled; since then growth has been more incremental. Of course the fundamental takeout from these overall figures is that the N&EA trade remains harshly imbalanced, in the ratio of 2:1 southbound over northbound, which means there’s a core structural problem that lines are powerless to overcome. With those northbound staples falling away carriers have had to revert to their earlier practice of evacuating empties at every opportunity, either by filling otherwise unused (paying) northbound slots or by chartering ships to sweep up the empties (see accompanying article). “Our mantra is ‘get the boxes out’,” says one trade manager. “That is, if you can get them into and through the terminals in the first place.” CHINESE NEW YEAR He notes the fall-off in southbound business at Chinese New Year – generally expected but much more severe in <strong>2019</strong> than 2018 – saw 12 round voyages cancelled “which means 12 lost opportunities to reposition empties”. And it is this fall-off in southbound business, thedcn.com.au <strong>April</strong> <strong>2019</strong> 29