Trading Report July 2019
Report on trading activity at BSP SouthPool Energy Exchange
Report on trading activity at BSP SouthPool Energy Exchange

Create successful ePaper yourself
Turn your PDF publications into a flip-book with our unique Google optimized e-Paper software.
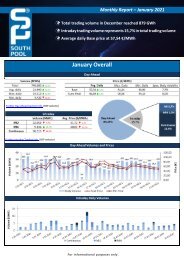
Monthly <strong>Report</strong> – <strong>July</strong> <strong>2019</strong><br />
)<br />
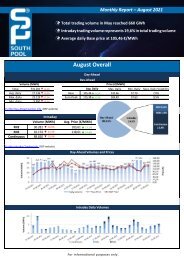
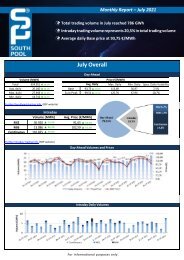
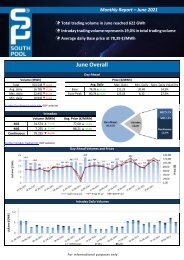
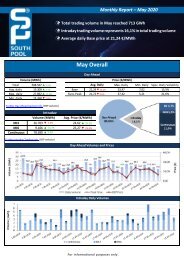
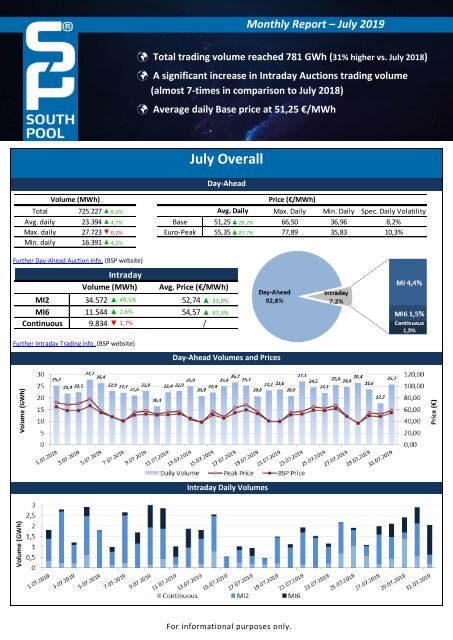
Total trading volume reached 781 GWh (31% higher vs. <strong>July</strong> 2018)<br />
A significant increase in Intraday Auctions trading volume<br />
(almost 7-times in comparison to <strong>July</strong> 2018)<br />
Average daily Base price at 51,25 €/MWh<br />
Volume (MWh)<br />
Further Day-Ahead Auction Info. (BSP website)<br />
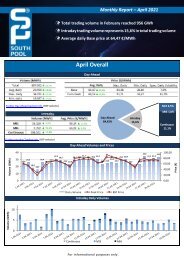
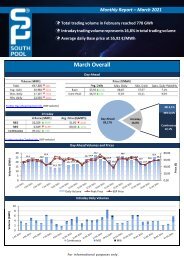
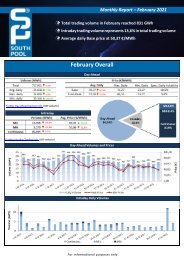
<strong>July</strong> Overall<br />
Day-Ahead<br />
Total 725.227 ▲ 8,2% Avg. Daily Max. Daily Min. Daily Spec. Daily Volatility<br />
Avg. daily 23.394 ▲ 4,7% Base 51,25▲28,2% 66,50 36,96 8,2%<br />
Max. daily 27.723 ▼ 0,2% Euro-Peak 55,35▲27,7% 77,89 35,83 10,3%<br />
Min. daily 16.391 ▲ 4,2%<br />
Intraday<br />
Volume (MWh)<br />
Avg. Price (€/MWh)<br />
MI2 34.572 ▲ 49,5% 52,74 ▲ 31,9%<br />
MI6 11.544 ▲ 2,6% 54,57 ▲ 47,3%<br />
Continuous 9.834 ▼ 1,7% /<br />
Price (€/MWh)<br />
Further Intraday <strong>Trading</strong> info. (BSP website)<br />
Day-Ahead Volumes and Prices<br />
Intraday Daily Volumes<br />
For informational purposes only.
Day-Ahead further Auction info.<br />
Average Hourly Volumes and Prices<br />
Hour (AM) 1 2 3 4 5 6 7 8 9 10 11 12<br />
Volume (MWh) 883 851 840 836 852 871 819 985 980 980 990 1067<br />
Base price (€/MWh) 47,62 42,51 39,38 38,82 38,37 39,57 46,00 53,24 55,27 56,40 54,68 55,01<br />
Hour (PM) 13 14 15 16 17 18 19 20 21 22 23 24<br />
Volume (MWh) 1134 1121 1056 1019 1027 1005 1002 989 1057 1081 1036 911<br />
Daily volatility of base price<br />
Base price (€/MWh) 53,43 52,03 53,05 54,77 56,87 57,04 56,99 58,67 58,77 59,16 54,25 47,99<br />
Cross-Zonal Capacities<br />
SI→IT IT→SI SI→AT AT→SI SI→HR<br />
Offered (MWh) 377.941 469.080 837.792 493.208 719.055 1.512.945 4.410.021<br />
Allocated (MWh) 96.876 132.585 1.453 470.136 353.650 20.160 1.074.860<br />
% Allocated 25,63% 28,26% 0,17% 95,32% 49,18% 1,33%<br />
Daily Volatility of Base Price<br />
HR→SI<br />
Total<br />
Methodology used for calculation of volatility.<br />
MI2 & MI6 Implicit Auctions<br />
Allocated CZC Values on Slovenian-Italian Border<br />
Cross-Zonal-Capacities<br />
SI-IT IT-SI Total<br />
Offered (MWh) 413.651 203.445 617.096<br />
Allocated (MWh) 17.365 13.796 31.161<br />
% Allocated 4,20% 6,78% /<br />
Read more about European Pilot Project<br />
Implicit Intraday Auctions (MI2 & MI6)<br />
Intraday Continuous <strong>Trading</strong><br />
Volumes by Products<br />
For informational purposes only.
Past 12 Months Trade Information<br />
Day-Ahead Auction<br />
Avg. Monthly Volume (MWh) 641.020<br />
Avg. Daily Volume (MWh) 21.075<br />
Avg. Base Price (€/MWh) 54,02<br />
Avg. Euro-Peak Price (€/MWh) 59,35<br />
Avg. SI-IT offered (MWh)/Avg. % Allocated 383.259 / 69,1%<br />
Avg. IT-SI offered (MWh)/Avg.% Allocated 470.122 / 9,0%<br />
Avg. SI-AT offered (MWh)/Avg. % Allocated 796.608 / 3,6%<br />
Avg. AT-SI offered (MWh)/Avg. % Allocated 454.885 / 64,7%<br />
Avg. SI-HR offered (MWh)/Avg. % Allocated 764.586 / 16,0%<br />
Avg. HR-SI offered (MWh)/Avg. % Allocated 1.164.084 / 9,8%<br />
Day-Ahead Market Volumes and Prices<br />
Intraday Continuous <strong>Trading</strong><br />
Avg. Monthly Volume (MWh) 10.308<br />
Avg. Nbr. Of Transactions 365<br />
MI2 & MI6 Implicit Auctions<br />
Avg. Monthly volume MI2 (MWh) 21.285<br />
Avg. Monthly volume MI6 (MWh) 6.672<br />
Avg. SI-IT offered (MWh)/Avg. % Allocated 158.968 / 3,5%<br />
Avg. IT-SI offered (MWh)/Avg.% Allocated 347.453 / 3,1%<br />
Intraday Volumes (MWh)<br />
Total Volume in the past 12 months Continuous ■ MI2 ■ MI6 ■<br />
Aug. 18 11.265 13.680 5.714<br />
Sep. 18 7.132 9.393 3.883<br />
Oct. 18 7.166 11.569 3.888<br />
Nov. 18 8.931 11.143 5.232<br />
Dec. 18 9.184 34.805 8.461<br />
Jan. 19 16.963 45.294 11.469<br />
Feb. 19 18.696 15.475 4.217<br />
250.784<br />
Mar. 19 9.737 10.862 2.265<br />
Apr. 19 9.983 23.972 5.738<br />
129.186<br />
May. 19 10.299 16.901 4.707<br />
78.373 Jun. 19 9.999 23.118 11.256<br />
Jul. 19 9.834 34.572 11.544<br />
Absolute Difference Between MI and Day-Ahead Prices & MI Offered Cross-Zonal Capacities<br />
*Cross-Zonal Capacities not allocated on Day-Ahead Auction are later offered for MI2 and MI6 Auctions.<br />
For informational purposes only.
BSP Energy Exchange LL C<br />
Dunajska 156<br />
SI-1000 Ljubljana<br />
Slovenija<br />
+386 1 620 76 76<br />
+386 1 620 76 77<br />
www.bsp-southpool.com<br />
info@bsp-southpool.com<br />
For informational purposes only.