2018 Annual ParisMoU - Consistent Compliance
During 2018 the Paris MoU continued with its work of inspecting ships on the basis of the relevant instruments of the Memorandum. This annual report contains details of the main work and developments within the Paris MoU for the year. The annexes and tables contain details of the outcome of the inspections carried out by our Member Authorities. The Paris MoU website continues to be a reliable source for information and tools which assist in providing inspection details to its users.
During 2018 the Paris MoU continued with its work of inspecting ships on the basis of the relevant instruments of the Memorandum. This annual report contains details of the main work and developments within the Paris MoU for the year. The annexes and tables contain details of the outcome of the inspections carried out by our Member Authorities. The Paris MoU website continues to be a reliable source for information and tools which assist in providing inspection details to its users.

Create successful ePaper yourself
Turn your PDF publications into a flip-book with our unique Google optimized e-Paper software.
THE PARIS MEMORANDUM OF UNDERSTANDING ON PORT STATE CONTROL<br />
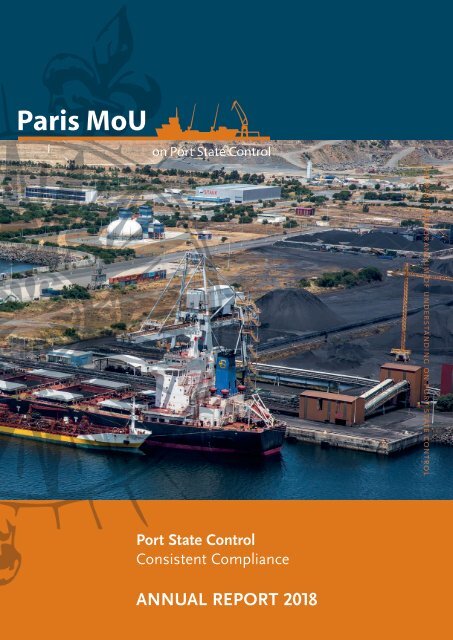
Port State Control<br />
<strong>Consistent</strong> <strong>Compliance</strong><br />
ANNUAL REPORT <strong>2018</strong><br />
ANNUAL REPORT <strong>2018</strong><br />
I
II<br />
PORT STATE CONTROL - CONSISTENT COMPLIANCE
Port State Control<br />
<strong>Consistent</strong> <strong>Compliance</strong><br />
ANNUAL REPORT <strong>2018</strong>
2<br />
PORT STATE CONTROL - CONSISTENT COMPLIANCE
<strong>Annual</strong> Report <strong>2018</strong><br />
CONTENTS<br />
Introduction Chair and Secretary-General 4<br />
Executive summary 6<br />
Paris MoU developments 8<br />
Facts & Figures <strong>2018</strong> 14<br />
Statistical Annexes <strong>Annual</strong> Report <strong>2018</strong> 18<br />
White List 27<br />
Grey List 28<br />
Black List 31<br />
Explanatory note - “White”, “Grey” and “Black list” 56<br />
Secretariat Paris Memorandum of Understanding on Port State Control 57<br />
ANNUAL REPORT <strong>2018</strong><br />
3
PORT STATE CONTROL - CONSISTENT COMPLIANCE<br />
Introduction<br />
CHAIR AND SECRETARY-GENERAL<br />
During <strong>2018</strong> the Paris MoU continued with its<br />
work of inspecting ships on the basis of the<br />
relevant instruments of the Memorandum. This<br />
annual report contains details of the main work<br />
and developments within the Paris MoU for the<br />
year. The annexes and tables contain details of<br />
the outcome of the inspections carried out by<br />
our Member Authorities. The Paris MoU website<br />
continues to be a reliable source for information<br />
and tools which assist in providing inspection<br />
details to its users.<br />
The Paris MoU held its 51st annual Port State Control<br />
Committee meeting in Cascais, Portugal in May <strong>2018</strong>.<br />
The Committee meeting adopted several measures and<br />
took decisions to further improve our port State control<br />
regime. One of the important topics on the agenda was<br />
the further development of the flag and recognized<br />
organization (RO) performance lists. Furthermore, on the<br />
basis of the decisions taken by Ministers in 2017 during<br />
the 3rd Joint Ministerial Conference of Paris and Tokyo<br />
MoU in Vancouver, follow-up actions were initiated to<br />
further reduce the operation of sub-standard ships in<br />
the region. For example, further agreements were made<br />
with regard to the Concentrated Inspection Campaign on<br />
MARPOL Annex VI from September to November <strong>2018</strong> and<br />
the decision was taken to issue a Letter of Warning during<br />
2019 in order to raise awareness with the new Sulphur<br />
requirements that will enter into force in 2020.<br />
The cooperation between the Paris MoU and other regional<br />
agreements on port State control (including the United<br />
States Coast Guard) was further strengthened during<br />
this year. In that regard, we very much value the active<br />
participation of these organisations as observers during<br />
meetings of the Paris MoU, aimed at enhancing mutual<br />
cooperation and harmonisation. Also the constructive<br />
4
cooperation with the International Labour Organization<br />
and the International Maritime Organization is considered<br />
to be highly beneficial to the objectives of the Paris MoU.<br />
During this years’ meeting of the Committee our retiring<br />
Secretary-General Mr. Richard Schiferli supported the<br />
Paris MoU for the last time in this role. The Committee<br />
expressed its appreciation for his contribution to the<br />
objectives of the Paris MoU during his time at the helm of<br />
the Secretariat and wished him fair winds and following<br />
seas in his retirement.<br />
Mr. Schiferli was succeeded by Mr. Luc Smulders, taking<br />
over the role of Secretary-General of the Paris MoU from<br />
the 1st of November <strong>2018</strong>. Mr. Smulders commented: “I am<br />
very much looking forward to assisting and facilitating the<br />
Paris MoU in carrying out its mission. The professionalism<br />
of the Paris MoU as a whole and its positive effect on<br />
responsible shipping off our coasts and in our ports make<br />
me look forward to the future with confidence. And I’m<br />
very glad that Richard Schiferli left behind a Secretariat<br />
that is more than capable to continue delivering its<br />
services to the Paris MoU.”<br />
Mr. Brian Hogan, Chairman of the Paris MoU Committee<br />
concluded: “On behalf of the Committee I wish to thank<br />
Mr. Richard Schiferli for his very significant contribution<br />
and dedication to the Paris MoU. He will be greatly missed<br />
and I would like to wish him well on his retirement.<br />
I welcome Mr. Smulders to the Paris MoU and look forward<br />
to fruitful collaboration in the future.”<br />
The Paris MoU members and bodies continued to positively<br />
contribute to the goals and results of the Organisation.<br />
The European Commission and the European Maritime<br />
Safety Agency (EMSA) were also thanked for their<br />
co-operation and strong working relationship with the<br />
Paris MoU. All members that had hosted events were<br />
thanked in particular.<br />
In conclusion, the Port State Control Officers (PSCOs) and<br />
administrators in the Member Authorities of the Paris MoU<br />
are the people who ensure the success of our endeavours.<br />
They are the ones who are the core of the Paris MoU and<br />
who continue to deliver on our common objectives. They<br />
deserve our special thanks and appreciation.<br />
Brian Hogan<br />
Luc Smulders<br />
Chairman of the Paris MoU Committee<br />
Secretary-General of the Paris MoU<br />
ANNUAL REPORT <strong>2018</strong><br />
5
PORT STATE CONTROL - CONSISTENT COMPLIANCE<br />
Executive SUMMARY<br />
In <strong>2018</strong> there were 24 Refusal of Access<br />
Orders (ban) issued. This shows a decrease<br />
from 32 in 2017. Refusal of access (banning)<br />
has been used 77 times since 2016.<br />
The detention percentage has decreased to<br />
3.15% (from 3.87%). Consequently, the number<br />
of detainable deficiencies has decreased as<br />
well to 3,171 (from 3,883 in 2017). The number<br />
of inspections carried out was 17,952; this is<br />
slightly higher than in 2017 (17,923).<br />
Over the past three years 73 ships have been banned for<br />
multiple detentions and four ships were banned “failing<br />
to call at an indicated repair yard”. Ten ships of these<br />
ships were banned for a second time.<br />
Over a three year period the flags of Comoros, the United<br />
Republic of Tanzania and Togo have recorded the highest<br />
number of bannings.<br />
Looking at the Paris MoU “White, Grey and Black List” the<br />
overall situation regarding the quality of shipping seems<br />
to be stabilising. Although some flag States have moved<br />
between lists, the total amount of 41 flags on the “White<br />
List” is almost similar to that in 2017 (40). The “Grey List”<br />
contains 18 flags (20 in 2017); the “Black List” 14 flags<br />
(13 in 2017).<br />
Recognized Organizations (ROs) are authorised by flag<br />
States to carry out statutory surveys on their behalf. For<br />
this reason, it is important to monitor their performance,<br />
which is why a performance list for ROs is presented in<br />
the <strong>Annual</strong> Report as well. Out of 566 detentions recorded<br />
in <strong>2018</strong>, 97 (17%) were considered RO related (14.3% in<br />
2017).<br />
The number of inspections is stabilising. The detention<br />
percentage in <strong>2018</strong> (3.15%) however shows a significant<br />
decrease compared to 2016 (3.85%) and 2017 (3.87%).<br />
The level of detainable deficiencies has decreased as<br />
well from 3,883 in 2017 to 3,171 this year.<br />
Members with the largest number of inspections, namely<br />
Spain, the United Kingdom, Italy, the Russian Federation,<br />
the Netherlands, Germany and France, jointly accounted<br />
for 52% of the total number of inspections this year.<br />
With 1,098 inspections and 145 detentions the ships<br />
flying a “Black-listed flag” had a detention rate of 13.2%,<br />
which is substantially less than the 16.9% in 2017. For<br />
ships flying a “Grey-listed flag” the detention rate was<br />
6.4%, which is lower than the 7.4% in 2017. Ships flying a<br />
“White-listed flag” had a detention rate of 2.3% which is<br />
slightly less than in 2017 (2.5%) and 2016 (2.6%).<br />
The five most frequently recorded deficiencies in <strong>2018</strong><br />
were “ISM” (4.73%, 1,911), “fire doors/openings in fireresisting<br />
divisions” (2.62%, 1,057), “nautical publications”<br />
(2.01%, 811), “charts” (1.72%, 693) and “oil record book”<br />
(1.64%, 661). The first four are consistent with 2016.<br />
Relatively the total number of the top five has slightly<br />
increased from 12.6% in 2017 to 12.7% this year. •<br />
6
<strong>2018</strong><br />
Three year trend detention %<br />
2016: 3.85% 2017: 3.87% <strong>2018</strong>: 3.15%<br />
Inspection results<br />
17,952<br />
Inspections<br />
9,368<br />
Inspections<br />
with deficiencies<br />
566<br />
Detentions<br />
24<br />
Bannings<br />
Number of White, Grey and Black flags<br />
41<br />
Performance<br />
in number of ROs<br />
High<br />
11<br />
18<br />
Medium<br />
15<br />
14<br />
Top 5 category<br />
of deficiencies<br />
13%<br />
Fire Safety<br />
12.07%<br />
Safety of Navigation<br />
8.17%<br />
Life Saving Appliances<br />
Low<br />
2<br />
Very low<br />
4<br />
7.96%<br />
Labour Conditions - Health protection, medical care,<br />
welfare and social security protection<br />
7.14%<br />
Certificates & Documentation - Documents<br />
ANNUAL REPORT <strong>2018</strong><br />
7
PORT STATE CONTROL - CONSISTENT COMPLIANCE<br />
Paris MoU DEVELOPMENTS<br />
Once a year the Port State<br />
Control Committee, which<br />
is the executive body of the<br />
Paris MoU, meets in one<br />
of the member States. The<br />
Committee considers policy<br />
matters concerning regional<br />
enforcement of port State<br />
control, reviews the work of<br />
the Technical Evaluation Group<br />
and Task Forces and decides<br />
on administrative procedures.<br />
8
The Task Forces, of which 12 were active in <strong>2018</strong>, are<br />
each assigned a specific work programme to investigate<br />
improvement of operational, technical and administrative<br />
port State control procedures. Reports of the Task<br />
Forces are submitted to the Technical Evaluation Group<br />
(TEG) at which all Paris MoU members and observers<br />
are represented. The evaluation of the TEG is submitted<br />
to the Committee for final consideration and decisionmaking.<br />
The MoU Advisory Board (MAB) advises the Port State<br />
Control Committee on matters of a political and strategic<br />
nature, and provides direction to the Task Forces and<br />
Secretariat between meetings of the Committee. The<br />
Board meets several times a year and was composed of<br />
participants from Canada, Iceland, Finland, the United<br />
Kingdom and the European Commission in <strong>2018</strong>.<br />
PORT STATE CONTROL COMMITTEE<br />
The Port State Control Committee held its 51st meeting<br />
in Cascais, Portugal from 7-11 May <strong>2018</strong>. The MoU<br />
comprises 27 member States.<br />
Anticipating the new maximum limits for sulphur in<br />
ships fuel oil, entering into force on 1 January 2020, the<br />
Paris MoU agreed to an information campaign by issuing<br />
a “Letter of Warning” as of 1 January 2019, to encourage<br />
timely compliance. The objective was to send a signal to<br />
the industry that port State control will take enforcement<br />
of the new sulphur limits seriously from “day one”.<br />
The Committee also approved the questionnaire for the<br />
Concentrated Inspection Campaign (CIC) on MARPOL<br />
Annex VI carried out jointly with the Tokyo MoU. The CIC<br />
aims at checking the compliance with requirements for<br />
the prevention of air pollution from ships. The CIC was<br />
carried out from September to November <strong>2018</strong>.<br />
As part of a review of the current inspection regime,<br />
significant progress was made with a new methodology<br />
for calculating flag State and recognized organization<br />
(RO) performance, used for targeting ships for inspection.<br />
The Paris MoU considered the “Ministerial Declaration”<br />
signed during the 3rd Joint Ministerial Conference<br />
between the Paris and Tokyo MoUs held in Vancouver<br />
last year and agreed on a course of action to implement<br />
the decisions.<br />
The results of the 2017 CIC on Safety of Navigation,<br />
including ECDIS (Electronic Chart Display and Information<br />
System) were given great attention by the Committee.<br />
ANNUAL REPORT <strong>2018</strong><br />
9
PORT STATE CONTROL - CONSISTENT COMPLIANCE<br />
The general conclusion was that the results show a good<br />
overall implementation of the requirements on board the<br />
ships inspected, although voyage planning remains an<br />
area of concern.<br />
The Committee adopted the 2017 <strong>Annual</strong> Report, including<br />
the White, Grey and Black List and the performance list<br />
of recognized organizations. The lists were published<br />
in early June and used for targeting purposes from<br />
1 July <strong>2018</strong>.<br />
■ RO responsibility;<br />
■ Information System Developments;<br />
■ Operational controls;<br />
■ Evaluation of Paris MoU Statistics;<br />
■ New inspection policy within the Paris MoU;<br />
■ Training Policy;<br />
■ CIC on Stability (in general) 2020;<br />
■ Policy on (joint) CIC;<br />
■ Guidance on expanded inspections;<br />
■ CIC on Emergency systems (2019) and procedures.<br />
The number of ships which have been refused access<br />
to the Paris MoU region after multiple detentions has<br />
increased from 20 in 2016 to 33 in 2017 and is a threefold<br />
increase over the number in 2015.<br />
On the retirement of the Secretary-General Mr. Richard<br />
Schiferli, Chairman Mr. Brian Hogan thanked him for his<br />
accomplishments over the past 21 years. In this regard<br />
the Committee expressed deep gratitude for the services<br />
of Mr. Schiferli and wished him well on his forthcoming<br />
retirement.<br />
PORT STATE CONTROL TRAINING AND SEMINARS<br />
Over the past years, the training programs have helped<br />
PSCOs from members States, observers and other MoUs<br />
refine and enhance their skills in the application of PSC<br />
procedures. They also increased their understanding of<br />
IMO/ILO conventions and regulations that were the subject<br />
of these training programs.<br />
The basic aim remains to achieve a higher degree of<br />
harmonisation and to standardise inspections throughout<br />
the region.<br />
TECHNICAL EVALUATION GROUP<br />
The TEG convened in Cornwall, Canada in December <strong>2018</strong>.<br />
Task Forces submitted reports to the TEG for evaluation<br />
before submission to the Port State Control Committee.<br />
Issues considered by the TEG included, among others:<br />
The Secretariat organises five different programmes for<br />
Port State Control Officers:<br />
■ Seminars (twice a year);<br />
■ Expert Trainings (twice a year);<br />
■ Specialised Trainings (once a year; Bulk Cargoes in <strong>2018</strong>).<br />
10
SEMINARS<br />
The Seminars are open to members, co-operating<br />
members and observers. The agenda is more topical<br />
than Expert and Specialised Training and deals with<br />
current issues such as inspection campaigns and new<br />
requirements.<br />
issues during this training were new requirements in the<br />
Annexes to the MARPOL Convention, SOLAS life-saving<br />
appliances and the use of Operational Drills during a PSC<br />
inspection. The International Maritime Dangerous Goods<br />
Code (IMDG Code) was also discussed. Participants from<br />
the Black Sea MoU and EMSA took part in the training.<br />
PSC Seminar 65<br />
The 65th Port State Control Seminar was held in<br />
June <strong>2018</strong> in Copenhagen, Denmark. The main topic of<br />
discussion was the train-the-trainer course for the CIC<br />
on MARPOL Annex VI. EMSA presented the first version of<br />
the Distance Learning Package for the CIC. Furthermore,<br />
Paris MoU procedures and specific inspection issues<br />
were discussed. The Secretariat presented an overview of<br />
developments in the Paris MoU. EMSA gave a presentation<br />
on the developments in EMSA and the EU.<br />
PSC Seminar 66<br />
The 66th Port State Control Seminar was held in November<br />
<strong>2018</strong> in Brussels, Belgium. PSCOs from the Paris MoU<br />
member States and Co-operating Member Montenegro<br />
attended the Seminar. The main topics of discussion were<br />
the developments on the CIC on MARPOL Annex VI, ECDIS<br />
and Integrated Bridge Communication systems.<br />
The 6th Specialized Training on the Inspection of Bulk<br />
Cargoes<br />
The sixth Specialized Training programme on the<br />
inspection of Bulk Cargoes was held in The Hague, in<br />
April <strong>2018</strong>. Participants from the Paris MoU members<br />
States as well as Montenegro, the Mediterranean<br />
MoU and EMSA took part in the training. Specific<br />
requirements for the construction of Bulk Carriers, next<br />
to specific certification, were discussed Also the specific<br />
requirements when Bulk Cargo ships are subject to an<br />
expanded were discussed.<br />
"Ongoing improvements and performance<br />
measurement through inspection results<br />
require strict adherence to the established<br />
procedures."<br />
The Secretariat presented an overview of developments<br />
in the Paris MoU and presented cases on several subjects<br />
for discussion. EMSA presented an overview of the<br />
developments within EMSA and the EU.<br />
EXPERT AND SPECIALIZED TRAINING<br />
For the Expert Training, the central themes are “The<br />
Human Element” and “Safety and Environment”. The<br />
theme of the Specialized Training changes every year.<br />
The training programmes are intended for experienced<br />
PSCOs. Using that experience, the participants can work<br />
together to establish a higher degree of harmonisation and<br />
standardisation of their inspection practice. Lecturers for<br />
the training programmes are invited from the Paris MoU<br />
Authorities and the maritime industry.<br />
Expert and Specialized Training aim to promote a higher<br />
degree of professional knowledge and harmonisation of<br />
more complex port State control issues and procedures.<br />
Since 2012 the IMO has been sponsoring PSCOs from<br />
other PSC agreements to attend the Paris MoU Expert<br />
training programmes.<br />
The 18th Expert Training “The Human Element”<br />
The eighteenth Expert Training programme on the Human<br />
Element was held in The Hague, the Netherlands in<br />
October <strong>2018</strong>. The programme was dedicated to the<br />
MLC 2006 and STCW Convention. As an introduction to<br />
the program, the participants were asked to complete<br />
a questionnaire providing insight into to their personal<br />
“enforcement style”. A lecturer from the CSmart Academy<br />
gave a lecture on Bridge / Engine Room Resource<br />
Management. At the end of the program, a communication<br />
and interaction exercise was conducted. Participants<br />
from member States, from the Co-operating Member<br />
Montenegro and from several MoUs took part in the<br />
training.<br />
TRAINING IN COOPERATION WITH EMSA<br />
The Paris MoU also assists EMSA in the “PSC Seminar<br />
for Port State Control Officers”. The PSC Seminars are<br />
delivered to PSCOs from all Member States. In <strong>2018</strong> the<br />
fully established Professional Development Scheme (PDS)<br />
for PSCOs of the Paris MoU encompassed 4 Seminars for<br />
PSCOs.<br />
The 14th Expert Training “Safety and Environment”<br />
The fourteenth Expert Training programme was held in<br />
The Hague, the Netherlands, in March <strong>2018</strong>. Important<br />
The Paris MoU inspection regime focuses on eradication of<br />
sub-standard shipping and on rewarding good performing<br />
ships in terms of the inspection frequency. It translates<br />
ANNUAL REPORT <strong>2018</strong><br />
11
PORT STATE CONTROL - CONSISTENT COMPLIANCE<br />
to “less, but higher quality inspections”. The regime is<br />
underpinned by an elaborate set of procedures, all aimed<br />
at providing more guidance for better inspections.<br />
Ongoing improvements and performance measurement<br />
through inspection results require strict adherence to<br />
the established procedures. For the seminars organised<br />
for PSCOs during <strong>2018</strong> the earlier adopted approach was<br />
followed in order to maximize familiarisation with the<br />
procedures governing port State control inspections.<br />
The overarching goal for the seminars remained the<br />
establishment of a harmonized approach towards Port<br />
State Control in the geographical working area of the<br />
Paris MoU. Feedback sessions with participants during<br />
the seminars indicated that indeed a wider understanding<br />
of the procedures and the available tools such as the<br />
Paris MoU manual, RuleCheck and the distance learning<br />
modules, had been achieved. The constantly evolving<br />
methodology of delivering the lectures during the<br />
seminars is deemed effective in achieving the objectives<br />
set for the seminars.<br />
"To increase public awareness of unsafe<br />
ships, particularly serious port State control<br />
detentions are published under the heading<br />
‘Caught in the Net’."<br />
All seminars were organised by EMSA and held at its<br />
premises in Lisbon, Portugal. Lecturers were provided<br />
both by EMSA and the Paris MoU Secretariat. The<br />
154 participants attending these seminars during <strong>2018</strong><br />
originated from all Paris MoU Member States.<br />
The other four cases met the criteria for the Detention<br />
Review Panel and were submitted to MoU members for<br />
review. In one case the detention review panel concluded<br />
that the port State’s decision to detain was not justified.<br />
On request of the panel, the port State reconsidered the<br />
detention. In the two other cases the panel concluded that<br />
the detaining port State would not have to reconsider the<br />
decision to detain.<br />
PARIS MOU ON THE INTERNET<br />
The Paris MoU Secretariat is constantly improving the<br />
accessibility of information on the website. Since the end<br />
of <strong>2018</strong> the website is hosted by another provider that has<br />
a more customer-centric approach.<br />
Inspection search, current detentions, current bannings<br />
and publications are in the top 5 of most popular web<br />
pages of <strong>2018</strong>. Popular pages (inspection search &<br />
current detentions) are embedded pages made available<br />
by courtesy of EMSA.<br />
Flag and port States, government agencies, charterers,<br />
insurers and classification societies are continuously<br />
looking for data and information. They were able to<br />
monitor their performance and the performance of<br />
others on a continuous basis. Validated port State control<br />
data can be accessed and offers visitors more detailed<br />
information.<br />
To increase public awareness of unsafe ships, particularly<br />
serious port State control detentions are published under<br />
the heading ‘Caught in the Net’. These detentions are<br />
described in detail and illustrated with photographs. In<br />
<strong>2018</strong> the details of only one ship were published:<br />
■ General cargo ship “MISTRAL”, flag Turkey (IMO 9045651).<br />
DETENTION REVIEW PANEL<br />
Flag States or ROs that cannot resolve a dispute<br />
regarding a detention with the port State may submit<br />
their case for review. The detention review panel consists<br />
of representatives from four different MoU member<br />
Authorities, on a rotating basis, and the Secretariat.<br />
In <strong>2018</strong> the Secretariat received seven requests for<br />
review. One case was withdrawn during the process of<br />
gathering the information to be provided to the panel. Two<br />
cases could not be accepted because a national appeal<br />
had been lodged.<br />
Other information of interest such as monthly detention<br />
lists, annual reports, performance lists and news items<br />
can be downloaded from our website: www.parismou.org<br />
CONCENTRATED INSPECTION CAMPAIGNS<br />
Concentrated Inspection Campaigns (CICs) have been<br />
held annually in the Paris MoU region over the past years.<br />
These campaigns focus on a particular area of compliance<br />
with international regulations with the aim of raising<br />
awareness, gathering information and enforcing the level<br />
of compliance. Each campaign is prepared by experts and<br />
identifies a number of specific items for inspection.<br />
12
CIC <strong>2018</strong> MARPOL ANNEX VI<br />
PSCOs in the Paris MoU region have performed a<br />
Concentrated Inspection Campaign (CIC) on MARPOL<br />
Annex VI from 1 September through 30 November <strong>2018</strong>.<br />
Campaign (CIC) on Safety of Navigation, including ECDIS;<br />
and information on the improvement of flag performance.<br />
In general the results of the CIC indicate that the elements<br />
inspected during the CIC show a proper implementation of<br />
the requirements on board ships.<br />
Results show that 4,021 inspections have been performed<br />
using the CIC questionnaire. Of those inspections<br />
7 detentions (0.2%) have CIC topic related deficiencies.<br />
The total number of detentions in the three month period<br />
was 131.<br />
CO-OPERATION WITH OTHER ORGANIZATIONS<br />
The strength of regional regimes of port State control,<br />
which are bound by geographical circumstances and<br />
interests, is widely recognised. Nine regional MoUs have<br />
been established.<br />
In order to provide co-operation to these MoUs, they may<br />
apply for observer status. Regional agreements seeking<br />
observer status must demonstrate that their member<br />
Authorities invest demonstrably in training of PSCOs,<br />
publish inspection data, have a code of good practice,<br />
have been granted official IGO-status at IMO and have a<br />
similar approach in terms of commitment and goals to<br />
that of the Paris MoU.<br />
All regional agreements have obtained official observer<br />
status to the Paris MoU: the Tokyo MoU, Caribbean MoU,<br />
Mediterranean MoU, Black Sea MoU, Riyadh MoU, Acuerdo<br />
de Viña del Mar, Abuja MoU and Indian Ocean MoU.<br />
The United States Coast Guard is also an observer at<br />
Paris MoU meetings.<br />
The International Labour Organization and the International<br />
Maritime Organization have participated in the<br />
meetings of the Paris MoU on a regular basis since 1982.<br />
In 2006 the Paris MoU obtained official status at the IMO<br />
as an Inter-Governmental Organization. A delegation<br />
of the MoU participated in the 5th session of the Sub-<br />
Committee on Implementation of IMO Instruments (III-5)<br />
in September <strong>2018</strong>.<br />
MEMBERSHIP OF THE PARIS MOU<br />
In preparation for prospective new members of the Paris<br />
MoU, the Port State Control Committee has adopted<br />
criteria for co-operating status for non-member States<br />
and observer status for other PSC regions.<br />
Specific criteria, including a self-evaluation exercise, have<br />
to be fulfilled before co-operating status can be granted.<br />
In 2011 the maritime Authority of Montenegro joined the<br />
MoU as a co-operating member with the prospect of<br />
becoming a full member in the future.<br />
The Paris MoU currently has 8 members with dual or<br />
even triple membership: both Canada and the Russian<br />
Federation are also members of the Tokyo MoU, while<br />
the Russian Federation is also a member of the Black Sea<br />
MoU. With Bulgaria and Romania there are further ties with<br />
the Black Sea MoU. Malta and Cyprus are also members of<br />
the Mediterranean MoU. France and the Netherlands are<br />
members of the Caribbean MoU, whilst France is also a<br />
member of the Indian Ocean MoU. •<br />
Submitted to III-5 were: the 2017 <strong>Annual</strong> Report including<br />
inspection data; the performance of flag Administrations<br />
and Recognized Organizations; a combined list of flags<br />
targeted by the Paris MoU, Tokyo MoU and USCG in 2017;<br />
the results of the 2017 joint Concentrated Inspection<br />
ANNUAL REPORT <strong>2018</strong><br />
13
PORT STATE CONTROL - CONSISTENT COMPLIANCE<br />
Facts & Figures <strong>2018</strong><br />
In the following pages the facts and figures of <strong>2018</strong> are listed.<br />
The detention percentage of 3.15% in <strong>2018</strong> has significantly<br />
decreased compared to the 3.87% in 2017. The number of ships<br />
that received a refusal of access (banning) order has decreased<br />
from 32 in 2017 to 24 this year.<br />
14
INSPECTIONS<br />
With a total number of 17,952 inspections performed in<br />
<strong>2018</strong>, the inspection figures are almost similar to 2017<br />
(17,923). The average of number of inspections per ship of<br />
1.17 times per year equals that of 2017.<br />
DEFICIENCIES<br />
The number of deficiencies over the past 3 years has<br />
been: 42,131 (2016); 41,125 (2017) and 40,368 (<strong>2018</strong>). The<br />
percentage of inspections performed with one or more<br />
deficiencies recorded, remained constant: 52% (2016),<br />
52% (2017) and 52% (<strong>2018</strong>).<br />
The average number of deficiencies per inspection of 2.3<br />
is the same as in 2017.<br />
DETAINABLE DEFICIENCIES<br />
After two years of stabilising detainable deficiencies<br />
(3,896 in 2016; 3,883 in 2017), <strong>2018</strong> shows a significant<br />
decrease to 3,171. A relative minus of more than 18%.<br />
one. Lithuania and the Russian Federation have entered<br />
the “White List” while Saudi Arabia has dropped to the<br />
“Grey List”.<br />
Flags with an average performance are shown on the<br />
“Grey List”. Their appearance on this list may serve as an<br />
incentive to improve and move to the “White List”. At the<br />
same time flags at the lower end of the “Grey List” should<br />
be careful not to neglect control over their ships and risk<br />
ending up on the “Black List” next year.<br />
On this year’s “Grey List” a total number of 18 flags is<br />
recorded. Last year the “Grey List” recorded 20 flags.<br />
New on the “Grey List” is the already mentioned flag of<br />
Saudi Arabia. Vanuatu has entered the “Grey List” from<br />
the “Black List”. Bulgaria has become a non-listed flag.<br />
The flag of Albania has dropped to the Black-listed flag.<br />
New on the performance list and to the "Black list" is<br />
Mongolia.<br />
DETENTIONS<br />
Some deficiencies are clearly hazardous to safety, health<br />
or the environment and the ship is detained until they are<br />
rectified. Detention rates are expressed as a percentage<br />
of the number of inspections, rather than the number of<br />
individual ships inspected to take account of the fact that<br />
some ships are detained more than once a year.<br />
Compared to 2017, the number of detentions has decreased<br />
significantly from 693 to 566 detentions; a decrease of<br />
about 18%. Where the average detention rate in 2017 was<br />
still 3.87%, in <strong>2018</strong> it dropped to 3.15%.<br />
A graph of the distribution of listed and non-listed flags<br />
indicates that only 0.8% of the ships inspected are from<br />
flags not listed on the WGB list.<br />
SHIP TYPE<br />
In <strong>2018</strong> the top 5 detention rates were: general cargo/<br />
multipurpose ships at 6.3% (up from 4.8% in 2017); other<br />
at 5.9% (from 4.8% in 2017); heavy load (4.1% similar to<br />
4.3%), refrigerated cargo at 3.4% (up from 1.7%) and tug at<br />
3.3% (up from 1.6%).<br />
“WHITE, GREY AND BLACK LIST”<br />
The “White, Grey and Black (WGB) List” presents the<br />
full spectrum, from quality flags to flags with a poor<br />
performance that are considered high or very high risk. It<br />
is based on the total number of inspections and detentions<br />
over a 3-year rolling period for flags with at least<br />
30 inspections in the period.<br />
Regarding the “White, Grey and Black List” for <strong>2018</strong>, a<br />
total number of 73 flags are listed: 41 on the “White List”,<br />
18 on the “Grey List” and 14 on the “Black List”. In 2017 the<br />
total number of flag States on the list was also 73 of which<br />
40 on the “White List”, 20 on the “Grey List” and 13 on the<br />
“Black List”.<br />
The “White List” represents quality flags with a<br />
consistently low detention record. Compared to 2017, the<br />
number of flags on the “White List” has increased with<br />
"The detention percentage has decreased<br />
to 3.15% (from 3.87%)."<br />
ANNUAL REPORT <strong>2018</strong><br />
15
PORT STATE CONTROL - CONSISTENT COMPLIANCE<br />
PERFORMANCE OF RECOGNIZED ORGANIZATIONS<br />
For several years the Committee has closely monitored<br />
the performance of ROs acting on behalf of flags.<br />
To calculate the performance of the Recognized<br />
Organizations, the same formula to calculate the excess<br />
factor of the flags is used. A minimum number of<br />
60 inspections per RO is needed before the performance<br />
is taken into account for the list. In <strong>2018</strong> 32 ROs were<br />
recorded on the performance list.<br />
Compared with last year’s performance level, the level<br />
of RO performance is similar, with 4 ROs in the very low<br />
performing parts.<br />
Details of the responsibility of Recognized Organizations<br />
for detainable deficiencies have been published since 1999.<br />
When one or more detainable deficiencies are attributed<br />
to a Recognized Organization in accordance with the Paris<br />
MoU criteria, it is recorded “RO responsible” and the RO is<br />
informed. Out of 566 detentions recorded in <strong>2018</strong>, 97 (17%)<br />
were considered RO related (14.3% in 2017).<br />
REFUSAL OF ACCESS OF SHIPS<br />
A total of 24 ships were refused access (banned) from<br />
the Paris MoU region in <strong>2018</strong>. 22 for reasons of multiple<br />
detentions, 2 for failing to call at an indicated repair yard.<br />
A number of ships remain banned from previous years.<br />
Several ships have been banned a second time after<br />
multiple detentions, resulting in a minimum banning<br />
period of 12 months. The total number of 24 is down from<br />
32 in 2017.<br />
DEFICIENCIES PER MAIN CATEGORY<br />
The number of deficiencies in the following six areas<br />
accounted for approximately 68% of the total number of<br />
deficiencies. The trends in these areas are clarified below.<br />
Certificates & Documentation<br />
The number of deficiencies recorded as related to ships’<br />
certificates, crew certificates and documents show<br />
a decrease from 6,745 in 2017 to 6,275 in <strong>2018</strong>. The<br />
relative part regarding the total deficiencies has dropped<br />
accordingly from 16.4% in 2017 to 15.5% in <strong>2018</strong>.<br />
Fire safety<br />
In <strong>2018</strong> deficiencies in fire safety accounted for 13% of<br />
all deficiencies recorded, similar to 2017. Although the<br />
percentage is stabilising, there is a slight further decrease<br />
in the number of deficiencies that were recorded: from<br />
5,409 in 2016 via 5,385 in 2017 to 5,248 in <strong>2018</strong>.<br />
Pollution prevention<br />
The total number of deficiencies recorded in the<br />
several pollution prevention areas in <strong>2018</strong> were 2,973.<br />
The increase in the number of deficiencies compared<br />
to 2017 (2,025 deficiencies) can be explained by the<br />
new requirements resulting from the Ballast Water<br />
Management Convention. The share of deficiencies in the<br />
several pollution prevention areas compared to the total<br />
number of deficiencies was 7.4% in <strong>2018</strong>, while in 2017<br />
this share was only 4.9%.<br />
Working and living conditions<br />
Most deficiencies on working and living conditions (MLC<br />
2006, areas table) have been found in the following areas.<br />
Health and safety and accident prevention (area 11) 3,090<br />
(41.8% of all MLC deficiencies); food and catering (area<br />
10) 1,260 (17.1%); hours of work and rest (area 6) 628<br />
(8.5%); accommodation (area 8) 639 (8.6%) and seafarer’s<br />
employment agreements (area 4) 554 (7.5%) deficiencies.<br />
The percentage of deficiencies regarding working and<br />
living conditions, related to the total of deficiencies is<br />
14.9%. A decrease from 15.5% in 2017 and 16.1% in 2016.<br />
The total number of deficiencies in <strong>2018</strong> was 6,006, a<br />
decrease from 6,372 in 2017.<br />
Safety Management<br />
The number of ISM related deficiencies has increased in<br />
<strong>2018</strong> to 1,911. 2017 shows 1,787, 2016 recordings were<br />
1,855. The percentage regarding the total deficiencies<br />
has increased from 4.3% in 2017 to 4.7% in <strong>2018</strong>. •<br />
Safety of Navigation<br />
In <strong>2018</strong>, deficiencies in Safety of Navigation accounted for<br />
12.1% of all deficiencies recorded. The decrease related<br />
to 2017 when the deficiencies were 13.6%, is probably<br />
due to the CIC Safety on Navigation held in 2017. The<br />
number of deficiencies in Safety of Navigation decreased<br />
from 5,611 in 2017 to 4,874 in <strong>2018</strong>.<br />
16
ANNUAL REPORT <strong>2018</strong><br />
17
18<br />
PORT STATE CONTROL - CONSISTENT COMPLIANCE
STATISTICAL ANNEXES<br />
THE PARIS MEMORANDUM OF UNDERSTANDING ON PORT STATE CONTROL<br />
Port State Control<br />
Safeguarding Responsible<br />
and Sustainable Shipping<br />
ANNUAL REPORT <strong>2018</strong><br />
ANNUAL REPORT <strong>2018</strong><br />
ANNUAL REPORT <strong>2018</strong><br />
19
PORT STATE CONTROL - CONSISTENT COMPLIANCE<br />
BASIS PORT STATE CONTROL FIGURES <strong>2018</strong><br />
NUMBER OF INDIVIDUAL SHIPS<br />
INSPECTED<br />
16,000<br />
14,000<br />
14,753<br />
14,762<br />
15,268<br />
14,646<br />
14,108<br />
15,386<br />
15,255<br />
15,237<br />
15,356<br />
15,301<br />
12,000<br />
10,000<br />
8,000<br />
6,000<br />
4,000<br />
2,000<br />
0<br />
2009 2010 2011 2012 2013 2014 2015 2016 2017<br />
<strong>2018</strong><br />
NUMBER OF INSPECTIONS<br />
25,000<br />
24,186<br />
24,058<br />
20,000<br />
19,058<br />
18,308<br />
17,687<br />
18,447<br />
17,878<br />
17,845<br />
17,923<br />
17,952<br />
15,000<br />
10,000<br />
5,000<br />
0<br />
2009 2010 2011 2012 2013 2014 2015 2016 2017 <strong>2018</strong><br />
NUMBER OF DETENTIONS<br />
1,200<br />
1,000<br />
800<br />
600<br />
1,059<br />
790<br />
688<br />
669<br />
668<br />
623<br />
611<br />
687<br />
693<br />
566<br />
400<br />
200<br />
0<br />
2009 2010 2011 2012 2013 2014 2015 2016 2017 <strong>2018</strong><br />
Note: The cut-off date for inspection data to be included in the <strong>Annual</strong> Report <strong>2018</strong> was 19-02-2019. Changes to<br />
inspection data after this date have as a rule not been taken into account. Due to PSCC50 decision the <strong>Annual</strong> Report data<br />
will, from now on, include the current annual year and all amended data in previous years back to 3 calender years.<br />
20
NUMBER OF DEFICIENCIES<br />
AND DETAINABLE DEFICIENCIES<br />
80,000<br />
70,000<br />
60,000<br />
50,000<br />
40,000<br />
71,911<br />
64,698<br />
50,738<br />
Number of deficiencies<br />
49,261<br />
49,074<br />
46,224<br />
Number of detainable deficiencies<br />
41,820<br />
42,131<br />
41,125<br />
40,368<br />
30,000<br />
20,000<br />
10,000<br />
0<br />
5,451<br />
3,866<br />
3,080<br />
2,882<br />
3,231<br />
3,155<br />
3,541<br />
3,896<br />
3,883<br />
3,171<br />
2009 2010 2011 2012 2013 2014 2015 2016 2017 <strong>2018</strong><br />
DETENTIONS IN<br />
% OF INSPECTIONS<br />
4.50%<br />
4.00%<br />
3.50%<br />
3.00%<br />
4.38%<br />
3.28%<br />
3.61%<br />
3.65%<br />
3.78%<br />
3.38%<br />
3.42%<br />
3.85%<br />
3.87%<br />
3.15%<br />
2.50%<br />
2.00%<br />
1.50%<br />
1.00%<br />
0.50%<br />
0.00%<br />
2009 2010 2011 2012 2013 2014 2015 2016 2017 <strong>2018</strong><br />
35<br />
32<br />
NUMBER OF REFUSAL<br />
OF ACCESS<br />
30<br />
25<br />
30<br />
24<br />
20<br />
21<br />
21<br />
21<br />
15<br />
14<br />
12<br />
10<br />
11<br />
5<br />
0<br />
5<br />
2009 2010 2011 2012 2013 2014 2015 2016 2017 <strong>2018</strong><br />
Note: The New Inspection Regime entered into force on the 1st of January 2011. Consequently the targeting of ships for<br />
inspection has changed; inspection figures from 2011 onwards should not be compared to the ones from 2010 and before.<br />
ANNUAL REPORT <strong>2018</strong><br />
21
PORT STATE CONTROL - CONSISTENT COMPLIANCE<br />
INSPECTION EFFORTS <strong>2018</strong><br />
HRS, SRS AND LRS INSPECTIONS PER MEMBER STATE<br />
1,600<br />
High Risk Ship Inspection Standard Risk Ship Inspection Low Risk Ship Inspection Ship Risk Profile unknown<br />
1,400<br />
1,200<br />
1,000<br />
800<br />
600<br />
400<br />
200<br />
0<br />
Belgium<br />
Bulgaria<br />
COMMITMENT<br />
Canada<br />
Croatia<br />
Cyprus<br />
Denmark<br />
Estonia<br />
Finland<br />
France<br />
Germany<br />
Greece<br />
Iceland<br />
Ireland<br />
Italy<br />
Latvia<br />
Lithuania<br />
Malta<br />
Netherlands<br />
Norway<br />
Poland<br />
Portugal<br />
Romania<br />
Russian Fed.<br />
Slovania<br />
Spain<br />
Sweden<br />
United Kingdom<br />
1,800<br />
1,600<br />
1,400<br />
1,200<br />
1,000<br />
800<br />
600<br />
400<br />
200<br />
0<br />
Inspections relevant for commitment<br />
Commitment<br />
Belgium<br />
Bulgaria<br />
Canada<br />
Croatia<br />
Cyprus<br />
Denmark<br />
Estonia<br />
Finland<br />
France<br />
Germany<br />
Greece<br />
Iceland<br />
Ireland<br />
Italy<br />
Latvia<br />
Lithuania<br />
Malta<br />
Netherlands<br />
Norway<br />
Poland<br />
Portugal<br />
Romania<br />
Russian Fed.<br />
Slovenia<br />
Spain<br />
Sweden<br />
United Kingdom<br />
Inspections<br />
989<br />
330<br />
1009<br />
340<br />
113<br />
471<br />
205<br />
265<br />
1050<br />
1090<br />
978<br />
64<br />
266<br />
1362<br />
301<br />
225<br />
196<br />
1266<br />
561<br />
490<br />
514<br />
533<br />
1351<br />
137<br />
1530<br />
505<br />
1459<br />
Commitment<br />
972<br />
253<br />
531<br />
183<br />
100<br />
449<br />
247<br />
260<br />
1027<br />
938<br />
559<br />
63<br />
260<br />
971<br />
368<br />
288<br />
152<br />
1258<br />
541<br />
454<br />
514<br />
333<br />
730<br />
133<br />
1387<br />
497<br />
1590<br />
Note: The number of inspectons relevant for the commitment of MoU Port States differs from the total number of inspections<br />
used in other graphs and tables due to different dates of extraction.<br />
22
INSPECTION EFFORTS OF MEMBERS AS PERCENTAGE OF PARIS MOU TOTAL<br />
UNITED KINGDOM 8.35%<br />
SWEDEN 3.19%<br />
BELGIUM 5.51%<br />
BULGARIA 1.83%<br />
CANADA 5.69%<br />
SPAIN 8.67%<br />
SLOVENIA 0.76%<br />
CROATIA 1.90%<br />
CYPRUS 0.64%<br />
DENMARK 2.75%<br />
ESTONIA 1.17%<br />
FINLAND 1.57%<br />
RUSSIAN FEDERATION 7.58%<br />
FRANCE 5.97%<br />
ROMANIA 2.97%<br />
GERMANY 6.32%<br />
PORTUGAL 2.86%<br />
POLAND 2.82%<br />
NORWAY 3.17%<br />
GREECE 5.47%<br />
ICELAND 0.35%<br />
IRELAND 1.59%<br />
NETHERLANDS 7.12%<br />
ITALY 7.69%<br />
MALTA 1.09%<br />
LITHUANIA 1.29% LATVIA 1.69%<br />
ANNUAL REPORT <strong>2018</strong><br />
23
PORT STATE CONTROL - CONSISTENT COMPLIANCE<br />
MOU PORT STATES’S INDIVIDUAL CONTRIBUTIONS TO<br />
THE TOTAL AMOUNT OF INSPECTIONS<br />
<strong>ParisMoU</strong><br />
Authority<br />
Total nr of<br />
Inspections<br />
Inspections with<br />
deficiencies<br />
Inspections with<br />
detentions<br />
Inspections with RO<br />
related detainable<br />
deficiencies<br />
% Inspections with<br />
deficiencies<br />
% Detentions<br />
% Inspection of MoU<br />
total<br />
% HRS<br />
% SRS<br />
% LSR<br />
% SRP Unknown<br />
Belgium 989 510 28 4 51.6 2.8 5.5 2.0 89.7 7.3 1.0<br />
Bulgaria 329 229 16 3 69.6 4.9 1.8 27.1 68.7 0.0 4.3<br />
Canada 1,022 431 19 1 42.2 1.9 5.7 2.5 84.4 5.7 7.3<br />
Croatia 341 190 11 2 55.7 3.2 1.9 14.4 76.8 7.0 1.8<br />
Cyprus 114 83 7 3 72.8 6.1 0.6 8.8 79.8 1.8 9.6<br />
Denmark 493 269 6 1 54.6 1.2 2.7 1.6 88.2 7.5 2.6<br />
Estonia 210 73 0 0 34.8 0.0 1.2 4.3 86.7 6.7 2.4<br />
Finland 282 50 0 0 17.7 0.0 1.6 0.7 85.1 11.0 3.2<br />
France 1,072 518 35 0 48.3 3.3 6.0 5.9 86.5 4.4 3.3<br />
Germany 1,134 594 36 9 52.4 3.2 6.3 2.3 86.5 7.9 3.3<br />
Greece 982 529 42 7 53.9 4.3 5.5 17.8 73.3 0.9 7.9<br />
Iceland 63 31 1 0 49.2 1.6 0.4 1.6 92.1 1.6 4.8<br />
Ireland 285 144 9 0 50.5 3.2 1.6 4.2 89.5 4.6 1.8<br />
Italy 1,381 726 60 14 52.6 4.3 7.7 7.9 86.5 1.6 4.0<br />
Latvia 303 116 3 0 38.3 1.0 1.7 2.0 87.5 8.9 1.7<br />
Lithuania 231 89 0 0 38.5 0.0 1.3 2.6 89.2 6.9 1.3<br />
Malta 196 75 6 2 38.3 3.1 1.1 1.5 93.4 0.0 5.1<br />
Netherlands 1,278 730 28 1 57.1 2.2 7.1 2.7 87.0 2.7 7.6<br />
Norway 569 282 8 0 49.6 1.4 3.2 1.6 88.2 6.7 3.5<br />
Poland 507 348 26 2 68.6 5.1 2.8 3.0 91.1 3.7 2.2<br />
Portugal 514 105 9 2 20.4 1.8 2.9 4.5 85.6 6.0 3.9<br />
Romania 533 394 28 4 73.9 5.3 3.0 31.7 64.2 0.2 3.9<br />
Russian Federation* 1,360 1,015 103 34 74.6 7.6 7.6 26.3 68.4 4.6 0.7<br />
Slovenia 136 66 1 0 48.5 0.7 0.8 8.1 83.1 4.4 4.4<br />
Spain 1,556 698 33 4 44.9 2.1 8.7 7.5 83.5 2.6 6.4<br />
Sweden 573 217 11 0 37.9 1.9 3.2 2.1 82.7 12.4 2.8<br />
United Kingdom 1,499 856 40 4 57.1 2.7 8.4 3.2 88.2 4.3 4.3<br />
Total 17,952 9,368 566 97 52.2 3.2 100.0 7.9 83.4 4.6 4.1<br />
*For the Russian Federation only inspections in the ports of the Baltic, Azov, Caspian and Barents Sea are included.<br />
24
CURRENT DETENTIONS AS PER 31-12-<strong>2018</strong> PER PORT STATE AUTHORITY SINCE 2011<br />
Excluded detentions <strong>Annual</strong> figures 2011 - <strong>2018</strong><br />
Interval<br />
Detaining Authority < 12 Months > 12 Months<br />
Belgium - 1<br />
Bulgaria 1 1<br />
Canada - 3<br />
Greece 4 7<br />
Ireland - 1<br />
Italy - 3<br />
Malta - 1<br />
Netherlands - 3<br />
Poland - 1<br />
Spain - 5<br />
United Kingdom 2 -<br />
Norway 2 -<br />
Iceland 1 -<br />
Grand Total 10 26<br />
Flag < 12 Months > 12 Months<br />
Bolivia - 2<br />
Congo, the Democratic Republic of the - 1<br />
Cook Islands - 1<br />
Honduras - 1<br />
Indonesia - 1<br />
Malta - 4<br />
Moldova, Republic of - 3<br />
Palau 1 1<br />
Panama 1 4<br />
Portugal - 1<br />
Russian Federation 1 2<br />
Saint Vincent and the Grenadines - 1<br />
Tanzania, United Republic of - 2<br />
Togo 2 -<br />
Turkey - 1<br />
Ukraine - 1<br />
Samoa 1 -<br />
Syrian Arab Republic 1 -<br />
Cape Verde 1 -<br />
Bahamas 1 -<br />
Iceland 1 -<br />
Grand Total 10 26<br />
Full details on all currently detained ships in the Paris MoU region is available on the Paris MoU website.<br />
ANNUAL REPORT <strong>2018</strong><br />
25
26<br />
PORT STATE CONTROL - CONSISTENT COMPLIANCE
WHITE LIST<br />
RANK<br />
FLAG<br />
INSPECTIONS<br />
2016-<strong>2018</strong><br />
DETENTIONS<br />
2016-<strong>2018</strong><br />
BLACK TO<br />
GREY LIMIT<br />
GREY TO<br />
WHITE LIMIT<br />
EXCESS<br />
FACTOR<br />
WHITE LIST<br />
1 Isle of Man (UK) 651 5 57 34 -1.80<br />
2 Bahamas 2,207 27 175 134 -1.78<br />
3 Singapore 1,925 24 154 116 -1.76<br />
4 France 279 1 27 12 -1.75<br />
5 United Kingdom 1,154 13 96 66 -1.74<br />
6 Netherlands 2,978 44 232 185 -1.71<br />
7 Marshall Islands 4,248 66 325 270 -1.70<br />
8 Cayman Islands (UK) 480 4 43 24 -1.70<br />
9 Norway 1,489 21 121 88 -1.66<br />
10 Hong Kong, China 1,983 30 158 120 -1.66<br />
11 Denmark 1,232 18 101 71 -1.62<br />
12 Germany 550 7 49 28 -1.54<br />
13 Luxembourg 199 1 20 8 -1.51<br />
14 Japan 133 0 15 4 -1.51<br />
15 Ireland 130 0 14 4 -1.49<br />
16 Sweden 299 3 29 13 -1.46<br />
17 Liberia 4,206 96 322 267 -1.44<br />
18 Italy 1,039 20 87 59 -1.41<br />
19 Gibraltar (UK) 675 12 59 36 -1.38<br />
20 Malta 4,680 117 357 298 -1.37<br />
21 Belgium 221 2 22 9 -1.36<br />
22 Cyprus 1,964 47 157 118 -1.32<br />
23 Greece 876 19 74 48 -1.28<br />
24 Bermuda (UK) 244 3 24 10 -1.25<br />
25 Estonia 87 0 11 2 -0.98<br />
26 China 161 2 17 5 -0.96<br />
27 Portugal 958 30 81 54 -0.92<br />
28 Barbados 358 10 34 17 -0.74<br />
29 Antigua and Barbuda 2,581 108 202 159 -0.70<br />
30 Latvia 99 1 12 2 -0.63<br />
31 Finland 425 14 39 21 -0.61<br />
32 Turkey 1,047 42 87 59 -0.61<br />
33 Philippines 146 3 16 5 -0.51<br />
34 Spain 142 3 15 4 -0.46<br />
35 Lithuania 115 2 13 3 -0.44<br />
36 Poland 87 1 11 2 -0.40<br />
37 Croatia 110 2 13 3 -0.35<br />
38 Panama 6,200 343 468 400 -0.32<br />
39 Faroe Islands, DK 235 8 23 10 -0.27<br />
40 Russian Federation 1,243 66 102 72 -0.17<br />
41 Korea, Republic of 75 1 9 1 -0.08<br />
ANNUAL REPORT <strong>2018</strong><br />
27
PORT STATE CONTROL - CONSISTENT COMPLIANCE<br />
GREY LIST<br />
RANK<br />
FLAG<br />
INSPECTIONS<br />
2016-<strong>2018</strong><br />
DETENTIONS<br />
2016-<strong>2018</strong><br />
BLACK TO<br />
GREY LIMIT<br />
GREY TO<br />
WHITE LIMIT<br />
EXCESS<br />
FACTOR<br />
GREY LIST<br />
42 Saudi Arabia 63 1 8 1 0.05<br />
43 United States 206 9 21 8 0.08<br />
44 Libya 30 0 5 0 0.12<br />
45 Algeria 87 3 11 2 0.15<br />
46 Switzerland 100 4 12 2 0.18<br />
47 Egypt 43 1 6 0 0.19<br />
48 Curacao 88 4 11 2 0.26<br />
49 Kazakhstan 52 2 7 0 0.27<br />
50 Thailand 33 1 5 0 0.27<br />
51 Morocco 68 3 9 1 0.28<br />
52 Saint Vincent and the Grenadines 506 33 45 25 0.38<br />
53 Iran, Islamic Republic of 127 9 14 4 0.51<br />
54 Lebanon 71 6 9 1 0.63<br />
55 Azerbaijan 55 5 7 0 0.66<br />
56 Tunisia 41 5 6 0 0.83<br />
57 India 71 8 9 1 0.88<br />
58 Tuvalu 47 6 7 0 0.90<br />
59 Vanuatu 246 24 24 10 0.98<br />
28
ANNUAL REPORT <strong>2018</strong><br />
29
30<br />
PORT STATE CONTROL - CONSISTENT COMPLIANCE
BLACK LIST<br />
RANK<br />
FLAG<br />
INSPECTIONS<br />
2016-<strong>2018</strong><br />
DETENTIONS<br />
2016-<strong>2018</strong><br />
BLACK TO<br />
GREY LIMIT<br />
GREY TO<br />
WHITE LIMIT<br />
EXCESS<br />
FACTOR<br />
BLACK LIST<br />
60 Cook Islands 424 46 39<br />
1.50<br />
61 Belize 361 44 34 Medium Risk<br />
1.84<br />
62 Saint Kitts and Nevis 233 31 23 1.96<br />
63 Albania 69 12 9 Medium to<br />
2.20<br />
64 Mongolia 36 8 6 High Risk<br />
2.65<br />
65 Sierra Leone 333 55 31<br />
3.10<br />
66 Ukraine 82 17 10 3.29<br />
67 Moldova, Republic of 409 69 38 3.31<br />
68 Tanzania, United Republic of 326 58 31 High Risk<br />
3.48<br />
69 Cambodia 44 11 6 3.67<br />
70 Palau 210 41 21 3.74<br />
71 Comoros 351 67 33 3.92<br />
72 Togo 486 92 44<br />
4.03<br />
Very High Risk<br />
73 Congo, Republic of the 98 26 12 5.15<br />
ANNUAL REPORT <strong>2018</strong><br />
31
PORT STATE CONTROL - CONSISTENT COMPLIANCE<br />
DISTRIBUTION OF LISTED AND NON-LISTED FLAGS 2016-<strong>2018</strong><br />
White flags (89.19%)<br />
Grey flags (3.60%)<br />
Black flags (6.44%)<br />
Not listed (0.77%)<br />
ARGENTINA (1)<br />
CAMEROON (1)<br />
GINEA-BISSAU (1)<br />
GABON (1)<br />
KIRIBATI (1)<br />
CANADA (25)<br />
BULGARIA (24)<br />
ISRAEL (24)<br />
EQUATORIAL GUINEA (1)<br />
DJIBOUTI (1)<br />
FIJI (1)<br />
SOUTH AFRICA (1)<br />
NIUE (1)<br />
MEXICO (2)<br />
PAKISTAN (2)<br />
UNITED ARAB EMIRATES (2)<br />
INDONESIA (3)<br />
CONGO (4)<br />
BANGLADESH (4)<br />
ROMANIA (5)<br />
MAURITIUS (5)<br />
SLOVENIA (6)<br />
CHILE (6)<br />
SYRIAN ARAB REPUBLIC (6)<br />
VENEZUELA (6)<br />
FALKLAND ISLANDS (UK) (MALVINAS) (6)<br />
MICRONESIA, FEDERATED STATES OF (7)<br />
JORDAN (8)<br />
DOMINICA (23)<br />
VIRGIN ISLANDS BRITISH (UK) (8)<br />
UNKNOWN (8)<br />
SAMOA (8)<br />
SRI LANKA (22)<br />
GEORGIA (8)<br />
BOLIVIA (8)<br />
BRAZIL (21)<br />
TAIWAN, PROVINCE OF CHINA (9)<br />
TURKMENISTAN (9)<br />
JAMAICA (20)<br />
SEYCHELLES (18)<br />
MONTENEGRO (10)<br />
HONDURAS (10)<br />
BAHRAIN (11)<br />
ICELAND (12)<br />
JERSEY (UK) (12)<br />
QATAR (13)<br />
KUWAIT (14)<br />
MALAYSIA (13)<br />
32
FLAGS MEETING CRITERIA FOR LOW RISK SHIPS <strong>2018</strong><br />
Flags meeting criteria for Low Risk Ships (as per 1 July 2019)<br />
Antigua and Barbuda Bahamas Belgium<br />
Bermuda (UK) Cayman Islands (UK) China<br />
Croatia Cyprus Denmark<br />
Estonia Faroe Islands, DK Finland<br />
France Germany Gibraltar (UK)<br />
Greece Hong Kong, China Ireland<br />
Isle of Man (UK) Italy Japan<br />
Korea, Republic of Latvia Liberia<br />
Lithuania Luxembourg Malta<br />
Marshall Islands Netherlands Norway<br />
Panama Poland Portugal<br />
Russian Federation Singapore Spain<br />
Sweden Turkey United Kingdom<br />
To meet the criteria for Low Risk Ships, flags should be on the Paris MoU White list and have submitted evidence of<br />
having undergone an IMO (V)IMSAS Audit.<br />
Canada<br />
Georgia<br />
Non-listed flags having undergone IMO (V)IMSAS Audit<br />
Malaysia<br />
Slovenia<br />
Flags who’s total number of inspections over a 3-years rolling period do not meet the minimum of 30 are not included in<br />
the Paris MoU White list. Consequently some flags cannot meet the criteria for their ships to qualify as Low Risk Ships<br />
under the Paris MoU, despite having undergone the IMO VIMSAS Audit.<br />
Non-listed flags with no detentions 2016-<strong>2018</strong>*<br />
Argentina (1) Gabon (1) Mexico (2) Slovenia (6)<br />
Bangladesh (4) Guinea-Bissau (1) Micronesia, Federated States of (7) South Africa (1)<br />
Brazil (21) Jamaica (20) Montenegro (10) Syrian Arab Republic (6)<br />
Cameroon (1) Jersey (UK) (12) Niue (1) Taiwan, Province of China (9)<br />
Chile (6) Kiribati (1) Pakistan (2) Turkmenistan (9)<br />
Dominica (23) Kuwait (14) Qatar (13) United Arab Emirates (2)<br />
Falkland Islands (UK) (Malvinas) (6) Malaysia (13) Romania (5) Venezuela (6)<br />
Fiji (1) Mauritius (5) Seychelles (18) Virgin Islands British (UK) (8)<br />
Flags who’s total number of inspections over a 3-years rolling period do not meet the minimum of 30 are not included in<br />
the Paris MoU White, Grey and Black lists. The flags in this table had too few inspections to be included in the lists, but had<br />
no detentions in the mentioned period. * Note: The flags are listed in alphabetical order. The number of inspections over<br />
the mentioned period taken into account is shown in brackets. Flags on this list do not meet the criteria for Low Risk Ships.<br />
ANNUAL REPORT <strong>2018</strong><br />
33
PORT STATE CONTROL - CONSISTENT COMPLIANCE<br />
INSPECTIONS, DETENTIONS AND DEFICIENCIES <strong>2018</strong><br />
Flag<br />
Nr of<br />
Inspections<br />
Inspections<br />
with<br />
deficiencies<br />
Inspections<br />
with<br />
detentions<br />
Nr of<br />
detainable<br />
deficiencies<br />
% of<br />
Inspections<br />
with<br />
deficiencies<br />
% of<br />
Inspections<br />
with<br />
detentions<br />
Albania 29 26 8 89 89.7 27.6<br />
Algeria 28 23 2 5 82.1 7.1<br />
Antigua and Barbuda 784 448 41 171 57.1 5.2<br />
Azerbaijan 19 17 3 15 89.5 15.8<br />
Bahamas 731 345 9 40 47.2 1.2<br />
Barbados 122 62 2 10 50.8 1.6<br />
Belgium 69 42 1 2 60.9 1.4<br />
Belize 109 93 16 107 85.3 14.7<br />
Bermuda (UK) 69 20 - - 29.0 -<br />
Bolivia 1 1 - - 100.0 -<br />
Brazil 10 5 - - 50.0 -<br />
Bulgaria 8 7 - - 87.5 -<br />
Cameroon 1 1 - - 100.0 -<br />
Canada 8 6 - - 75.0 -<br />
Cayman Islands (UK) 167 71 2 6 42.5 1.2<br />
Chile 2 2 - - 100.0 -<br />
China 42 14 1 4 33.3 2.4<br />
Comoros 130 125 20 153 96.2 15.4<br />
Cook Islands 129 114 13 70 88.4 10.1<br />
Croatia 39 13 - - 33.3 -<br />
Curacao 16 12 1 15 75.0 6.3<br />
Cyprus 707 389 20 99 55.0 2.8<br />
Denmark 429 169 8 20 39.4 1.9<br />
Dominica 7 4 - - 57.1 -<br />
Egypt 15 13 - - 86.7 -<br />
Estonia 24 2 - - 8.3 -<br />
Falkland Islands (UK) (Malvinas) 2 2 - - 100.0 -<br />
Faroe Islands 76 50 2 13 65.8 2.6<br />
Finland 156 72 7 20 46.2 4.5<br />
France 98 57 1 10 58.2 1.0<br />
Georgia 4 4 1 3 100.0 25.0<br />
Germany 186 94 1 6 50.5 0.5<br />
Gibraltar (UK) 215 117 5 15 54.4 2.3<br />
Greece 273 97 3 13 35.5 1.1<br />
Honduras 3 3 1 3 100.0 33.3<br />
Hong Kong, China 635 247 8 26 38.9 1.3<br />
India 21 12 1 5 57.1 4.8<br />
Indonesia 3 3 1 1 100.0 33.3<br />
Iran, Islamic Republic of 47 45 3 31 95.7 6.4<br />
34
Flag<br />
Nr of<br />
Inspections<br />
Inspections<br />
with<br />
deficiencies<br />
Inspections<br />
with<br />
detentions<br />
Nr of<br />
detainable<br />
deficiencies<br />
% of<br />
Inspections<br />
with<br />
deficiencies<br />
% of<br />
Inspections<br />
with<br />
detentions<br />
Ireland 51 23 - - 45.1 -<br />
Isle of Man (UK) 202 81 2 6 40.1 1.0<br />
Israel 4 1 - - 25.0 -<br />
Italy 343 152 10 39 44.3 2.9<br />
Jamaica 8 2 - - 25.0 -<br />
Japan 47 14 - - 29.8 -<br />
Jersey (UK) 3 2 - - 66.7 -<br />
Jordan 4 4 1 3 100.0 25.0<br />
Kazakhstan 11 9 1 1 81.8 9.1<br />
Kiribati 1 1 - - 100.0 -<br />
Korea, Republic of 24 9 - - 37.5 -<br />
Kuwait 3 2 - - 66.7 -<br />
Latvia 30 13 - - 43.3 -<br />
Lebanon 18 16 2 9 88.9 11.1<br />
Liberia 1,436 657 29 154 45.8 2.0<br />
Libya 9 5 - - 55.6 -<br />
Lithuania 40 18 1 5 45.0 2.5<br />
Luxembourg 65 25 - - 38.5 -<br />
Malaysia 8 3 - - 37.5 -<br />
Malta 1,531 757 38 171 49.4 2.5<br />
Marshall Islands 1,501 620 14 77 41.3 0.9<br />
Mauritius 1 1 - - 100.0 -<br />
Moldova, Republic of 106 102 6 77 96.2 5.7<br />
Mongolia 14 14 1 4 100.0 7.1<br />
Montenegro 5 3 - - 60.0 -<br />
Morocco 22 18 - - 81.8 -<br />
Netherlands 988 501 19 72 50.7 1.9<br />
Norway 536 275 7 25 51.3 1.3<br />
Palau 77 73 10 49 94.8 13.0<br />
Panama 2,101 1.177 99 642 56.0 4.7<br />
Philippines 45 27 1 5 60.0 2.2<br />
Poland 28 15 - - 53.6 -<br />
Portugal 378 206 11 47 54.5 2.9<br />
Qatar 4 1 - - 25.0 -<br />
Romania 2 2 - - 100.0 -<br />
Russian Federation 448 259 14 57 57.8 3.1<br />
Saint Kitts and Nevis 54 44 5 48 81.5 9.3<br />
Saint Vincent and the Grenadines 155 105 9 51 67.7 5.8<br />
Samoa 8 8 2 13 100.0 25.0<br />
ANNUAL REPORT <strong>2018</strong><br />
35
PORT STATE CONTROL - CONSISTENT COMPLIANCE<br />
Flag<br />
Nr of<br />
Inspections<br />
Inspections<br />
with<br />
deficiencies<br />
Inspections<br />
with<br />
detentions<br />
Nr of<br />
detainable<br />
deficiencies<br />
% of<br />
Inspections<br />
with<br />
deficiencies<br />
% of<br />
Inspections<br />
with<br />
detentions<br />
Saudi Arabia 23 11 1 5 47.8 4.3<br />
Seychelles 5 1 - - 20.0 -<br />
Sierra Leone 122 118 19 131 96.7 15.6<br />
Singapore 653 242 9 22 37.1 1.4<br />
Slovenia 2 - - - - -<br />
Spain 50 23 - - 46.0 -<br />
Sri Lanka 6 4 - - 66.7 -<br />
Sweden 104 48 1 6 46.2 1.0<br />
Switzerland 25 16 1 1 64.0 4.0<br />
Syrian Arab Republic 2 2 - - 100.0 -<br />
Taiwan, Province of China 3 2 - - 66.7 -<br />
Tanzania, United Republic of 124 124 16 161 100.0 12.9<br />
Thailand 6 5 - - 83.3 -<br />
Togo 175 160 26 172 91.4 14.9<br />
Tunisia 12 11 2 8 91.7 16.7<br />
Turkey 304 185 7 41 60.9 2.3<br />
Turkmenistan 5 5 - - 100.0 -<br />
Tuvalu 25 20 5 26 80.0 20.0<br />
Ukraine 29 28 5 40 96.6 17.2<br />
United Kingdom 386 169 2 8 43.8 0.5<br />
United States 71 40 2 2 56.3 2.8<br />
Vanuatu 91 79 6 32 86.8 6.6<br />
Virgin Islands British (UK) 3 2 - - 66.7 -<br />
36
ANNUAL REPORT <strong>2018</strong><br />
37
PORT STATE CONTROL - CONSISTENT COMPLIANCE<br />
<strong>2018</strong> DETENTIONS PER FLAG, EXCEEDING AVERAGE PERCENTAGE<br />
Flag<br />
Nr of<br />
Inspections<br />
Inspections<br />
with<br />
deficiencies<br />
% of<br />
Inspections<br />
with<br />
detentions<br />
Excess of<br />
average <strong>2018</strong><br />
Detentions %<br />
2017<br />
Excess of<br />
average 2017<br />
Albania 29 8 27.6 24.4 11.8 7.9<br />
Tuvalu 25 5 20.0 16.8 - -3.9<br />
Ukraine 29 5 17.2 14.1 23.1 19.2<br />
Sierra Leone 122 19 15.6 12.4 12.9 9.1<br />
Comoros 130 20 15.4 12.2 22.1 18.3<br />
Togo 175 26 14.9 11.7 18.8 14.9<br />
Belize 109 16 14.7 11.5 13.9 10.0<br />
Palau 77 10 13.0 9.8 19.8 15.9<br />
Tanzania, United Republic of 124 16 12.9 9.8 19.0 15.1<br />
Cook Islands 129 13 10.1 6.9 12.4 8.5<br />
Saint Kitts and Nevis 54 5 9.3 6.1 14.5 10.6<br />
Algeria 28 2 7.1 4.0 - -3.9<br />
Vanuatu 91 6 6.6 3.4 7.5 3.6<br />
Iran, Islamic Republic of 47 3 6.4 3.2 11.6 7.8<br />
Saint Vincent and the Grenadines 155 9 5.8 2.7 9.9 6.0<br />
Moldova, Republic of 106 6 5.7 2.5 21.5 17.7<br />
Antigua and Barbuda 784 41 5.2 2.1 4.3 0.4<br />
India 21 1 4.8 1.6 17.4 13.5<br />
Panama 2,101 99 4.7 1.6 6.2 2.4<br />
Finland 156 7 4.5 1.3 2.3 -1.6<br />
Saudi Arabia 23 1 4.3 1.2 - -3.9<br />
Switzerland 25 1 4.0 0.8 - -3.9<br />
Only flags with 20 and more port State control inspections and with a detention percentage exceeding the average<br />
percentage of 3.15% are recorded in this graph. (Last year the average was 3.82%).<br />
38
<strong>2018</strong> DETENTIONS PER FLAG, EXCEEDING AVERAGE PERCENTAGE<br />
Switzerland<br />
Saudi Arabia<br />
Finland<br />
■ Average dentention % <strong>2018</strong><br />
■ Detention percentage <strong>2018</strong><br />
■ Detention percentage 2017<br />
Panama<br />
India<br />
Antigua and Barbuda<br />
Moldova, Republic of<br />
Saint Vincent and the Grenadines<br />
Iran, Islamic Republic of<br />
Vanuatu<br />
Algeria<br />
Saint Kitts and Nevis<br />
Cook Islands<br />
Tanzania, United Republic of<br />
Palau<br />
Belize<br />
Togo<br />
Comoros<br />
Sierra Leone<br />
Ukraine<br />
Tuvalu<br />
Albania<br />
0.00 5.00 10.00 15.00 20.00 25.00 30.00<br />
■ Only flags with 20 and more port State control inspections in <strong>2018</strong> and with a detention percentage exceeding the<br />
average percentage of 3.15% are recorded in this graph. In 2017 the average detentions percentage was 3.82%.<br />
■ The light blue column represents the <strong>2018</strong> average detention percentage (3.15%).<br />
ANNUAL REPORT <strong>2018</strong><br />
39
PORT STATE CONTROL - CONSISTENT COMPLIANCE<br />
INSPECTIONS AND DETENTIONS <strong>2018</strong> PER SHIP TYPE<br />
Ship type<br />
Nr of Inspections<br />
Inspections with<br />
deficiencies<br />
% of inspections<br />
with deficiencies<br />
Nr of Individual<br />
ships inspected<br />
Inspections with<br />
detentions<br />
% of detentions<br />
to inspections<br />
<strong>2018</strong><br />
% of detentions<br />
to inspections<br />
2017<br />
% of detentions<br />
to inspections<br />
2016<br />
+/ - average<br />
detention %<br />
<strong>2018</strong><br />
Bulk carrier 3,711 1,873 50.5 3,350 97 2.6 3.0 3.4 -0.5<br />
Chemical tanker 1,752 736 42.0 1,564 22 1.3 1.4 2.2 -1.9<br />
Combination carrier 6 3 50.0 6 - 0.0 16.7 0.0 -3.2<br />
Commercial yacht 268 115 42.9 266 6 2.2 8.1 2.1 -0.9<br />
Container 1,814 759 41.8 1,612 34 1.9 2.2 1.9 -1.3<br />
Gas carrier 459 151 32.9 433 6 1.3 1.9 1.1 -1.8<br />
General cargo/multipurpose 4,916 3,312 67.4 3,709 308 6.3 7.8 7.2 3.1<br />
Heavy load 49 25 51.0 46 2 4.1 4.3 1.9 0.9<br />
High speed passenger craft 86 60 69.8 48 3 3.5 1.4 3.7 0.3<br />
NLS tanker 31 13 41.9 29 - 0.0 0.0 2.6 -3.2<br />
Offshore supply 437 247 56.5 425 3 0.7 1.6 3.0 -2.5<br />
Oil tanker 1,457 526 36.1 1,367 24 1.6 2.5 1.8 -1.5<br />
Other 239 162 67.8 198 14 5.9 4.8 6.0 2.7<br />
Other special activities 539 270 50.1 507 10 1.9 2.4 1.6 -1.3<br />
Passenger ship 311 156 50.2 262 3 1.0 0.7 1.6 -2.2<br />
Refrigerated cargo 232 148 63.8 206 8 3.4 1.7 3.5 0.3<br />
Ro-Ro cargo 735 303 41.2 639 10 1.4 1.4 2.8 -1.8<br />
Ro-Ro passenger ship 500 276 55.2 271 5 1.0 2.4 2.0 -2.2<br />
Special purpose ship 138 69 50.0 130 2 1.4 1.4 2.2 -1.7<br />
Tug 272 164 60.3 256 9 3.3 1.6 3.3 0.2<br />
40
18.00<br />
16.00<br />
14.00<br />
12.00<br />
10.00<br />
Average detention % <strong>2018</strong><br />
% det. 2016<br />
% det. 2017<br />
% det. <strong>2018</strong><br />
8.00<br />
6.00<br />
4.00<br />
2.00<br />
0.00<br />
General cargo/multipurpose<br />
Other<br />
Heavy load<br />
High speed passenger craft<br />
Refrigerated cargo<br />
Tug<br />
Bulk carrier<br />
Commercial yacht<br />
Container<br />
Other special activities<br />
Oil tanker<br />
Special purpose ship<br />
Ro-Ro cargo<br />
Gas carrier<br />
Chemical tanker<br />
Ro-Ro passenger ship<br />
Passenger ship<br />
Offshore supply<br />
Combination carrier<br />
NLS tanker<br />
ANNUAL REPORT <strong>2018</strong><br />
41
PORT STATE CONTROL - CONSISTENT COMPLIANCE<br />
MAJOR CATEGORIES OF DEFICIENCIES 2016-<strong>2018</strong><br />
Deficiencies Main Group<br />
Category of<br />
deficiencies<br />
2016 2017 <strong>2018</strong><br />
Def Def % Def Def % Def Def %<br />
Certificates & Documentation<br />
Crew Certificates 1,598 3.8 1,598 3.9 1,165 2.9<br />
Documents 2,880 6.8 2,765 6.7 2,881 7.1<br />
Ship Certificates 2,373 5.6 2,382 5.8 2,229 5.5<br />
Structural Condition 1,865 4.4 1,938 4.7 1,880 4.7<br />
Water/Weathertight condition 2,066 4.9 1,798 4.4 1,841 4.6<br />
Emergency Systems 2,174 5.2 2,060 5.0 2,062 5.1<br />
Radio Communication 982 2.3 924 2.2 923 2.3<br />
Cargo operations including equipment 221 0.5 196 0.5 240 0.6<br />
Fire safety 5,409 12.8 5,358 13.0 5,248 13.0<br />
Alarms 339 0.8 399 1.0 368 0.9<br />
Working and Living Conditions<br />
(ILO 147)*<br />
Working and Living Conditions<br />
(MLC, 2006)<br />
Living Conditions 193 0.5 18 0.0 8 0.0<br />
Working conditions 784 1.9 371 0.9 349 0.9<br />
MLC, 2006 Title 1 121 0.3 77 0.2 75 0.2<br />
MLC, 2006 Title 2 553 1.3 385 0.9 357 0.9<br />
MLC, 2006 Title 3 2,046 4.9 2,110 5.1 2,002 5.0<br />
MLC, 2006 Title 4 3,072 7.3 3,411 8.3 3,215 8.0<br />
Safety of Navigation 5,244 12.4 5,611 13.6 4,874 12.1<br />
Life saving appliances 3,642 8.6 3,307 8.0 3,300 8.2<br />
Dangerous goods 62 0.1 62 0.2 64 0.2<br />
Propulsion and auxiliary machinery 2,000 4.7 1,825 4.4 1,627 4.0<br />
Pollution prevention<br />
Anti Fouling 13 0.0 7 0.0 3 0.0<br />
Marpol Annex I 713 1.7 650 1.6 602 1.5<br />
Marpol Annex II 16 0.0 14 0.0 12 0.0<br />
Marpol Annex III 4 0.0 10 0.0 5 0.0<br />
Marpol Annex IV 337 0.8 372 0.9 326 0.8<br />
Marpol Annex V 551 1.3 470 1.1 762 1.9<br />
Marpol Annex VI 429 1.0 426 1.0 691 1.7<br />
Balast Water 0 0.0 76 0.2 572 1.4<br />
ISM 1,855 4.4 1,787 4.3 1,911 4.7<br />
ISPS 379 0.9 521 1.3 555 1.4<br />
Other 210 0.5 197 0.5 221 0.5<br />
* For Member States of the Paris MoU that have not ratified the MLC, 2006, enforcement of the Merchant Shipping<br />
Convention (ILO 147) and the protocol of 1996 to the Merchant Shipping Convention (ILO P147) will initially continue.<br />
42
TOP 5 CATEGORIES OF DEFICIENCIES <strong>2018</strong><br />
Deficiencies<br />
Deficiencies<br />
2017 <strong>2018</strong><br />
% Total<br />
deficiencies<br />
Deficiencies<br />
% Total<br />
deficiencies<br />
Fire safety 5,358 13.03 5,248 13.00<br />
Safety of Navigation 5,611 13.64 4,874 12.07<br />
Life saving appliances 3,307 8.04 3,300 8.17<br />
Labour conditions-Health protection, medical care, social<br />
security<br />
3,411 8.29 3,215 7.96<br />
Certificate & Documentation-Documents 2,765 6.72 2,881 7.14<br />
TOP 5 DEFICIENCIES <strong>2018</strong><br />
Deficiencies<br />
Deficiencies<br />
2017 <strong>2018</strong><br />
% Total<br />
deficiencies<br />
Deficiencies<br />
% Total<br />
deficiencies<br />
ISM 1,787 4.35 1,911 4.73<br />
Fire doors/openings in fire-resisting divisions 1,026 2.49 1,057 2.62<br />
Nautical publications 933 2.27 811 2.01<br />
Charts 800 1.95 693 1.72<br />
Oil record book 573 1.39 661 1.64<br />
ANNUAL REPORT <strong>2018</strong><br />
43
PORT STATE CONTROL - CONSISTENT COMPLIANCE<br />
MARITIME LABOUR CONVENTION, 2006<br />
MLC Deficiencies per Area<br />
Nr MLC<br />
Deficiencies<br />
% of Total of Nr.<br />
MLC deficiencies<br />
Nr Detainable<br />
MLC Deficiencies<br />
% of Detainable<br />
deficiencies of<br />
MLC deficiencies<br />
MLC,2006 Ship’s certificates and documents 235 3.2% 12 5.1%<br />
Area 1 Minimum age of seafarers 2 0.0% 0 0.0%<br />
Area 2 Medical certification of seafarers 171 2.3% 11 6.4%<br />
Area 3 Qualifications of seafarers 13 0.2% 0 0.0%<br />
Area 4 Seafarers’ employment agreements 554 7.5% 33 6.0%<br />
Area 5 Use of any licensed or certified or regulated private<br />
recruitment and placement service for seafarers<br />
19 0.3% 0 0.0%<br />
Area 6 Hours of Works or rest 628 8.5% 20 3.2%<br />
Area 7 Manning levels for the ship 45 0.6% 16 35.6%<br />
Area 8 Accommodation 639 8.6% 40 6.3%<br />
Area 9 On-board recreational facilities 23 0.3% 1 4.3%<br />
Area 10 Food and catering 1,260 17.1% 50 4.0%<br />
Area 11 Health and safety and accident prevention 3,090 41.8% 63 2.0%<br />
Area 12 on-board medical care 219 3.0% 11 5.0%<br />
Area 13 On-board complaint procedure 148 2.0% 3 2.0%<br />
Area 14 Payment of wages 184 2.5% 59 32.1%<br />
Area 15 Certificate or documentary evidence of financial security<br />
for repatriation<br />
Area 16 Certificate or documentary evidence of financial security<br />
relating to shipowners liability<br />
87 1.2% 6 6.9%<br />
73 1.0% 5 6.8%<br />
Total 7,390 100.0% 330 4.5%<br />
MLC DEFICIENCIES TOP 5<br />
Deficiencies<br />
Deficiencies<br />
2017 <strong>2018</strong><br />
% Total<br />
deficiencies<br />
Deficiencies<br />
% Total<br />
deficiencies<br />
Seafarers' employment agreement (SEA) 553 6.8 466 6.3<br />
Electrical 435 5.4 364 4.9<br />
Records of seafarers' daily hours of work or rest 420 5.2 351 4.7<br />
Ropes and wires 337 4.2 303 4.1<br />
Access / structural features (ship) 322 4.0 306 4.1<br />
MLC DETAINABLE DEFICIENCIES TOP 5<br />
MLC detainable deficiencies<br />
Detainable<br />
deficiencies<br />
2017 <strong>2018</strong><br />
% Total<br />
detainable<br />
deficiencies<br />
Detainable<br />
deficiencies<br />
% Total<br />
detainable<br />
deficiencies<br />
Wages 52 11.5 31 9.4<br />
Seafarers' employment agreement (SEA) 42 9.3 31 9.4<br />
Calculation and payment of wages 14 3.1 28 8.5<br />
Manning specified by the minimum safe manning doc 26 5.8 16 4.8<br />
Sanitary Facilities 22 4.9 19 5.8<br />
44
ANNUAL REPORT <strong>2018</strong><br />
45
PORT STATE CONTROL - CONSISTENT COMPLIANCE<br />
DETENTIONS OF SHIPS WITH RO RELATED DETAINABLE DEFICIENCIES PER RECOGNIZED<br />
ORGANIZATION <strong>2018</strong> (CASES IN WHICH 10 OR MORE INSPECTIONS ARE INVOLVED)<br />
Recognized<br />
Organization<br />
Abbr<br />
Total number<br />
of inspections<br />
Number of<br />
individual<br />
ships<br />
inspected*<br />
Total number<br />
of detentions**<br />
Detention % of<br />
total number<br />
of Inspections<br />
+/- Percentage<br />
of Average<br />
<strong>2018</strong>. (0.39)<br />
Detention %<br />
of individual<br />
ships<br />
+/- Percentage<br />
of Average<br />
Indiv, <strong>2018</strong>.<br />
(0.45)<br />
Aegean Register of Shipping CLASSARS 10 8 - - -0.39 - -0.45<br />
American Bureau of Shipping ABS 2,046 1,925 1 0.05 -0.34 0.05 -0.40<br />
ASIA Classification Society ASIA 21 14 1 4.76 4.37 7.14 6.69<br />
Bulgarian Register of Shipping BRS 70 44 2 2.86 2.47 4.55 4.09<br />
Bureau Veritas BV 3,876 3,300 11 0.28 -0.11 0.33 -0.12<br />
China Classification Society CCS 303 289 - - -0.39 - -0.45<br />
Columbus American Register COLAMREG 23 15 3 13.04 12.65 20.00 19.55<br />
Cosmos Marine Bureau Inc. CMB 13 8 1 7.69 7.30 12.50 12.05<br />
Croatian Register of Shipping CRS 51 44 - - -0.39 - -0.45<br />
DNV GL AS DNVGL 6,450 5,621 4 0.06 -0.33 0.07 -0.38<br />
Dromon Bureau of Shipping DBS 205 125 3 1.46 1.07 2.40 1.95<br />
Indian Register of Shipping IRS 77 57 3 3.90 3.51 5.26 4.81<br />
Intermaritime Certification<br />
Services, ICS Class<br />
International Naval Surveys<br />
Bureau<br />
ICS 66 51 1 1.52 1.13 1.96 1.51<br />
INSB 215 151 5 2.33 1.94 3.31 2.86<br />
International Register of Shipping IS 64 47 4 6.25 5.86 8.51 8.06<br />
International Ship Classification ISC 18 9 1 5.56 5.17 11.11 10.66<br />
Iranian Classification Society IRCS 21 16 2 9.52 9.13 12.50 12.05<br />
Isthmus Bureau of Shipping, S.A. IBS 36 30 2 5.56 5.17 6.67 6.21<br />
Korean Register of Shipping KRS 447 426 1 0.22 -0.17 0.23 -0.22<br />
Lloyd's Register LR 4,137 3,689 6 0.15 -0.24 0.16 -0.29<br />
Macosnar Corporation MC 52 38 2 3.85 3.46 5.26 4.81<br />
Maritime Bureau of Shipping MBS 18 12 1 5.56 5.17 8.33 7.88<br />
Maritime Lloyd ML 48 30 2 4.17 3.78 6.67 6.21<br />
Mediterranean Shipping Register MSR 61 28 4 6.56 6.17 14.29 13.83<br />
National Shipping Adjuster Inc. NASHA 88 60 1 1.14 0.75 1.67 1.21<br />
Nippon Kaiji Kyokai NKK 2,785 2,529 8 0.29 -0.10 0.32 -0.14<br />
Novel Classification Society S.A. NCS 16 11 - - -0.39 - -0.45<br />
Other OTHER 176 135 7 3.98 3.59 5.19 4.73<br />
Overseas Marine Certification<br />
Services<br />
Panama Maritime Documentation<br />
Services<br />
OMCS 39 30 1 2.56 2.17 3.33 2.88<br />
PMDS 41 41 - - -0.39 - -0.45<br />
Panama Register Corporation PRC 10 7 - - -0.39 - -0.45<br />
Panama Shipping Registrar Inc. PSR 34 23 1 2.94 2.55 4.35 3.90<br />
Phoenix Register of Shipping PHRS 208 139 3 1.44 1.05 2.16 1.71<br />
Polski Rejestr Statkow (Polish<br />
Register of Shipping)<br />
PRS 199 139 - - -0.39 - -0.45<br />
46
Recognized<br />
Organization<br />
Abbr<br />
Total number<br />
of inspections<br />
Number of<br />
individual<br />
ships<br />
inspected*<br />
Total number<br />
of detentions**<br />
Detention % of<br />
total number<br />
of Inspections<br />
+/- Percentage<br />
of Average<br />
<strong>2018</strong>. (0.39)<br />
Detention %<br />
of individual<br />
ships<br />
+/- Percentage<br />
of Average<br />
Indiv, <strong>2018</strong>.<br />
(0.45)<br />
Register of Shipping (Albania) RSA 17 14 2 11.76 11.38 14.29 13.83<br />
RINA Services S.p.A. RINA 1,628 1,330 4 0.25 -0.14 0.30 -0.15<br />
Russian Maritime Register of<br />
Shipping<br />
RMRS 988 791 - - -0.39 - -0.45<br />
Shipping Register of Ukraine SRU 131 74 7 5.34 4.95 9.46 9.01<br />
Turkish Lloyd TL 143 129 - - -0.39 - -0.45<br />
United Registration and<br />
Classification of Services<br />
URACOS 37 25 2 5.41 5.02 8.00 7.55<br />
Venezuelan Register of Shipping VRS 29 19 1 3.45 3.06 5.26 4.81<br />
* As more than one Recognized Organization might have issued or endorsed statutory certificates with regard to the<br />
same ship, an inspection can be relevant for more than one RO and might appear multiple times in this column.<br />
** Only detentions with RO related detainable deficiencies are taken into account.<br />
% OF DETENTIONS OF SHIPS WITH RO RELATED DETAINABLE DEFICIENCIES PER<br />
RECOGNIZED ORGANIZATION 2016-2017 (CASES IN WHICH MORE THAN 10 INSPECTIONS ARE INVOLVED)<br />
National Shipping Adjuster Inc.<br />
Phoenix Register of Shipping<br />
Dromon Bureau of Shipping<br />
Intermaritime Certification Services, ICS Class<br />
International Naval Surveys Bureau<br />
Overseas Marine Certification Services<br />
Bulgarian Register of Shipping<br />
Panama Shipping Registrar Inc.<br />
Venezuelan Register of Shipping<br />
Macosnar Corporation<br />
Indian Register of Shipping<br />
Other<br />
Maritime Lloyd<br />
ASIA Classification Society<br />
Shipping Register of Ukraine<br />
United Registration and Classification of Services<br />
Maritime Bureau of Shipping<br />
Isthmus Bureau of Shipping, S.A.<br />
International Ship Classification<br />
International Register of Shipping<br />
Mediterranean Shipping Register<br />
Cosmos Marine Bureau Inc.<br />
Iranian Classification Society<br />
Register of Shipping (Albania)<br />
Columbus American Register<br />
Average of <strong>2018</strong><br />
+/- Percentage of Average 2017 (0.41%)<br />
+/- Percentage of Average <strong>2018</strong> (0.39%)<br />
-2% 0% 2% 4% 6% 8% 10% 12% 14%<br />
* Only ROs with 10 and more port State control inspections in <strong>2018</strong> and with a detention percentage exceeding the average<br />
percentage of 0.39 are recorded in this graph. In 2017 the average detention percentage was 0.41.<br />
* The light blue column represents the <strong>2018</strong> average detention percentage. (0.39)<br />
ANNUAL REPORT <strong>2018</strong><br />
47
PORT STATE CONTROL - CONSISTENT COMPLIANCE<br />
RECOGNIZED ORGANIZATION PERFORMANCE TABLE 2016-<strong>2018</strong><br />
Recognized<br />
Organization<br />
RO abrev<br />
Inspections<br />
Detentions<br />
Low/medium limit<br />
Medium / high limit<br />
Excess Factor<br />
Performance level<br />
American Bureau of Shipping ABS 6,009 2 139 102 -1.95<br />
DNV GL AS DNVGL 18,192 18 395 332 -1.88<br />
China Classification Society CCS 869 0 25 10 -1.87<br />
Lloyd's Register LR 12,505 14 276 224 -1.86<br />
Bureau Veritas BV 11,450 25 254 204 -1.74<br />
Nippon Kaiji Kyokai NKK 8,393 23 189 146 -1.66<br />
Korean Register of Shipping KRS 1,233 2 33 16 -1.62<br />
Turkish Lloyd TL 487 0 15 4 -1.60<br />
RINA Services S.p.A. RINA 4,427 13 104 73 -1.60<br />
Russian Maritime Register of Shipping RMRS 2,926 15 71 46 -1.24<br />
Polski Rejestr Statkow (Polish Register of<br />
Shipping)<br />
PRS 531 3 16 5 -0.48<br />
Panama Maritime Documentation Services PMDS 149 0 6 0 0.05<br />
Phoenix Register of Shipping PHRS 496 5 16 4 0.06<br />
High<br />
Croatian Register of Shipping CRS 153 1 6 0 0.19<br />
International Naval Surveys Bureau INSB 617 9 19 6 0.23<br />
Indian Register of Shipping IRS 155 3 6 0 0.49<br />
Overseas Marine Certification Services OMCS 99 2 5 0 0.50<br />
Dromon Bureau of Shipping DBS 542 11 17 5 0.51<br />
Macosnar Corporation MC 131 3 6 0 0.56<br />
Intermaritime Certification Services, ICS<br />
Class<br />
ICS 174 4 7 0 0.57<br />
Isthmus Bureau of Shipping, S.A. IBS 117 4 5 0 0.78<br />
Bulgarian Register of Shipping BRS 237 7 9 1 0.78<br />
National Shipping Adjuster Inc. NASHA 217 7 8 0 0.84<br />
Maritime Bureau of Shipping MBS 84 4 4 0 0.94<br />
Maritime Lloyd - Georgia ML 149 6 6 0 0.96<br />
Other OTHER 399 13 13 3 0.99<br />
Venezuelan Register of Shipping VRS 130 6 6 0 1.15<br />
Mediterranean Shipping Register MSR 150 8 6 0 1.79<br />
International Register of Shipping IS 254 14 9 1 2.44<br />
Panama Shipping Registrar Inc. PSR 97 7 5 0 2.60<br />
Shipping Register of Ukraine SRU 515 30 16 5 3.27<br />
Columbus American Register COLAMREG 67 7 4 0 4.23<br />
Medium<br />
Low<br />
Very Low<br />
In this table only Recognized Organizations that had 60 or more inspections in a 3-year period are taken into account.<br />
The formula is identical to the one used for the White, Grey and Black list. However, the values for P and Q are adjusted to<br />
P=0.02 and Q=0.01.<br />
Performance of recognized organizations is measured over a 3-year rolling period.<br />
48
NUMBER OF CERTIFICATES COVERING RO RESPONSIBLE DETAINABLE DEFICIENCIES <strong>2018</strong><br />
Recognized Organization<br />
RO abrev<br />
Certificates<br />
Total number of<br />
RO detainable<br />
deficiencies<br />
% deficiencies /<br />
certificates<br />
American Bureau of Shipping ABS 19,044 1 0.01<br />
Bulgarian Register of Shipping BRS 538 6 1.12<br />
Bureau Veritas BV 34,250 34 0.10<br />
China Classification Society CCS 3,161 0 0.00<br />
Croatian Register of Shipping CRS 592 0 0.00<br />
DNV GL AS DNVGL 56,659 11 0.02<br />
Dromon Bureau of Shipping DBS 2,481 9 0.36<br />
Indian Register of Shipping IRS 570 6 1.05<br />
Intermaritime Certification Services, ICS Class ICS 506 1 0.20<br />
International Naval Surveys Bureau INSB 1,904 29 1.52<br />
International Register of Shipping IS 667 13 1.95<br />
Isthmus Bureau of Shipping, S.A. IBS 312 3 0.96<br />
Korean Register of Shipping KRS 4,147 6 0.14<br />
Lloyd's Register LR 32,169 24 0.07<br />
Macosnar Corporation MC 432 8 1.85<br />
Maritime Lloyd ML 490 9 1.84<br />
Mediterranean Shipping Register MSR 693 7 1.01<br />
National Shipping Adjuster Inc. NASHA 782 3 0.38<br />
Nippon Kaiji Kyokai NKK 29,359 32 0.11<br />
Other OTHER 1,159 29 2.50<br />
Overseas Marine Certification Services OMCS 140 4 2.86<br />
Panama Maritime Documentation Services PMDS 151 0 0.00<br />
Panama Shipping Registrar Inc. PSR 346 1 0.29<br />
Phoenix Register of Shipping PHRS 1,910 8 0.42<br />
Polski Rejestr Statkow (Polish Register of Shipping) PRS 1,691 0 0.00<br />
RINA Services S.p.A. RINA 13,296 9 0.07<br />
Russian Maritime Register of Shipping RMRS 10,091 0 0.00<br />
Shipping Register of Ukraine SRU 1,441 18 1.25<br />
Turkish Lloyd TL 859 0 0.00<br />
United Registration and Classification of Services URACOS 389 6 1.54<br />
ANNUAL REPORT <strong>2018</strong><br />
49
PORT STATE CONTROL - CONSISTENT COMPLIANCE<br />
REFUSAL OF ACCESS (BANNING) PER FLAG 2016-<strong>2018</strong><br />
Flag<br />
Failed to call<br />
at indicated<br />
repair yard<br />
Jumped<br />
detention<br />
Multiple detentions<br />
1 st ban 2 nd ban 3 rd ban<br />
Total<br />
Banned<br />
Albania - - 1 - - 1<br />
Belize - - 2 - - 2<br />
Comoros 1 - 13 1 - 15<br />
Cook Islands - - 1 - - 1<br />
India - - 1 - - 1<br />
Liberia 1 - - - - 1<br />
Moldova, Republic of - - 9 2 - 11<br />
Palau - - 1 - - 1<br />
Panama 1 - - - - 1<br />
Saint Kitts and Nevis - - 2 - - 2<br />
Sierra Leone - - 1 1 - 2<br />
Tanzania, United Republic of 1 - 14 3 - 18<br />
Togo - - 17 2 - 19<br />
Vanuatu - - 1 1 - 2<br />
Total 4 - 63 10 - 77<br />
REFUSAL OF ACCESS 2009-<strong>2018</strong><br />
35<br />
30<br />
No valid ISM code certificate<br />
Jumped detentions<br />
Failed to call at indicated repair yard<br />
Multiple detentions<br />
25<br />
20<br />
15<br />
10<br />
5<br />
0<br />
2009 2010 2011 2012 2013 2014 2015 2016 2017 <strong>2018</strong><br />
50
ANNUAL REPORT <strong>2018</strong><br />
51
PORT STATE CONTROL - CONSISTENT COMPLIANCE<br />
CIC <strong>2018</strong> MARPOL ANNEX VI<br />
Number of ships inspected<br />
during CIC<br />
Nr of<br />
individual<br />
ships<br />
inspected<br />
during CIC<br />
Nr of<br />
inspections<br />
performed<br />
with a CIC<br />
questionnaire<br />
Nr of<br />
inspections<br />
without a CIC<br />
questionnaire<br />
Inspections 4,217 4,021 283<br />
Inspections with detentions 140 131 9<br />
Detentions with CIC-topic related deficiencies 7 7 0<br />
Number of inspections<br />
performed per ship<br />
during CIC<br />
1 3,975 1.0<br />
2 23 0.0<br />
3 0 0.0<br />
Total 3,998 1.0<br />
Nr of ships<br />
% of total<br />
Ship type<br />
Nr of<br />
inspections<br />
Nr of<br />
detentions<br />
Detention<br />
as % of<br />
inspections<br />
Detentions<br />
CIC-topic<br />
related<br />
Detentions<br />
CIC-topic<br />
related<br />
as % of<br />
inspections<br />
Bulk carrier 887 29 3.3 2 0.2<br />
Chemical tanker 426 4 0.9 0 0.0<br />
Commercial yacht 32 1 3.1 1 3.1<br />
Container 402 3 0.7 0 0.0<br />
Gas carrier 100 1 1.0 0 0.0<br />
General cargo/multipurpose 1,172 77 6.6 2 0.2<br />
Heavy load 11 0 0.0 0 0.0<br />
High speed passenger craft 3 1 33.3 0 0.0<br />
NLS tanker 5 0 0.0 0 0.0<br />
Offshore supply 100 0 0.0 0 0.0<br />
Oil tanker 355 7 2.0 1 0.3<br />
Other 55 1 1.8 0 0.0<br />
Other special activities 112 2 1.8 0 0.0<br />
Passenger ship 38 0 0.0 0 0.0<br />
Refrigerated cargo 54 2 3.7 0 0.0<br />
Ro-Ro cargo 163 1 0.6 1 0.6<br />
Ro-Ro passenger ship 21 0 0.0 0 0.0<br />
Special purpose ship 22 0 0.0 0 0.0<br />
Tug 63 2 3.2 0 0.0<br />
Total 4,021 131 3.3 7 0.2<br />
52
ANNUAL REPORT <strong>2018</strong><br />
53
PORT STATE CONTROL - CONSISTENT COMPLIANCE<br />
Explanatory note - “WHITE”,<br />
“GREY” AND “BLACK LIST”<br />
The normative listing of Flags provides an independent<br />
categorization that has been prepared<br />
on the basis of Paris MoU port State inspection<br />
results over a 3-year period, based on binomial<br />
calculus.<br />
The performance of each Flag is calculated using a<br />
standard formula for statistical calculations in which<br />
certain values have been fixed in accordance with agreed<br />
Paris MoU policy. Two limits have been included in the<br />
system, the ‘black to grey’ and the ‘grey to white’ limit,<br />
each with its own specific formula:<br />
u black _ to_ grey<br />
= N ⋅ p + 0.5+ z (N ⋅ p⋅(1− p)<br />
u white_ to_ grey<br />
= N ⋅ p − 0.5− z (N ⋅ p⋅(1− p)<br />
In the formula “N” is the number of inspections, “p” is<br />
the allowable detention limit (yardstick), set to 7% by<br />
the Paris MoU Port State Control Committee, and “z” is<br />
the significance requested (z=1.645 for a statistically<br />
acceptable certainty level of 95%). The result “u“ is<br />
the allowed number of detentions for either the Black<br />
or White List. The “u“ results can be found in the table.<br />
A number of detentions above this ‘black to grey’ limit<br />
means significantly worse than average, where a number<br />
of detentions below the ‘grey to white’ limit means<br />
significantly better than average. When the amount of<br />
detentions for a particular Flag is positioned between the<br />
two, the Flag will find itself on the Grey List. The formula<br />
is applicable for sample sizes of 30 or more inspections<br />
over a 3-year period.<br />
To sort results on the Black or White List, simply alter the<br />
target and repeat the calculation. Flags which are still<br />
significantly above this second target, are worse than<br />
the flags which are not. This process can be repeated to<br />
create as many refinements as desired. (Of course the<br />
maximum detention rate remains 100%!) To make the<br />
flags’ performance comparable, the excess factor (EF)<br />
is introduced. Each incremental or decremental step<br />
corresponds with one whole EF-point of difference. Thus<br />
the EF is an indication for the number of times the yardstick<br />
has to be altered and recalculated. Once the excess factor<br />
is determined for all flags, the flags can be ordered by EF.<br />
The excess factor can be found in the last column of the<br />
White, Grey or Black List. The target (yardstick) has been<br />
set on 7% and the size of the increment and decrement<br />
on 3%.<br />
The White/Grey/Black Lists have been calculated in<br />
accordance with the principles above*.<br />
The graphical representation of the system below is<br />
showing the direct relations between the number of<br />
inspected ships and the number of detentions. Both axes<br />
have a logarithmic character as the ‘black to grey’ or the<br />
‘grey to white’ limit.<br />
1,000<br />
Number of Detentions<br />
100<br />
10<br />
EF= 4 and above<br />
EF= 3 to 4<br />
EF= 2 to 3<br />
EF= 1 to 2<br />
very high risk<br />
high risk<br />
medium to high risk<br />
medium risk<br />
EF= 4<br />
EF= 3<br />
EF= 2<br />
EF= 1 Black<br />
EF= 0 White<br />
EF= -1<br />
EF= -2<br />
1<br />
Number of Inspections<br />
* Explanatory notes can be found on www.parismou.org/publications<br />
56
Secretariat Paris Memorandum<br />
OF UNDERSTANDING ON PORT<br />
STATE CONTROL<br />
COLOPHON<br />
STAFF<br />
Mr. Luc Smulders<br />
Secretary-General<br />
Mr. Ronald Hulhoven<br />
Secretary<br />
PHOTOGRAPHS<br />
Cover photo: Portugal<br />
Paris MoU Authorities<br />
Secretariat<br />
Frans de Vree Fotografie<br />
Mrs. Carien Droppers<br />
Deputy Secretary-General<br />
Mr. Ivo Snijders<br />
Secretary<br />
Mr. Maarten Vlag<br />
Secretary<br />
Mr. Lourens van ‘t Wout<br />
ICT Advisor<br />
Mrs. Melany Cadogan - Eskici<br />
Office Manager<br />
Mrs. Ingrid de Vree<br />
Management Assistant<br />
ADDRESS SECRETARIAT<br />
Rijnstraat 8<br />
P.O. Box 16191<br />
2500 BD The Hague<br />
The Netherlands<br />
Telephone: +31 70 456 1508<br />
www.parismou.org<br />
E-mail: secretariat@parismou.org<br />
ANNUAL REPORT <strong>2018</strong><br />
57
58<br />
PORT STATE CONTROL - CONSISTENT COMPLIANCE
Paris MoU fact sheet -<br />
ORGANIZATIONAL STRUCTURE<br />
Maritime<br />
Authorities<br />
European<br />
Commission<br />
Co-operating<br />
Maritime<br />
Authorities<br />
Observers:<br />
IMO, ILO,<br />
other MoU’s<br />
Port State Control Committee<br />
MoU Advisory Board (MAB)<br />
THETIS<br />
Information System<br />
Paris MoU Secretariat<br />
Taskforces<br />
Technical Evaluation Group<br />
Ship inspection<br />
services of<br />
Paris MoU port States<br />
Owners, Flags and<br />
Recognized Organizations<br />
ANNUAL REPORT <strong>2018</strong><br />
59