Trading Report October 2019
Report on trading activity at BSP SouthPool Energy Exchange
Report on trading activity at BSP SouthPool Energy Exchange

Create successful ePaper yourself
Turn your PDF publications into a flip-book with our unique Google optimized e-Paper software.
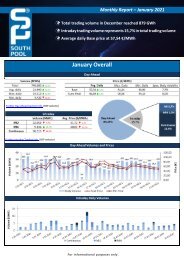
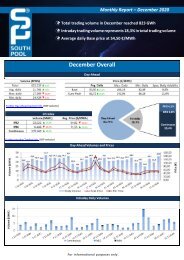
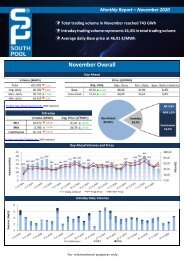
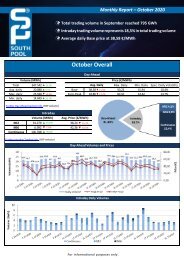
Monthly <strong>Report</strong> – <strong>October</strong> <strong>2019</strong><br />
)<br />
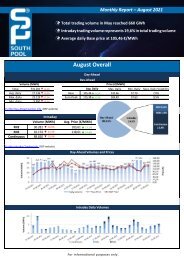
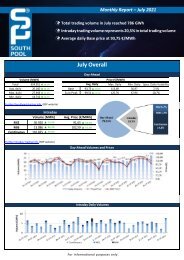
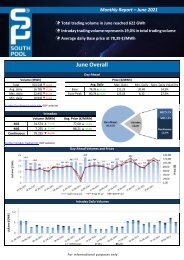
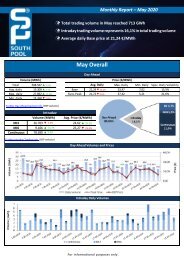
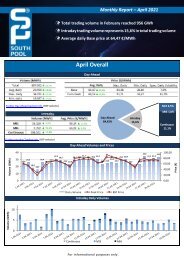
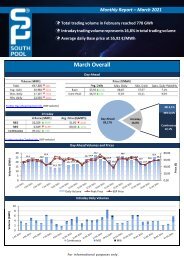
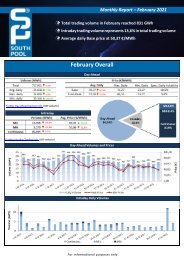
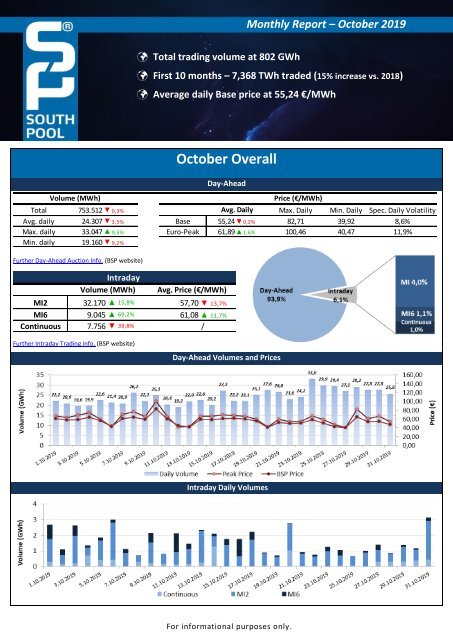
Total trading volume at 802 GWh<br />
First 10 months – 7,368 TWh traded (15% increase vs. 2018)<br />
Average daily Base price at 55,24 €/MWh<br />
Volume (MWh)<br />
Further Day-Ahead Auction Info. (BSP website)<br />
<strong>October</strong> Overall<br />
Day-Ahead<br />
Total 753.512 ▼ 0,3% Avg. Daily Max. Daily Min. Daily Spec. Daily Volatility<br />
Avg. daily 24.307 ▼ 3,5% Base 55,24▼0,2% 82,71 39,92 8,6%<br />
Max. daily 33.047 ▲ 9,5% Euro-Peak 61,89▲1,6% 100,46 40,47 11,9%<br />
Min. daily 19.160 ▼ 9,2%<br />
Intraday<br />
Volume (MWh)<br />
Avg. Price (€/MWh)<br />
MI2 32.170 ▲ 15,8% 57,70 ▼ 13,7%<br />
MI6 9.045 ▲ 69,2% 61,08 ▲ 11,7%<br />
Continuous 7.756 ▼ 39,8% /<br />
Price (€/MWh)<br />
Further Intraday <strong>Trading</strong> info. (BSP website)<br />
Day-Ahead Volumes and Prices<br />
Intraday Daily Volumes<br />
For informational purposes only.
Day-Ahead further Auction info.<br />
Average Hourly Volumes and Prices<br />
Hour (AM) 1 2 3 4 5 6 7 8 9 10 11 12<br />
Volume (MWh) 847 943 1060 1060 977 878 910 988 1055 1033 1015 1007<br />
Base price (€/MWh) 43,10 40,76 38,31 37,38 37,66 42,25 54,22 64,85 64,96 62,03 60,33 60,73<br />
Hour (PM) 13 14 15 16 17 18 19 20 21 22 23 24<br />
Volume (MWh) 1054 1032 1011 1042 1075 1127 1149 1124 1051 1016 932 893<br />
Daily volatility of base price<br />
Base price (€/MWh) 58,40 55,48 55,05 56,45 60,27 63,87 70,23 74,93 68,56 59,65 52,10 44,22<br />
Cross-Zonal Capacities<br />
SI→IT IT→SI SI→AT AT→SI SI→HR<br />
Offered (MWh) 483.343 497.960 935.772 319.778 936.977 1.298.023 4.471.853<br />
Allocated (MWh) 65.523 234.564 506 313.056 202.997 98.449 915.094<br />
% Allocated 13,56% 47,10% 0,05% 97,90% 21,67% 7,58%<br />
Daily Volatility of Base Price<br />
HR→SI<br />
Total<br />
Methodology used for calculation of volatility.<br />
MI2 & MI6 Implicit Auctions<br />
Allocated CZC Values on Slovenian-Italian Border<br />
Cross-Zonal-Capacities<br />
SI-IT IT-SI Total<br />
Offered (MWh)<br />
Allocated (MWh)<br />
% Allocated<br />
640.385<br />
21.775<br />
3,40%<br />
78.788<br />
7.349<br />
9,33%<br />
719.173<br />
29.124<br />
/<br />
Read more about European Pilot Project<br />
Implicit Intraday Auctions (MI2 & MI6)<br />
Intraday Continuous <strong>Trading</strong><br />
Volumes by Products<br />
For informational purposes only.
Past 12 Months Trade Information<br />
Day-Ahead Auction<br />
Avg. Monthly Volume (MWh) 687.078<br />
Avg. Daily Volume (MWh) 22.589<br />
Avg. Base Price (€/MWh) 53,15<br />
Avg. Euro-Peak Price (€/MWh) 58,96<br />
Avg. SI-IT offered (MWh)/Avg. % Allocated 386.960 / 54,9%<br />
Avg. IT-SI offered (MWh)/Avg.% Allocated 465.266 / 19,3%<br />
Avg. SI-AT offered (MWh)/Avg. % Allocated 833.204 / 2,3%<br />
Avg. AT-SI offered (MWh)/Avg. % Allocated 477.088 / 72,7%<br />
Avg. SI-HR offered (MWh)/Avg. % Allocated 805.983 / 22,0%<br />
Avg. HR-SI offered (MWh)/Avg. % Allocated 1.286.856 / 7,4%<br />
Day-Ahead Market Volumes and Prices<br />
Intraday Continuous <strong>Trading</strong><br />
Avg. Monthly Volume (MWh) 11.116<br />
Avg. Nbr. Of Transactions 397<br />
MI2 & MI6 Implicit Auctions<br />
Avg. Monthly volume MI2 (MWh) 26.216<br />
Avg. Monthly volume MI6 (MWh) 7.351<br />
Avg. SI-IT offered (MWh)/Avg. % Allocated 261.044 / 3,5%<br />
Avg. IT-SI offered (MWh)/Avg.% Allocated 286.800 / 3,9%<br />
Intraday Volumes (MWh)<br />
Total Volume in the past 12 months Continuous ■ MI2 ■ MI6 ■<br />
Nov. 18 8.931 11.143 5.232<br />
Dec. 18 9.184 34.805 8.461<br />
Jan. 19 16.963 45.294 11.469<br />
Feb. 19 18.696 15.475 4.217<br />
Mar. 19 9.737 10.862 2.265<br />
Apr. 19 9.983 23.972 5.738<br />
303.020<br />
May. 19 10.299 16.901 4.707<br />
Jun. 19 9.999 23.118 11.256<br />
Jul. 19 9.834 34.572 11.544<br />
137.340<br />
Aug. 19 13.075 26.922 5.042<br />
84.320 Sep. 19 12.887 27.784 5.345<br />
Oct. 19 7.756 32.170 9.045<br />
Absolute Difference Between MI and Day-Ahead Prices & MI Offered Cross-Zonal Capacities<br />
*Cross-Zonal Capacities not allocated on Day-Ahead Auction are later offered for MI2 and MI6 Auctions.<br />
For informational purposes only.
BSP Energy Exchange LL C<br />
Dunajska 156<br />
SI-1000 Ljubljana<br />
Slovenija<br />
+386 1 620 76 76<br />
+386 1 620 76 77<br />
www.bsp-southpool.com<br />
info@bsp-southpool.com<br />
For informational purposes only.